

Combination of Machine Learning Techniques to Predict Overweight/Obesity in Adults
- PMID: 39202009
- PMCID: PMC11355742
- DOI: 10.3390/jpm14080816
Combination of Machine Learning Techniques to Predict Overweight/Obesity in Adults
Abstract
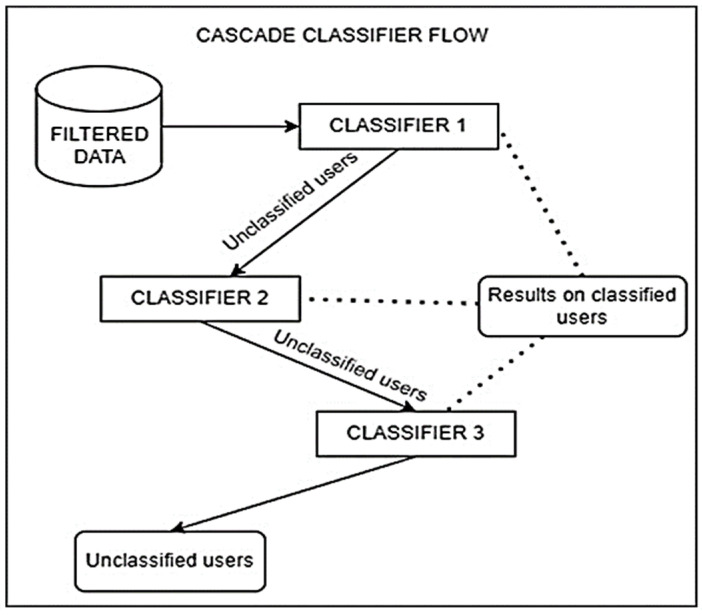
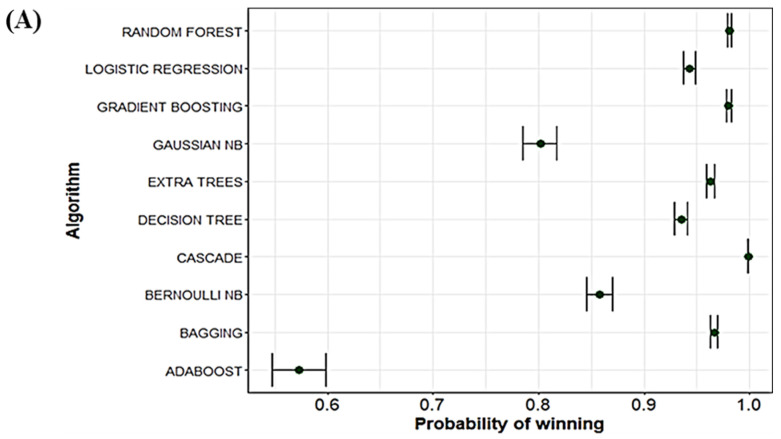
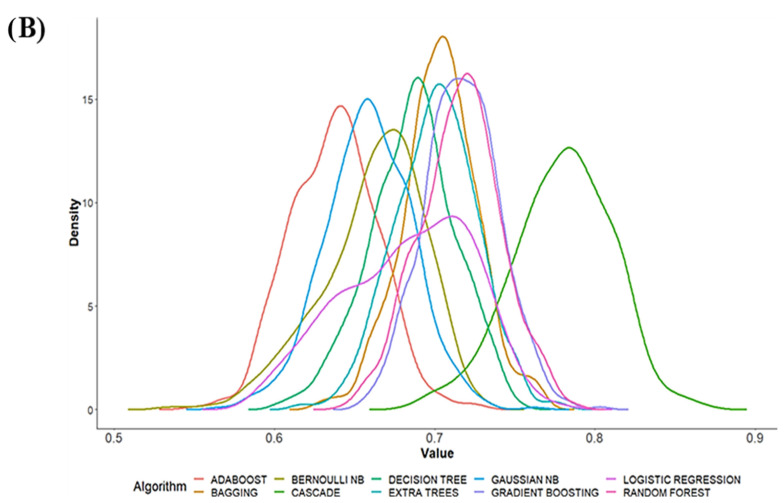
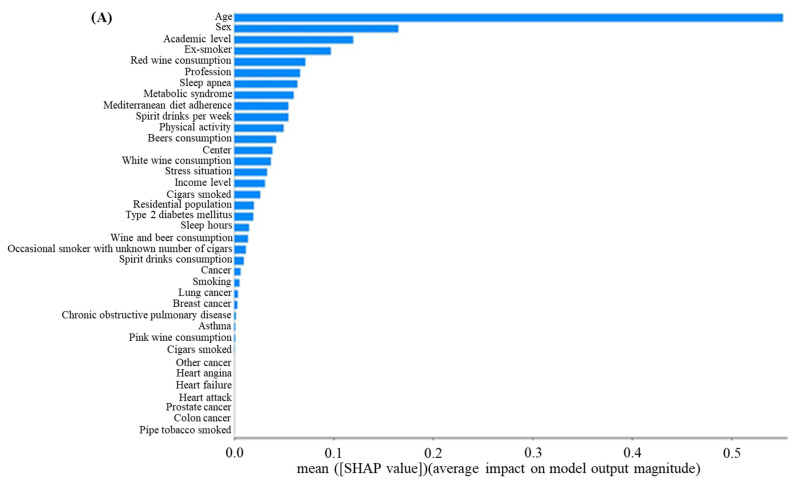
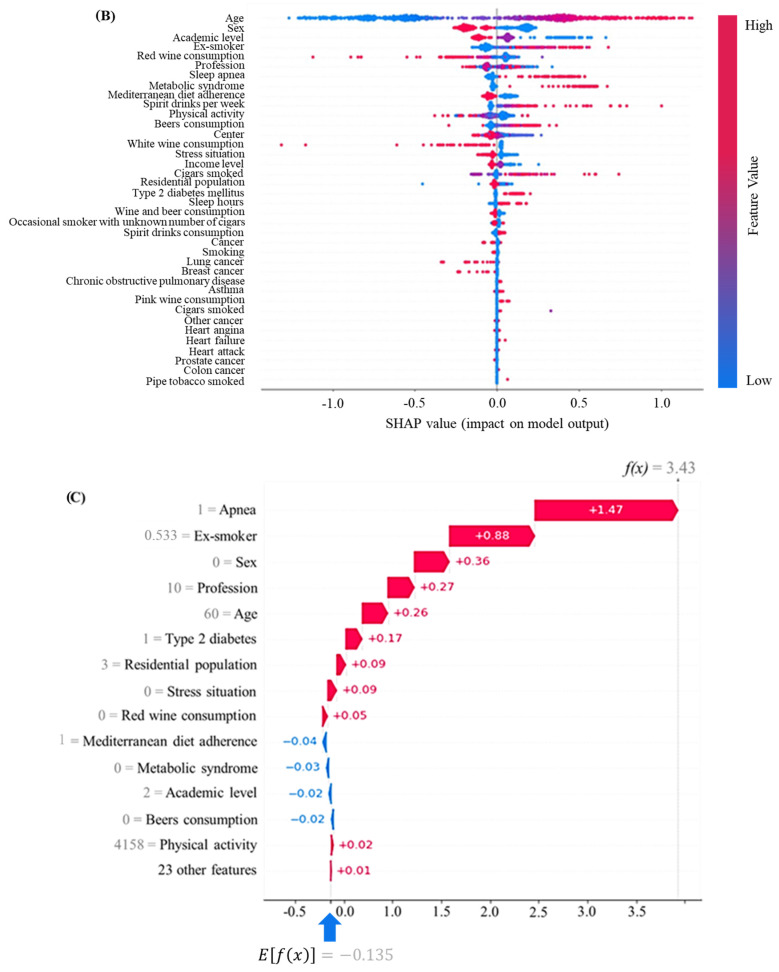
(1) Background: Artificial intelligence using machine learning techniques may help us to predict and prevent obesity. The aim was to design an interpretable prediction algorithm for overweight/obesity risk based on a combination of different machine learning techniques. (2) Methods: 38 variables related to sociodemographic, lifestyle, and health aspects from 1179 residents in Madrid were collected and used to train predictive models. Accuracy, precision, and recall metrics were tested and compared between nine classical machine learning techniques and the predictive model based on a combination of those classical machine learning techniques. Statistical validation was performed. The shapely additive explanation technique was used to identify the variables with the greatest impact on weight gain. (3) Results: Cascade classifier model combining gradient boosting, random forest, and logistic regression models showed the best predictive results for overweight/obesity compared to all machine learning techniques tested, reaching an accuracy of 79%, precision of 84%, and recall of 89% for predictions for weight gain. Age, sex, academic level, profession, smoking habits, wine consumption, and Mediterranean diet adherence had the highest impact on predicting obesity. (4) Conclusions: A combination of machine learning techniques showed a significant improvement in accuracy to predict risk of overweight/obesity than machine learning techniques separately.
Keywords: artificial intelligence; machine learning; overweight/obesity; predictive model.
Conflict of interest statement
The authors declare no conflicts of interest.
Figures
Similar articles
-
Using interpretable machine learning methods to identify the relative importance of lifestyle factors for overweight and obesity in adults: pooled evidence from CHNS and NHANES.BMC Public Health. 2024 Nov 1;24(1):3034. doi: 10.1186/s12889-024-20510-z. BMC Public Health. 2024. PMID: 39487401 Free PMC article.
-
Can Predictive Modeling Tools Identify Patients at High Risk of Prolonged Opioid Use After ACL Reconstruction?Clin Orthop Relat Res. 2020 Jul;478(7):0-1618. doi: 10.1097/CORR.0000000000001251. Clin Orthop Relat Res. 2020. PMID: 32282466 Free PMC article.
-
Predicting risk of obesity in overweight adults using interpretable machine learning algorithms.Front Endocrinol (Lausanne). 2023 Nov 17;14:1292167. doi: 10.3389/fendo.2023.1292167. eCollection 2023. Front Endocrinol (Lausanne). 2023. PMID: 38047114 Free PMC article.
-
Predicting Overweight and Obesity Status Among Malaysian Working Adults With Machine Learning or Logistic Regression: Retrospective Comparison Study.JMIR Form Res. 2022 Dec 7;6(12):e40404. doi: 10.2196/40404. JMIR Form Res. 2022. PMID: 36476813 Free PMC article.
-
Prediction of adolescent weight status by machine learning: a population-based study.BMC Public Health. 2024 May 20;24(1):1351. doi: 10.1186/s12889-024-18830-1. BMC Public Health. 2024. PMID: 38769481 Free PMC article.
References
-
- Consumer Affairs Ministry of Health and Social Welfare. National Health Survey. Spain. 2017. [(accessed on 15 January 2021)]. Available online: https://www.sanidad.gob.es/estadEstudios/estadisticas/encuestaNacional/e.... (In Spanish)
-
- WHO Obesity and Overweight. 2024. [(accessed on 15 July 2024)]. Available online: https://www.who.int/news-room/fact-sheets/detail/obesity-and-overweight.
-
- Cheadle A., Atiedu A., Rauzon S., Schwartz P.M., Keene L., Davoudi M., Spring R., Molina M., Lee L., Boyle K., et al. A Community-Level Initiative to Prevent Obesity: Results from Kaiser Permanente’s Healthy Eating Active Living Zones Initiative in California. Am. J. Prev. Med. 2018;54((Suppl. S2)):S150–S159. doi: 10.1016/j.amepre.2018.01.024. - DOI - PubMed
Grants and funding
LinkOut - more resources
Full Text Sources
