. 2024 Aug 6;14(8):831.
doi: 10.3390/jpm14080831.

Integrative Analysis of Multi-Omics Data to Identify Deregulated Molecular Pathways and Druggable Targets in Chronic Lymphocytic Leukemia

Affiliations

Integrative Analysis of Multi-Omics Data to Identify Deregulated Molecular Pathways and Druggable Targets in Chronic Lymphocytic Leukemia

Dimitra Mavridou et al. J Pers Med. .

Abstract

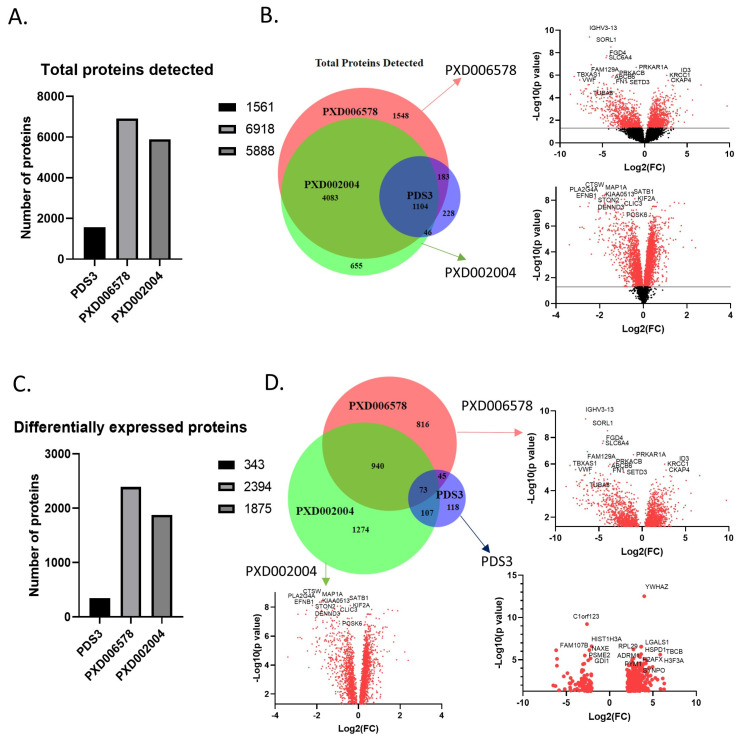
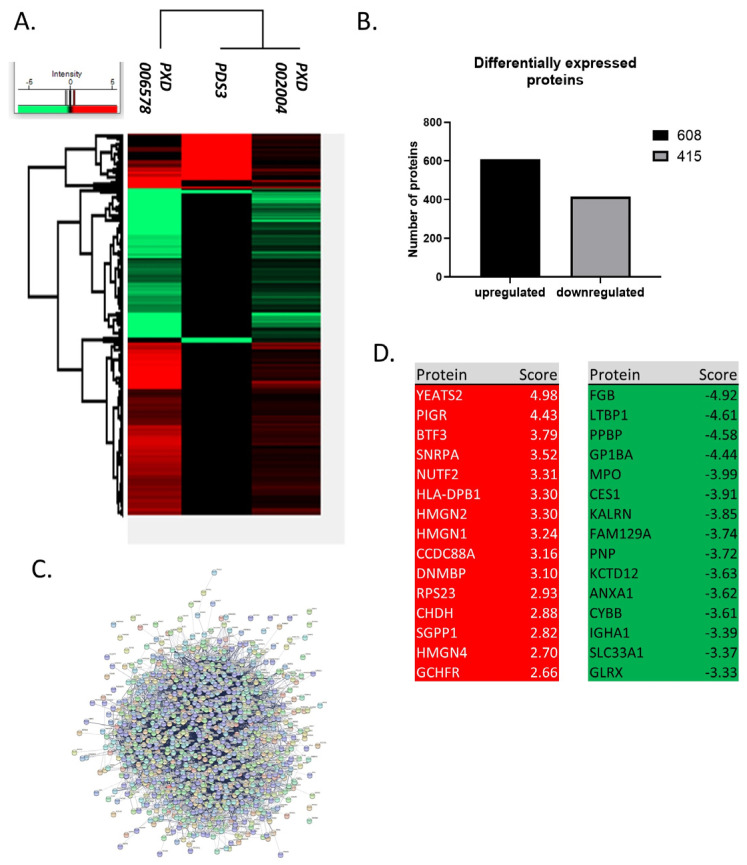
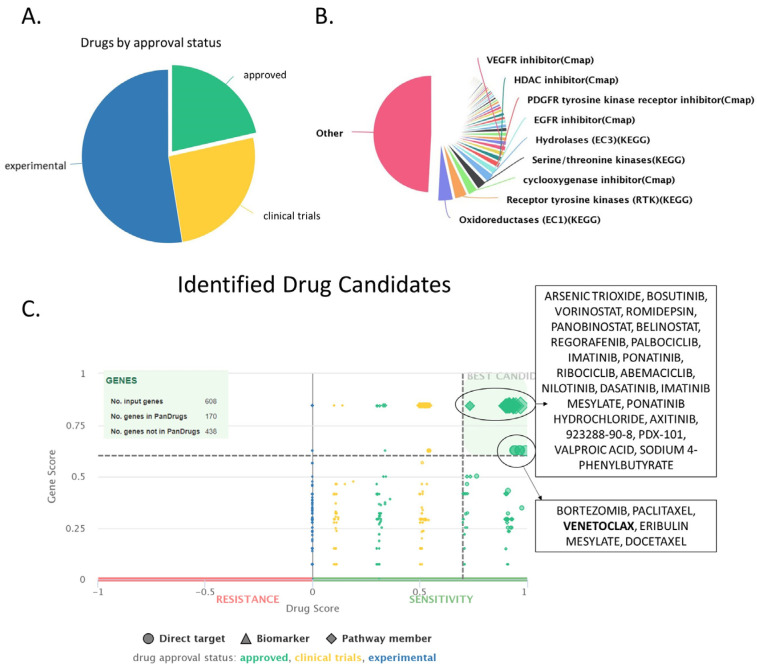
Chronic Lymphocytic Leukemia (CLL) is the most common B-cell malignancy in the Western world, characterized by frequent relapses despite temporary remissions. Our study integrated publicly available proteomic, transcriptomic, and patient survival datasets to identify key differences between healthy and CLL samples. We exposed approximately 1000 proteins that differentiate healthy from cancerous cells, with 608 upregulated and 415 downregulated in CLL cases. Notable upregulated proteins include YEATS2 (an epigenetic regulator), PIGR (Polymeric immunoglobulin receptor), and SNRPA (a splicing factor), which may serve as prognostic biomarkers for this disease. Key pathways implicated in CLL progression involve RNA processing, stress resistance, and immune response deficits. Furthermore, we identified three existing drugs-Bosutinib, Vorinostat, and Panobinostat-for potential further investigation in drug repurposing in CLL. We also found limited correlation between transcriptomic and proteomic data, emphasizing the importance of proteomics in understanding gene expression regulation mechanisms. This generally known disparity highlights once again that mRNA levels do not accurately predict protein abundance due to many regulatory factors, such as protein degradation, post-transcriptional modifications, and differing rates of translation. These results demonstrate the value of integrating omics data to uncover deregulated proteins and pathways in cancer and suggest new therapeutic avenues for CLL.

Keywords: chronic lymphocytic leukemia; drug repurposing; lymphoma; personalized medicine; proteomics; transcriptomics.


Conflict of interest statement

The authors declare no conflicts of interest.

Figures

Figure 1
Figure 1
An Integrated Bioinformatics Workflow for Data Analysis and Drug Discovery in CLL. (1) Data Acquisition: The workflow begins with the acquisition of -omics data from various databases including ProteomeXchange, GEO, UCSC Xena, and PRIDE. This step involves collecting-omics data from CLL patients and control groups represented by orange and green dots, respectively. (2) Data Processing and Analysis: The collected data is then processed, integrated and analyzed using tools such as Perseus, Google Colab, and Venny. This step is visualized with bar charts depicting differentially expressed genes or proteins between CLL patients and control groups (red: up-regulated, green: down-regulated). (3). Functional Analysis: Next, functional analysis of the deregulated genes or proteins is performed using databases and tools like STRING, Cytoscape, Gene Ontology, and KEGG. The results are illustrated as interaction networks and pathways between differentially expressed genes or proteins. (4) Drug Discovery: Finally, the workflow integrates drug discovery databases such as DrugBank, PANDRUGS, and ClinicalTrials.gov to identify potential therapeutic targets and existing drugs that could be repurposed. In this step, repurposed drugs are depicted as aligning with specific deregulated pathways and proteins. This comprehensive workflow allows for the systematic integration of multi-omics data, functional analysis, and drug repurposing, facilitating the identification of potential therapeutic targets and treatments in CLL.
Figure 2
Figure 2
Proteins detected in the three selected proteomics datasets. (A) Total proteins detected in each dataset. The small number of proteins identified in the PDS3 dataset is due to the different approach. (B) Venn diagram and volcano plots of the total proteins detected. Venn diagram shows the common proteins identified in the three datasets, covering almost 70% of the proteins. Volcano plots show the deregulation of the proteins in relation with the probability. PDS3 has no volcano plot cause the whole data were not publicly available. (C) Differentially expressed proteins in each dataset. Filters used are p-value < 0.05 and log2(FC) > 0.3 (0.1). (D) Venn diagram and volcano plots of the differentially expressed proteins. 1165 proteins were detected in at least two datasets. The red dots in the volcano plot indicate significant protein detection, whereas black dots not significant.
Figure 3
Figure 3
Differentially expressed proteins in CLL. (A) Heatmap of differentially expressed proteins in CLL. There are 1023 differentially expressed proteins between healthy and CLL samples detected in at least two datasets and modified in the same direction (up or down-regulation) between datasets. (B) Number of deregulated proteins in CLL. 608 proteins are up-regulated and 415 are downregulated. (C) Protein-protein interactions of the deregulated proteins. There are strong interactions between proteins that are deregulated in CLL. (D) Top 15 up- and down-regulated proteins. The deregulated proteins include several known candidates implicated with both the initiation and the progression of CLL, such as FAM50A, IKZF3, KRAS, MAP2K1, SAMHD1 and SF3B1. Top 15 upregulated proteins have a 6–32 fold increase, while down regulated proteins have a 10–30 fold decrease (score: Log2(FC)).
Figure 4
Figure 4
Main interactors of the top deregulated proteins and how they are affected in CLL. (A) Interactors of YEATS2. YEATS2 seems to be co-expressed with its already known interactor WDR5, only at the proteomic level. (B) Interactors of PIGR. PIGR is upregulated both in proteomic and transcriptomic level, whereas its interactors, FCRL5, FCRL2, and PIGM, were upregulated only at the transcriptomic level. (C) Interactors of BTF3. BTF3 seems to have co-expression with RPS23 at the proteomic level. (D) Interactors of SNRPA. SNRPA has co-expression with the most of its interactors (SNRPA1, SNRPB, SNRPC, SNRD2, SNRD3, SNRPF and U2AF2) at proteomic level and only one interactor, SNRPE, found to be upregulated at transcriptomic level. (E) Interactors of NUTF2. NUP62 was only found up-regulated both at proteomic and transcriptomic level and NUP214 was up-regulated at transcriptomic level. (F) Interactors of PPBP. PPBP was also found down-regulated at transcriptomics level, as many of its interactors (CCR1, CCR2, CXCR4 and PF4), whereas only one interactor, PF4 was down-regulated at proteomics level. (G) Interactors of GP1BA. Two of its interactors, ITGAM and ITGB, were also found downregulated both at proteomic and transcriptomic level, while two, YWHAZ and SELP had opposite behavior. (H) Interactors of MPO. MPO seems to co-expressed with AZU1, PRTN3, APOA1 and CES1, whereas PTGS1 was also found deregulated at transcriptomic level. Red triangles depict over-expression, Green depicts under-expression, Colored filled triangles depict deregulation at proteomic level, Plain triangles depict deregulation at transcriptomic level. The thickness of the lines correlates with the confidence (the strength of the data support) in the network connections between proteins (solid lines: connections with high confidence; dotted lines: connections with lower confidence).
Figure 5
Figure 5
Survival-Kaplan–Meier curves of the top 10 deregulated proteins in CLL. Among the top 5 up-regulated proteins, (A) YEATS2, (B) PIGR, (D) SNRPA and (E) NUTF2 have a lower survival probability in CLL patients, apart from (C) BTF3 that seems to affect survival only during the initial days of disease development. Among the top 5 down-regulated proteins, (F) FGB, (G) LTBP1 and (H) PPBP seem to not affect the survival curves, while (I) GP1BA and (J) MPO, when they are downregulated, heavily affected patient survival. Xena Browser compares the different Kaplan–Meier curves using the log-rank test. The Browser reports the test statistics (χ2) and p-value (χ2 distribution).
Figure 6
Figure 6
Integration of proteomics and transcriptomics data. (A) Heatmap of the two selected transcriptomic datasets. The two datasets display a similar transcriptome profile. (B) Number of identifiers in each dataset used for the data integration. “Proteomics” represents the list of the 1023 common differential expressed proteins. (C) Venn diagram of the two transcriptomics datasets and the proteomics list. Essentially, the list of differentially expressed proteins “fished” their genes from the transcriptomics datasets. (D) Scatter plot of the common identifiers at both proteomics and transcriptomics level. Zoom in the most up- or down-regulated proteins that have common regulation at both proteomic and transcriptomic level.
Figure 7
Figure 7
Protein-protein interaction networks of upregulated and downregulated proteins using stringDB. For both networks the following parameters were used: interactions characterized by confidence (instead of only evidence) and clustering of all proteins based on k-means. (A) Only upregulated proteins were used to create this network. Proteins were grouped into 6 main clusters and overrepresentation analysis was performed using the built-in stringDB tool. Each cluster was manually labeled with the function (or pathway) mediated by the proteins belonging in that cluster. (B) Same analysis as with (A), using the downregulated set of proteins.
Figure 7
Figure 7
Protein-protein interaction networks of upregulated and downregulated proteins using stringDB. For both networks the following parameters were used: interactions characterized by confidence (instead of only evidence) and clustering of all proteins based on k-means. (A) Only upregulated proteins were used to create this network. Proteins were grouped into 6 main clusters and overrepresentation analysis was performed using the built-in stringDB tool. Each cluster was manually labeled with the function (or pathway) mediated by the proteins belonging in that cluster. (B) Same analysis as with (A), using the downregulated set of proteins.
Figure 8
Figure 8
Protein-protein interaction networks of upregulated and downregulated proteins using cytoscape. (A) Upregulated proteins were used to create this network. GOlorize tool was used to visualize the Gene Ontology (GO) categories which are statistically overrepresented in the upregulated set of proteins. Each cluster was manually labeled with the function (or pathway) mediated by the proteins belonging in that cluster. (B) Same analysis as with (A), using the downregulated set of proteins. Unique refers to proteins that are categorized into multipleGO categories. These proteins are considered unique because there is no other protein classified into the exact same combination of GO categories. This distinct classification underscores their unique functional annotations within the dataset.
Figure 9
Figure 9
Drug identification using the Pandrugs software (version: 2024.06), based on the upregulated set of proteins (608 proteins). (A) Pie chart depicting an overview of the approval status (approved, experimental or in clinical trials) of the identified compounds. (B) Overview of the main drug families that the identified compounds belong in. (C) Drug score chart depicting all identified compounds separated based on their dscore (considers factors such as approval status, number of associated genes and numbers of sources, x-axis) and gscore (considers the importance of the targeted genes for the cancer cell, y-axis). Drugs with high g- and d-score are characterized as best candidates, and they are depicted in upper right corner of the graph.

Similar articles

Cited by

References

    1. Khoury J.D., Solary E. The 5th edition of the World Health Organization Classification of Haematolymphoid Tumours: Myeloid and Histiocytic/Dendritic Neoplasms. Leukemia. 2022;36:1703–1719. doi: 10.1038/s41375-022-01613-1. - DOI - PMC - PubMed
    1. Cree I.A. The WHO Classification of Haematolymphoid Tumours. Leukemia. 2022;36:1701–1702. doi: 10.1038/s41375-022-01625-x. - DOI - PMC - PubMed
    1. Alaggio R., Amador C. The 5th edition of the World Health Organization Classification of Haematolymphoid Tumours: Lymphoid Neoplasms. Leukemia. 2022;36:1720–1748. doi: 10.1038/s41375-022-01620-2. - DOI - PMC - PubMed
    1. Braish J., Cerchione C., Ferrajoli A. An overview of prognostic markers in patients with CLL. Front. Oncol. 2024;14:1371057. doi: 10.3389/fonc.2024.1371057. - DOI - PMC - PubMed
    1. Maher N., Mouhssine S. Treatment Refractoriness in Chronic Lymphocytic Leukemia: Old and New Molecular Biomarkers. Int. J. Mol. Sci. 2023;24:10374. doi: 10.3390/ijms241210374. - DOI - PMC - PubMed

LinkOut - more resources