. 2024 Aug 12;14(8):856.
doi: 10.3390/jpm14080856.

AI-Driven Thoracic X-ray Diagnostics: Transformative Transfer Learning for Clinical Validation in Pulmonary Radiography

Affiliations

AI-Driven Thoracic X-ray Diagnostics: Transformative Transfer Learning for Clinical Validation in Pulmonary Radiography

Md Abu Sufian et al. J Pers Med. .

Abstract

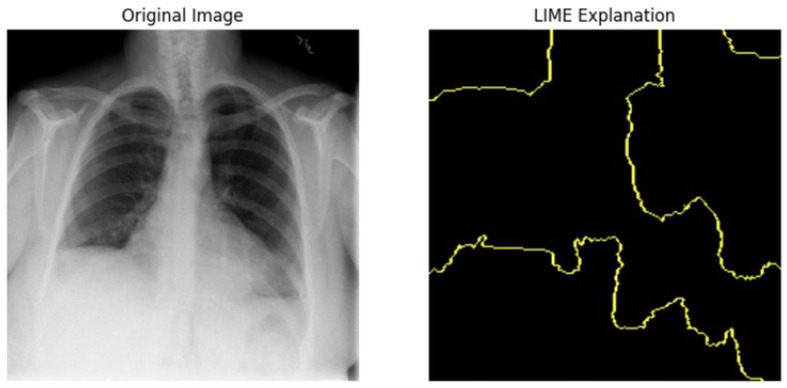
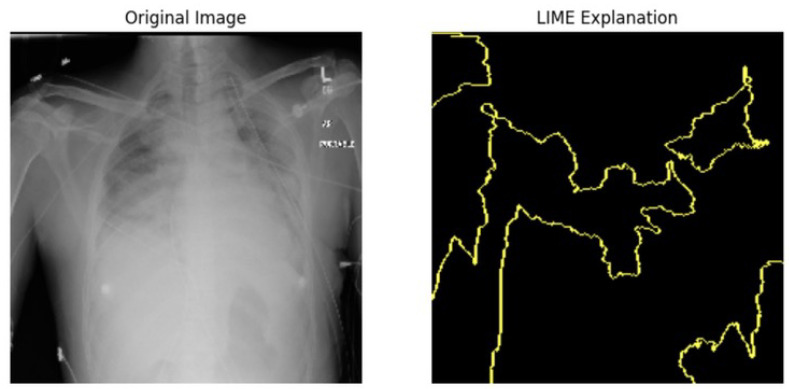
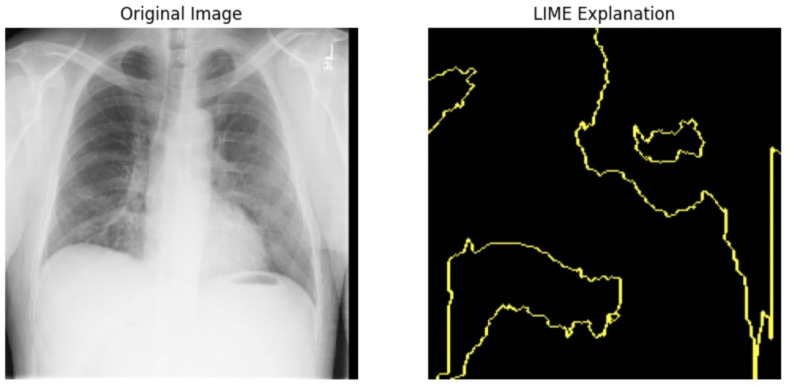
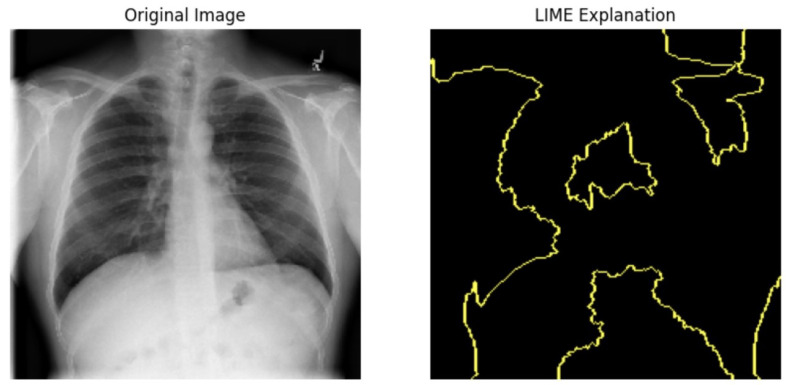
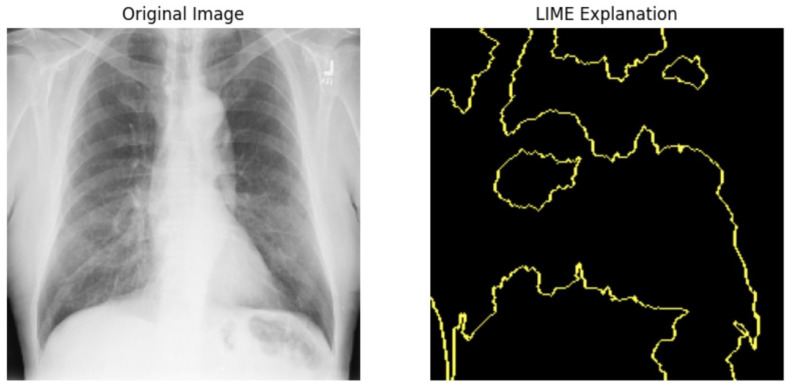
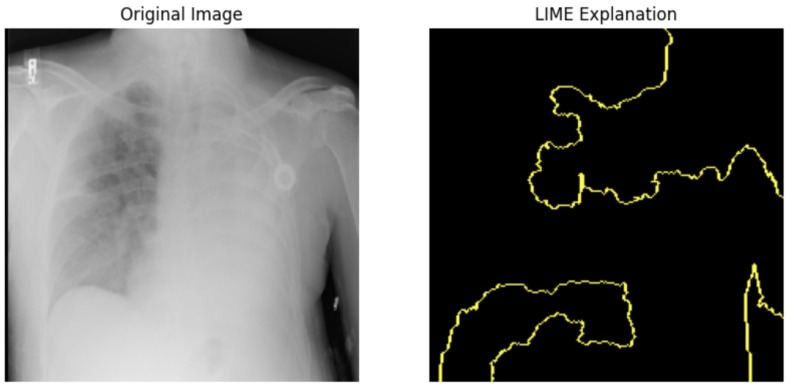
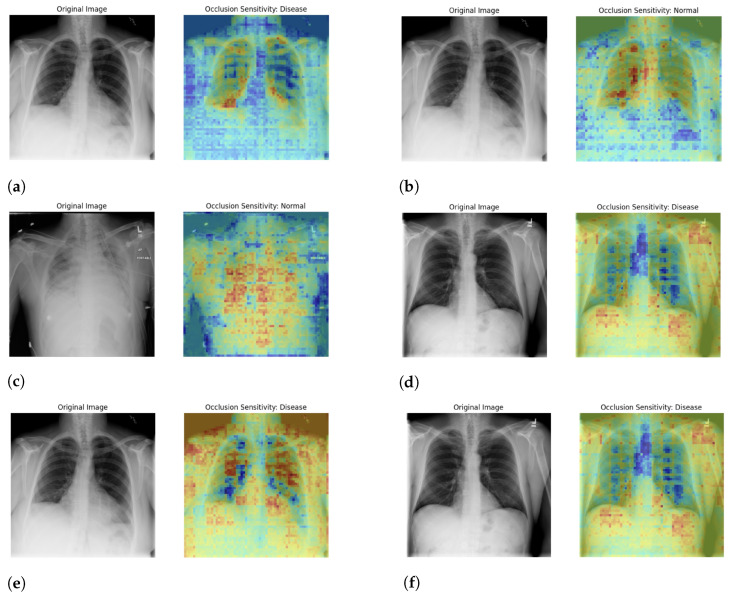
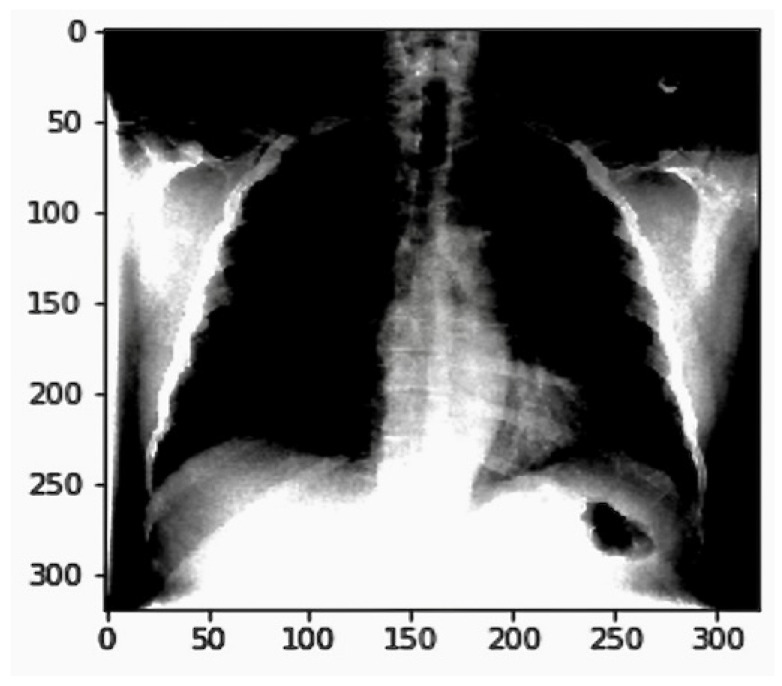
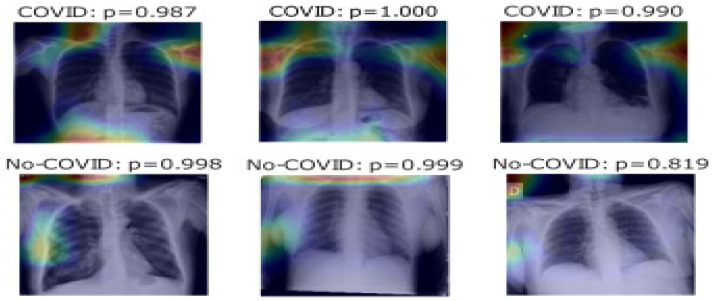
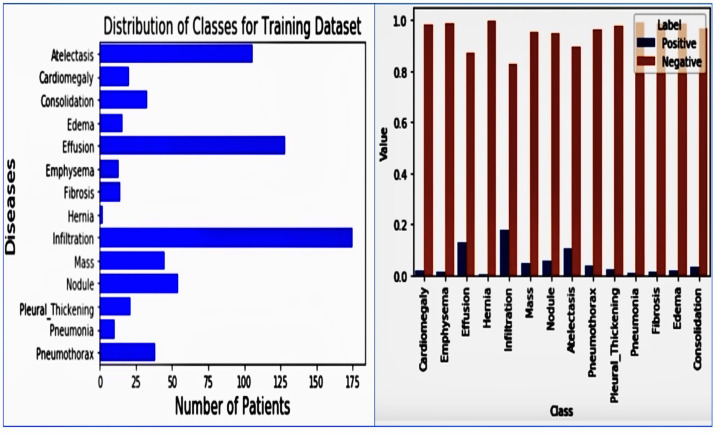
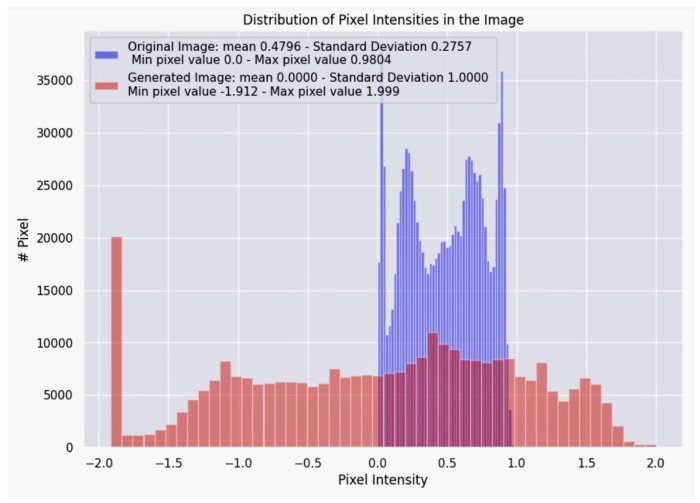
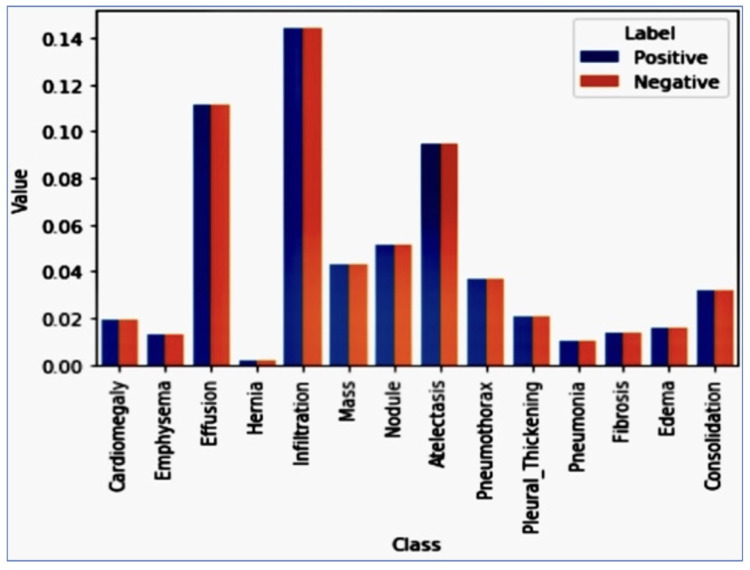
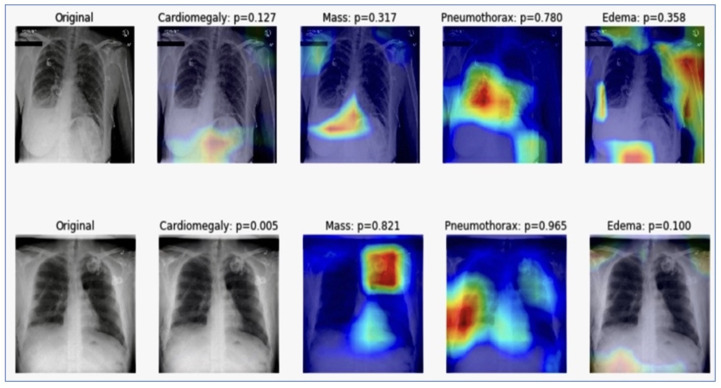
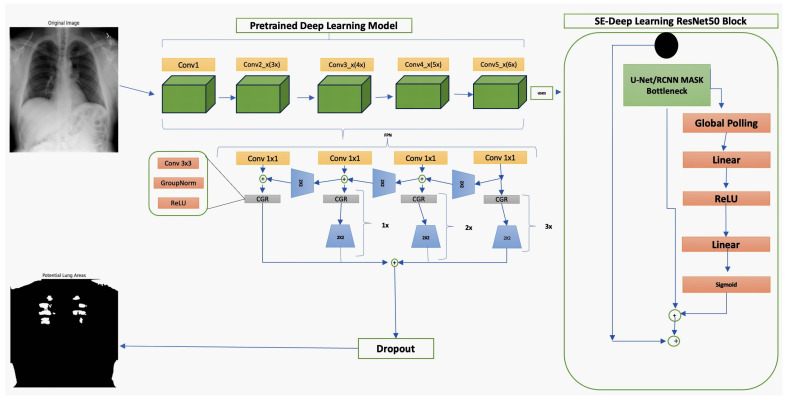
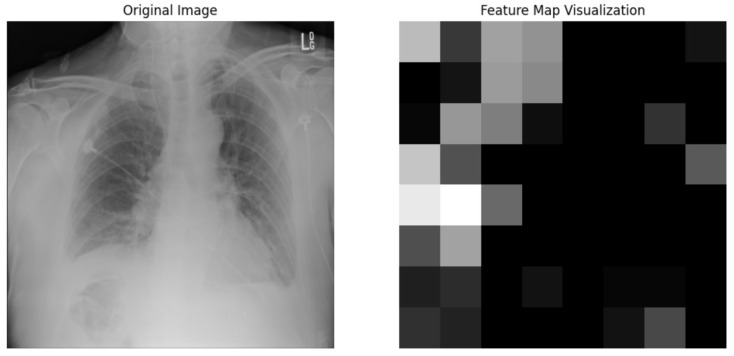
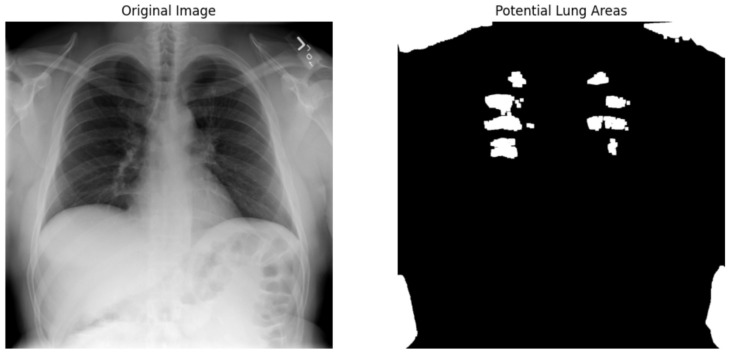
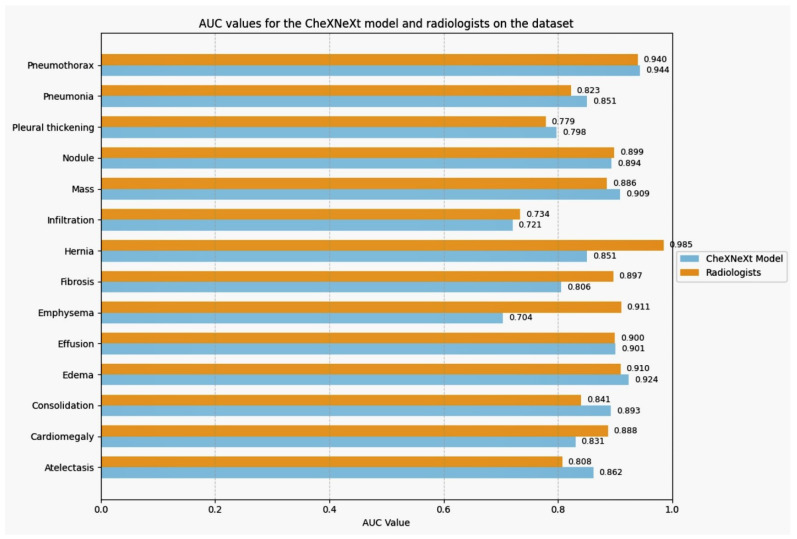
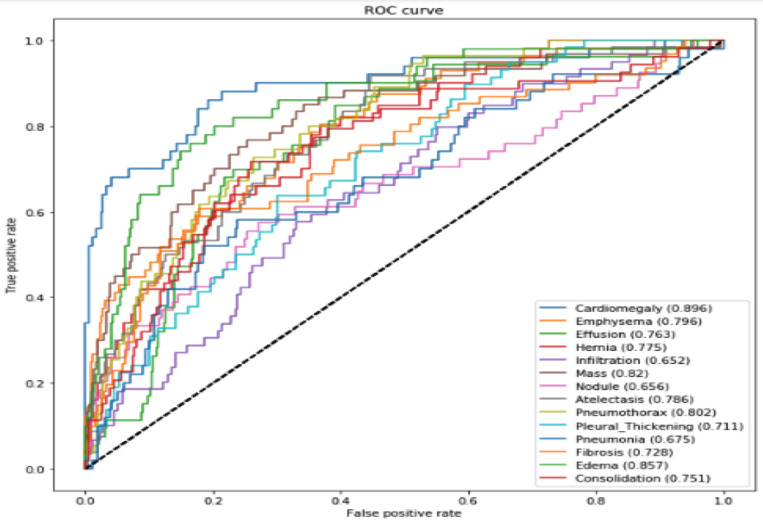
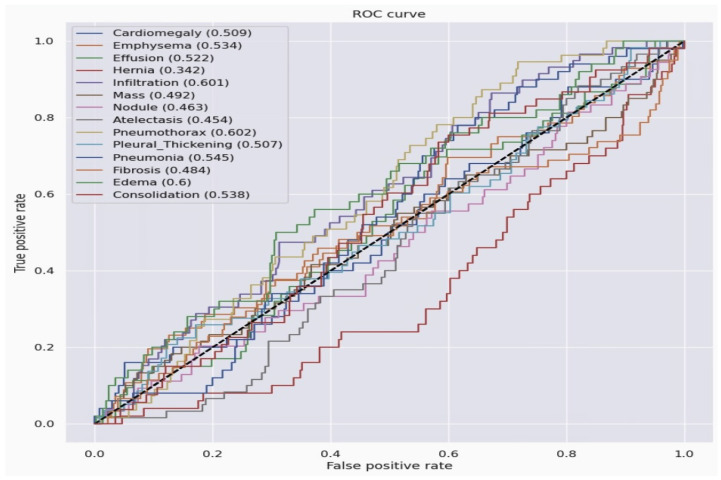
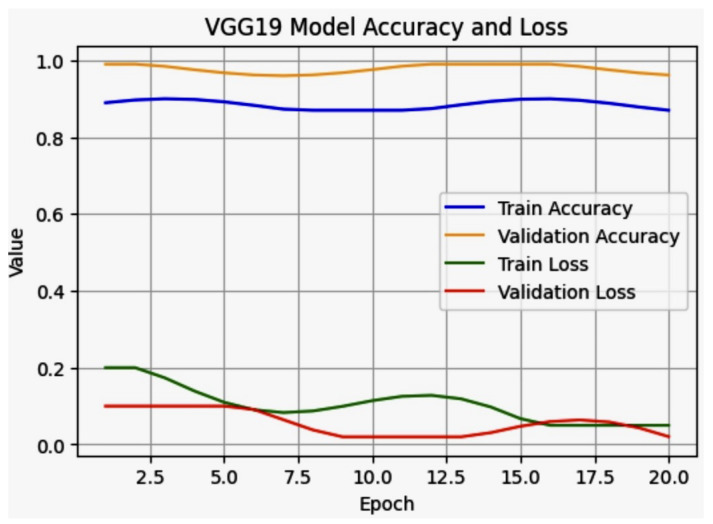
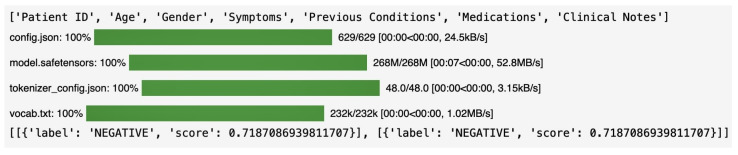
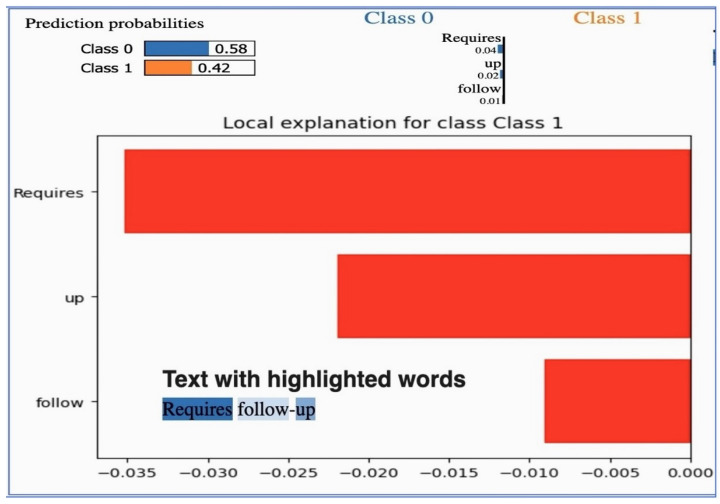
Our research evaluates advanced artificial (AI) methodologies to enhance diagnostic accuracy in pulmonary radiography. Utilizing DenseNet121 and ResNet50, we analyzed 108,948 chest X-ray images from 32,717 patients and DenseNet121 achieved an area under the curve (AUC) of 94% in identifying the conditions of pneumothorax and oedema. The model's performance surpassed that of expert radiologists, though further improvements are necessary for diagnosing complex conditions such as emphysema, effusion, and hernia. Clinical validation integrating Latent Dirichlet Allocation (LDA) and Named Entity Recognition (NER) demonstrated the potential of natural language processing (NLP) in clinical workflows. The NER system achieved a precision of 92% and a recall of 88%. Sentiment analysis using DistilBERT provided a nuanced understanding of clinical notes, which is essential for refining diagnostic decisions. XGBoost and SHapley Additive exPlanations (SHAP) enhanced feature extraction and model interpretability. Local Interpretable Model-agnostic Explanations (LIME) and occlusion sensitivity analysis further enriched transparency, enabling healthcare providers to trust AI predictions. These AI techniques reduced processing times by 60% and annotation errors by 75%, setting a new benchmark for efficiency in thoracic diagnostics. The research explored the transformative potential of AI in medical imaging, advancing traditional diagnostics and accelerating medical evaluations in clinical settings.

Keywords: artificial intelligence; deep learning; diagnostic accuracy; medical imaging; model interpretability; pulmonary radiography.


Conflict of interest statement

The authors declare no conflicts of interest.

Figures

Figure 22
Figure 22
LIME Analysis for Image Data (a) on original image to LIME explanation.
Figure 23
Figure 23
LIME Analysis for Image Data (b) on original image to LIME explanation.
Figure 24
Figure 24
LIME Analysis for Image Data (c) on original image to LIME explanation.
Figure 25
Figure 25
LIME Analysis for Image Data (d) on original image to LIME explanation.
Figure 26
Figure 26
LIME Analysis for Image Data (e) on original image to LIME explanation.
Figure 27
Figure 27
LIME Analysis for Image Data (f) on original image to LIME explanation.
Figure 28
Figure 28
Occlusion Sensitivity Map Analysis on labeled (af) image data. This figure demonstrates the occlusion sensitivity map analysis applied to labeled image data. By systematically occluding different parts of the image and observing the changes in the model’s predictions, this analysis helps identify the most crucial regions that influence the model’s decision-making process.
Figure 1
Figure 1
Data Assembly Process. The diagram illustrates the comprehensive steps involved in assembling the dataset, including data collection from hospital radiology departments, anonymization by removing patient identifiers to ensure ethical compliance, initial labeling using automated natural language processing (NLP) techniques, manual verification by radiologists, and rigorous quality control processes before finalizing the dataset.
Figure 2
Figure 2
Visualization of RGB data using Imshow, with RGB values normalized to the range [0, 1] for float representation. This figure illustrates how Imshow processes and displays RGB color data accurately.
Figure 3
Figure 3
Detection of COVID-19 in X-ray images using convolutional neural networks (CNNs). This figure illustrates the process and results of using CNNs to identify COVID-19 related anomalies in chest X-rays, highlighting the areas of the lungs affected by the virus.
Figure 4
Figure 4
Image pre-processing in Keras. This figure demonstrates the steps involved in pre-processing images using the Keras library, including resizing, normalization, and augmentation techniques to prepare the images for training in a neural network.
Figure 5
Figure 5
Distribution of classes for the training dataset and the relationship between values and classes. This figure illustrates the frequency of each class within the training dataset, along with a comparison of various values against these classes to provide insights into the dataset composition and balance.
Figure 6
Figure 6
Distribution of pixel intensity of an image. This figure displays the histogram of pixel intensities, illustrating the frequency of each intensity level across the image. It provides insights into the image’s contrast, brightness, and overall tonal distribution.
Figure 7
Figure 7
Implementation of weight loss in neural networks. This figure demonstrates the process of incorporating weight loss functions during the training phase of neural networks to prevent overfitting and improve generalization.
Figure 8
Figure 8
Training a neural network using DenseNet121. This figure illustrates the process of training a model with the DenseNet121 architecture, highlighting key steps such as data input, model configuration, and training iterations. DenseNet121 is known for its dense connectivity between layers, which can improve gradient flow and feature reuse.
Figure 9
Figure 9
Visualizing learning with Grad-CAM. This figure demonstrates the use of Grad-CAM to visualize which regions of an image contribute most to the neural network’s prediction. By highlighting important areas, Grad-CAM helped in understanding and interpreting the decision-making process of the model.
Figure 10
Figure 10
Image segmentation probability visualization. This figure illustrates the probability maps generated during the image segmentation process, showing the likelihood of each pixel belonging to different segments. It provided insights into the model’s confidence and accuracy in distinguishing various regions within the image.
Figure 11
Figure 11
Feature Pyramid Network (FPN) architecture with ResNet module. This figure illustrates the integration of the FPN architecture with the ResNet module, demonstrating how feature maps are extracted at multiple scales and combined to improve object detection performance. The FPN enhances the model’s ability to detect objects of varying sizes by leveraging the hierarchical feature representation of ResNet.
Figure 12
Figure 12
Feature extraction map on original image to feature map visualisaiton.
Figure 13
Figure 13
Chest Xray potential area mark on original image to potential lung area.
Figure 14
Figure 14
Class imbalance in the dataset. This figure highlights the distribution of classes within the dataset, illustrating the prevalence of class imbalance. Such imbalance can affect the performance of machine learning models by biasing predictions towards the majority class.
Figure 15
Figure 15
Class frequencies in the dataset. This figure shows the frequency of each class within the dataset, illustrating the distribution and relative abundance of different classes. Understanding class frequencies is crucial for addressing class imbalance and ensuring fair and accurate model training.
Figure 16
Figure 16
AUC values for the CheXNeXt model and radiologists on the dataset. This figure compares the AUC values for the CheXNeXt model and human radiologists, highlighting the performance of the deep learning model in diagnosing medical conditions from chest X-ray images relative to expert radiologists.
Figure 17
Figure 17
Evaluation of the DenseNet121 model results using the ROC curve. This figure displays the ROC curve for the DenseNet121 model, illustrating the model’s performance in distinguishing between classes by plotting the true positive rate against the false positive rate at various threshold settings. The ROC curve helps assess the model’s diagnostic accuracy.
Figure 18
Figure 18
Evaluation of the ResNet50 model results using the ROC curve. This figure displays the ROC curve for the ResNet50 model, illustrating the model’s performance in distinguishing between classes by plotting the true positive rate against the false positive rate at various threshold settings. The ROC curve helps assess the model’s diagnostic accuracy.
Figure 19
Figure 19
Training and validation accuracy and loss for the VGG19 model. This figure presents the training and validation accuracy, as well as the loss metrics, over multiple epochs during the training of the VGG19 model. It highlights the model’s learning progress and performance, showing how well the model generalizes to unseen data and identifying potential overfitting.
Figure 20
Figure 20
Results of sentiment analysis. This figure illustrates the outcomes of a sentiment analysis performed on a dataset, showcasing the distribution of positive, negative, and neutral sentiments. It highlights the model’s ability to classify text data based on emotional tone, providing insights into the overall sentiment trends within the dataset.
Figure 21
Figure 21
LIME: This figure illustrates the use of LIME to explain the predictions of a machine learning model. By highlighting the most influential features, LIME provides insights into how the model makes decisions, thereby enhancing interpretability and trust in the model’s outputs.

Similar articles

Cited by

References

    1. Rajpurkar P., Irvin G., Ball R.L., Zhu K., Yang B., Mehta D., Lungren M.P., Ng A. Artificial intelligence for chest X-ray image analysis: A review. Lancet Digital Health. 2021;3:e67–e78.
    1. World Health Organization . Global Tuberculosis Report 2020. WHO; Geneva, Switzerland: 2020.
    1. Rajpurkar A., Irvin J., Zhu K., Yang B., Xu M., Wang H., Ng A.Y. Chexnet: Radiologist-level pneumonia detection on chest X-rays with deep learning. Nat. Med. 2017;23:1216–1222. doi: 10.48550/arXiv.1711.05225. - DOI
    1. Armato S.G., III, Giger M.L.., Macmahon H., Metz C.E., Nishikawa R.M., Doi K. Chest X-ray interpretation using deep learning: Challenges and opportunities. Radiology. 2019;290:105–115. doi: 10.1007/s40134-019-0333-9. - DOI
    1. Geron A. Hands-On Machine Learning with Scikit-Learn, Keras, and TensorFlow. 2nd ed. O’Reilly Media. 2019. [(accessed on 31 July 2024)]. Available online: https://www.oreilly.com/library/view/hands-on-machine-learning/978149203....

LinkOut - more resources