

Support for the Time-Varying Drift Rate Model of Perceptual Discrimination in Dynamic and Static Noise Using Bayesian Model-Fitting Methodology
- PMID: 39202112
- PMCID: PMC11354202
- DOI: 10.3390/e26080642
Support for the Time-Varying Drift Rate Model of Perceptual Discrimination in Dynamic and Static Noise Using Bayesian Model-Fitting Methodology
Abstract
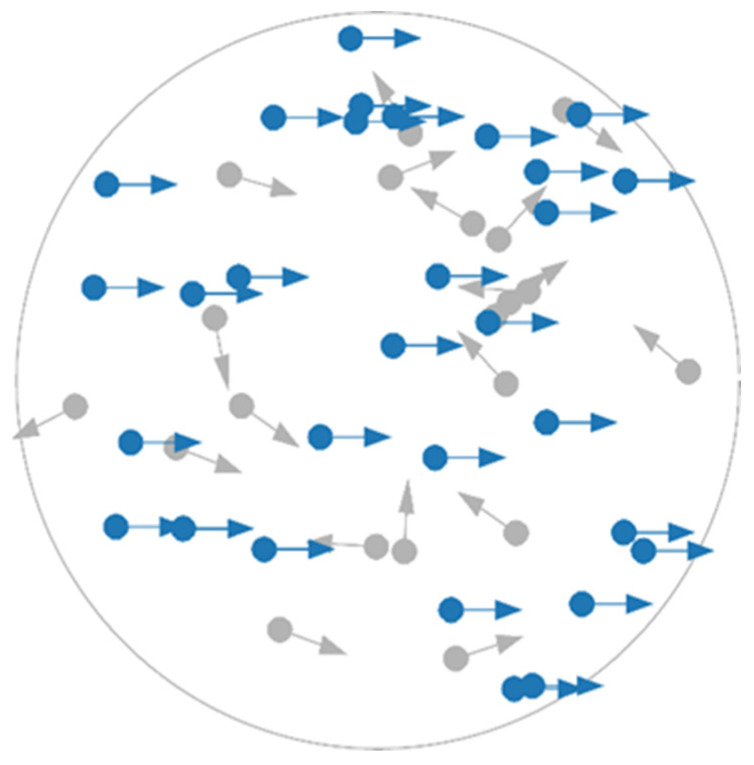
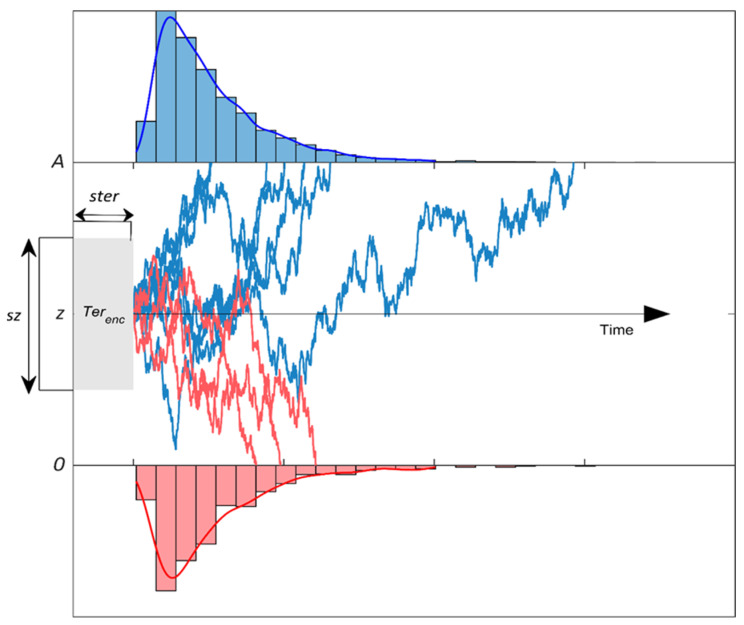
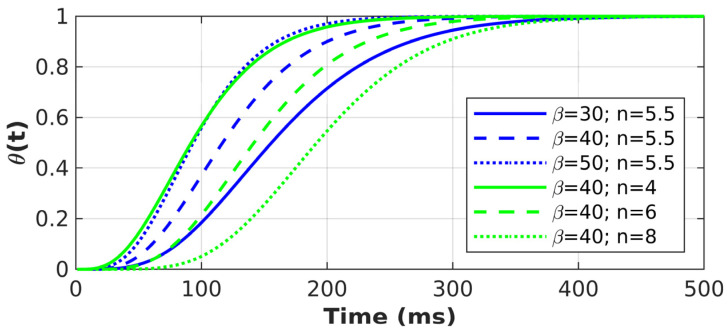
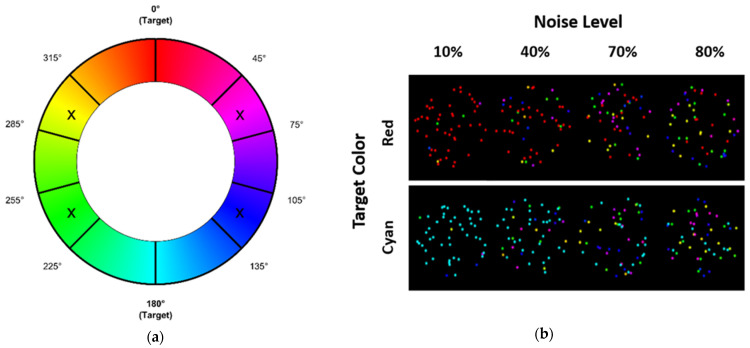
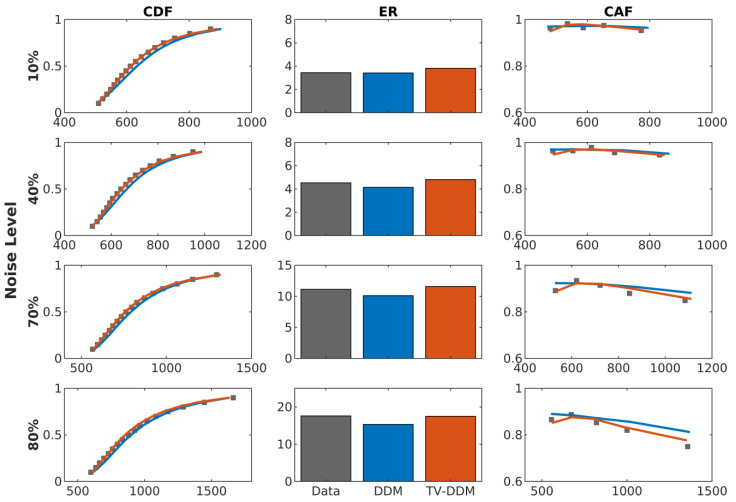
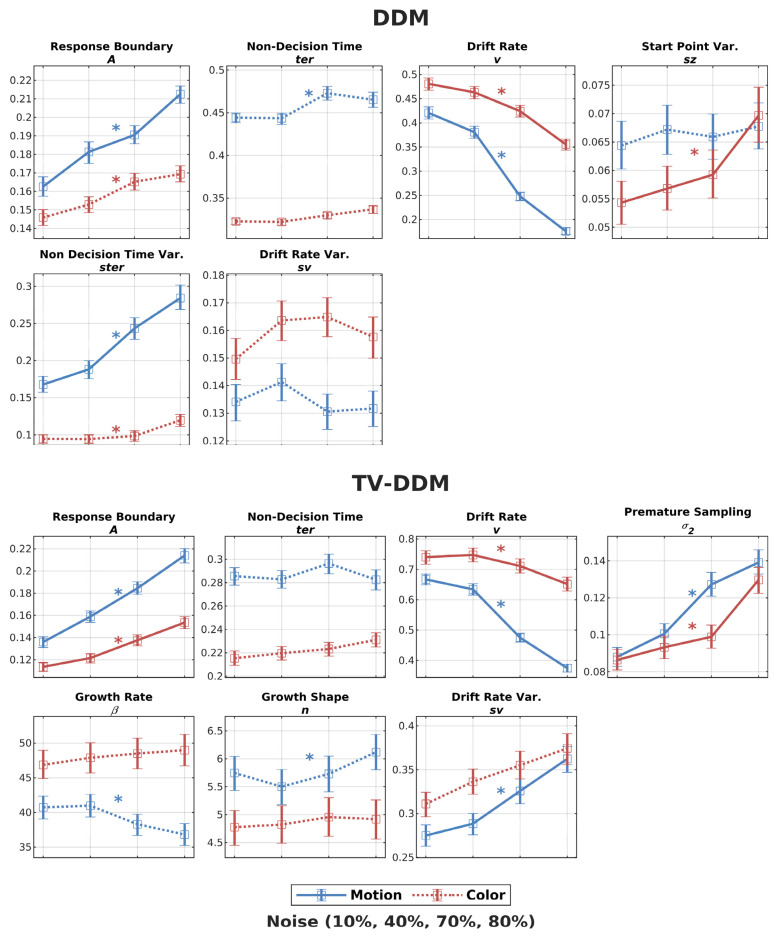
The drift-diffusion model (DDM) is a common approach to understanding human decision making. It considers decision making as accumulation of evidence about visual stimuli until sufficient evidence is reached to make a decision (decision boundary). Recently, Smith and colleagues proposed an extension of DDM, the time-varying DDM (TV-DDM). Here, the standard simplification that evidence accumulation operates on a fully formed representation of perceptual information is replaced with a perceptual integration stage modulating evidence accumulation. They suggested that this model particularly captures decision making regarding stimuli with dynamic noise. We tested this new model in two studies by using Bayesian parameter estimation and model comparison with marginal likelihoods. The first study replicated Smith and colleagues' findings by utilizing the classical random-dot kinomatogram (RDK) task, which requires judging the motion direction of randomly moving dots (motion discrimination task). In the second study, we used a novel type of stimulus designed to be like RDKs but with randomized hue of stationary dots (color discrimination task). This study also found TV-DDM to be superior, suggesting that perceptual integration is also relevant for static noise possibly where integration over space is required. We also found support for within-trial changes in decision boundaries ("collapsing boundaries"). Interestingly, and in contrast to most studies, the boundaries increased with increasing task difficulty (amount of noise). Future studies will need to test this finding in a formal model.
Keywords: Bayesian cognitive modelling; perceptual decision making; perceptual integration; selective influence.
Conflict of interest statement
The authors declare no conflict of interest.
Figures


Similar articles
-
A Bayesian Reformulation of the Extended Drift-Diffusion Model in Perceptual Decision Making.Front Comput Neurosci. 2017 May 11;11:29. doi: 10.3389/fncom.2017.00029. eCollection 2017. Front Comput Neurosci. 2017. PMID: 28553219 Free PMC article.
-
An Overcomplete Approach to Fitting Drift-Diffusion Decision Models to Trial-By-Trial Data.Front Artif Intell. 2021 Apr 9;4:531316. doi: 10.3389/frai.2021.531316. eCollection 2021. Front Artif Intell. 2021. PMID: 33898982 Free PMC article.
-
Different effects of dopaminergic medication on perceptual decision-making in Parkinson's disease as a function of task difficulty and speed-accuracy instructions.Neuropsychologia. 2015 Aug;75:577-87. doi: 10.1016/j.neuropsychologia.2015.07.012. Epub 2015 Jul 13. Neuropsychologia. 2015. PMID: 26184442
-
Dynamic Decision Making: Learning Processes and New Research Directions.Hum Factors. 2017 Aug;59(5):713-721. doi: 10.1177/0018720817710347. Epub 2017 May 26. Hum Factors. 2017. PMID: 28548893 Review.
-
Vision for the blind: visual psychophysics and blinded inference for decision models.Psychon Bull Rev. 2020 Oct;27(5):882-910. doi: 10.3758/s13423-020-01742-7. Psychon Bull Rev. 2020. PMID: 32514800 Free PMC article. Review.
References
Grants and funding
LinkOut - more resources
Full Text Sources
