

A Penalized Regression Method for Genomic Prediction Reduces Mismatch between Training and Testing Sets
- PMID: 39202329
- PMCID: PMC11353568
- DOI: 10.3390/genes15080969
A Penalized Regression Method for Genomic Prediction Reduces Mismatch between Training and Testing Sets
Abstract
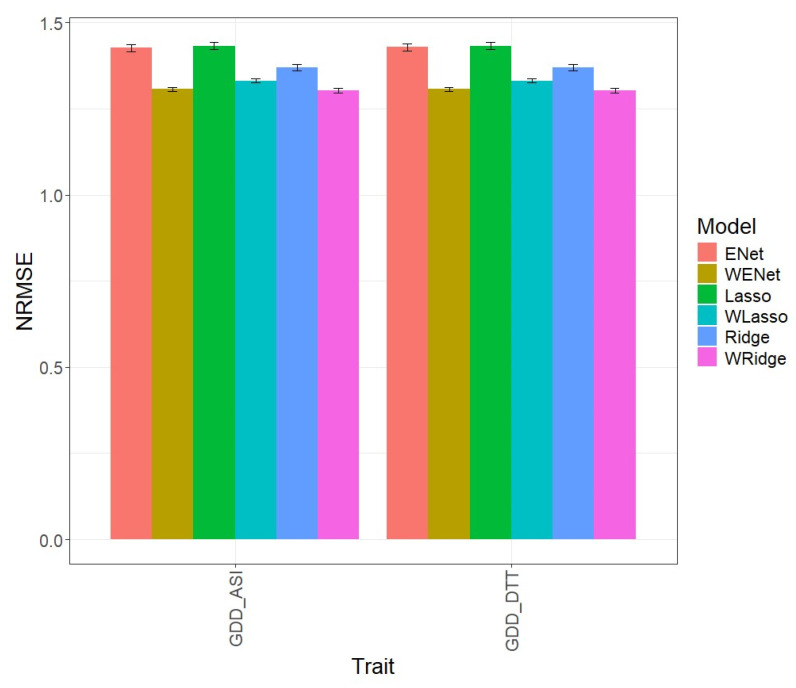
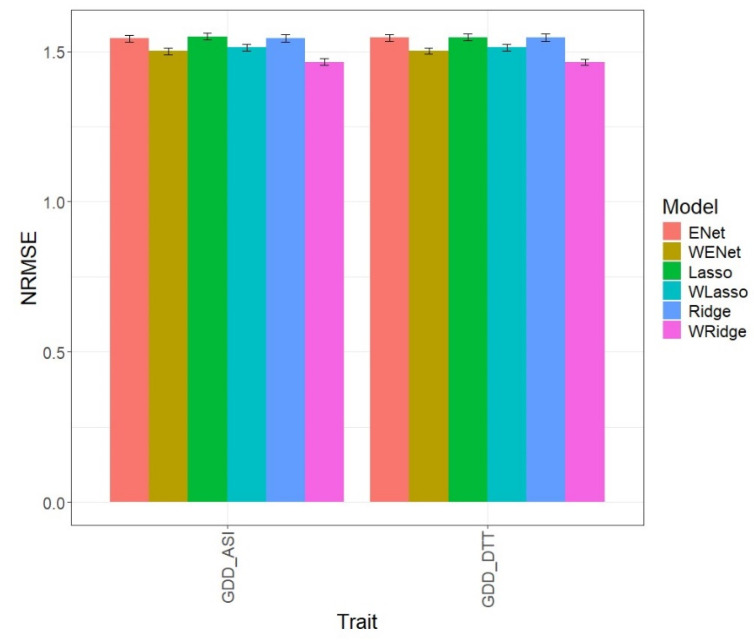
Genomic selection (GS) is changing plant breeding by significantly reducing the resources needed for phenotyping. However, its accuracy can be compromised by mismatches between training and testing sets, which impact efficiency when the predictive model does not adequately reflect the genetic and environmental conditions of the target population. To address this challenge, this study introduces a straightforward method using binary-Lasso regression to estimate β coefficients. In this approach, the response variable assigns 1 to testing set inputs and 0 to training set inputs. Subsequently, Lasso, Ridge, and Elastic Net regression models use the inverse of these β coefficients (in absolute values) as weights during training (WLasso, WRidge, and WElastic Net). This weighting method gives less importance to features that discriminate more between training and testing sets. The effectiveness of this method is evaluated across six datasets, demonstrating consistent improvements in terms of the normalized root mean square error. Importantly, the model's implementation is facilitated using the glmnet library, which supports straightforward integration for weighting β coefficients.
Keywords: Elastic Net regression; Lasso regression; Ridge regression; genomic selection; mismatch; weighted regression.
Conflict of interest statement
The authors declare no conflicts of interest.
Figures


References
-
- Montesinos López O.A., Montesinos-López A., Crossa J. Multivariate Statistical Machine Learning Methods for Genomic Prediction. Springer; Cham, Switzerland: 2022. Multivariate statistical machine learning methods for genomic prediction. - PubMed
-
- Heffner E.L., Sorrells M.E., Jannink J.L. Genomic selection for crop improvement. Crop Sci. 2009;49:1–12. doi: 10.2135/cropsci2008.08.0512. - DOI
-
- Crossa J., Beyene Y., Kassa S., Pérez P., Hickey J.M., Chen C., de los Campos G., Burgueño J., Windhausen V.S., Buckler E., et al. Genomic prediction in maize breeding populations with genotyping-by-sequencing. G3 Genes Genomes Genet. 2013;3:1903–1926. doi: 10.1534/g3.113.008227. - DOI - PMC - PubMed
-
- Spindel J., Begum H., Akdemir D., Virk P., Collard B., Redoña E., Atlin G., Jannink J.-L., McCouch S.R. Genomic selection and association mapping in rice (Oryza sativa): Effect of trait genetic architecture, training population composition, marker number and statistical model on accuracy of rice genomic selection in elite, tropical rice breeding lines. PLoS Genet. 2015;11:e1004982. - PMC - PubMed
MeSH terms
Grants and funding
LinkOut - more resources
Full Text Sources
