Genome-Wide Identification and Characterization of Maize Long-Chain Acyl-CoA Synthetases and Their Expression Profiles in Different Tissues and in Response to Multiple Abiotic Stresses
- PMID: 39202344
- PMCID: PMC11354158
- DOI: 10.3390/genes15080983
Genome-Wide Identification and Characterization of Maize Long-Chain Acyl-CoA Synthetases and Their Expression Profiles in Different Tissues and in Response to Multiple Abiotic Stresses
Abstract
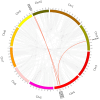
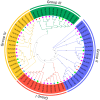
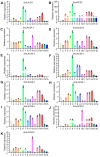
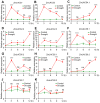
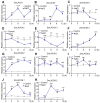
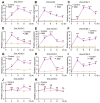
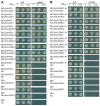
Long-chain acyl-CoA synthetases (LACSs) are essential enzymes that activate free fatty acids to fatty acyl-CoA thioesters, playing key roles in fatty acid (FA) catabolism, lipid synthesis and storage, epidermal wax synthesis, and stress tolerance. Despite their importance, comprehensive information about LACS genes in maize, a primary food crop, remains scarce. In the present work, eleven maize LACS genes were identified and mapped across five chromosomes. Three pairs of segmentally duplicated genes were detected in the maize LACS gene family, which underwent significant purifying selection (Ka/Ks < 1). Subsequently, phylogenetic analysis indicated that ZmLACS genes were divided into four subclasses, as supported by highly conserved motifs and gene structures. On the basis of the PlantCARE database, analysis of the ZmLACS promoter regions revealed various cis-regulatory elements related to tissue-specific expression, hormonal regulation, and abiotic stress response. RT-qPCR analysis showed that ZmLACS genes exhibit tissue-specific expression patterns and respond to diverse abiotic stresses including drought and salt, as well as phytohormone abscisic acid. Furthermore, using the STRING database, several proteins involved in fatty acid and complex lipid synthesis were identified to be the potential interaction partners of ZmLACS proteins, which was also confirmed by the yeast two-hybrid (Y2H) assay, enhancing our understanding of wax biosynthesis and regulatory mechanisms in response to abiotic stresses in maize. These findings provide a comprehensive understanding of ZmLACS genes and offer a theoretical foundation for future research on the biological functions of LACS genes in maize environmental adaptability.
Keywords: expression profiles; genome-wide investigation; long-chain acyl-CoA synthetase; maize (Zea mays L.).
Conflict of interest statement
The authors declare no conflicts of interest.
Figures




Similar articles
-
Genome-wide identification and characterization of apple long-chain Acyl-CoA synthetases and expression analysis under different stresses.Plant Physiol Biochem. 2018 Nov;132:320-332. doi: 10.1016/j.plaphy.2018.09.004. Epub 2018 Sep 15. Plant Physiol Biochem. 2018. PMID: 30248518
-
CCCH-type zinc finger family in maize: genome-wide identification, classification and expression profiling under abscisic acid and drought treatments.PLoS One. 2012;7(7):e40120. doi: 10.1371/journal.pone.0040120. Epub 2012 Jul 6. PLoS One. 2012. PMID: 22792223 Free PMC article.
-
Genome-wide identification and expression profiling analysis of maize AP2/ERF superfamily genes reveal essential roles in abiotic stress tolerance.BMC Genomics. 2022 Feb 12;23(1):125. doi: 10.1186/s12864-022-08345-7. BMC Genomics. 2022. PMID: 35151253 Free PMC article.
-
Genome-wide identification and analysis of ACP gene family in Sorghum bicolor (L.) Moench.BMC Genomics. 2022 Jul 25;23(1):538. doi: 10.1186/s12864-022-08776-2. BMC Genomics. 2022. PMID: 35879672 Free PMC article. Review.
-
Transcription factors as molecular switches to regulate drought adaptation in maize.Theor Appl Genet. 2020 May;133(5):1455-1465. doi: 10.1007/s00122-019-03494-y. Epub 2019 Dec 5. Theor Appl Genet. 2020. PMID: 31807836 Review.
Cited by
-
Genome-wide characterization of the Eceriferum (CER) gene family in barley (Hordeum vulgare L.).Sci Rep. 2025 Jul 1;15(1):20674. doi: 10.1038/s41598-025-07145-9. Sci Rep. 2025. PMID: 40594669 Free PMC article.
-
Identification and functional analysis of AvLACS genes unveils their role in lipid homeostasis and waterlogging tolerance in kiwifruit (Actinidia valvata Dunn).Front Plant Sci. 2025 Jun 30;16:1580003. doi: 10.3389/fpls.2025.1580003. eCollection 2025. Front Plant Sci. 2025. PMID: 40661760 Free PMC article.
References
MeSH terms
Substances
Grants and funding
- 2023LZGC010/Seed-Industrialized Development Program in Shandong Province
- SDAIT-29-04/Shandong Province Saline Alkali Land Agricultural Technology System
- ZR2023MC012/Natural Science Foundation of Shandong Province, China
- 2022YFD1201700/National Key R&D Program of China
- 2022CXGC010607/Key Technology Research and Development Program of Shandong
LinkOut - more resources
Full Text Sources
Miscellaneous

