. 2024 Aug 1;15(8):1010.
doi: 10.3390/genes15081010.

Changes in the Transcriptome and Long Non-Coding RNAs but Not the Methylome Occur in Human Cells Exposed to Borrelia burgdorferi

Affiliations

Changes in the Transcriptome and Long Non-Coding RNAs but Not the Methylome Occur in Human Cells Exposed to Borrelia burgdorferi

Anne Berthold et al. Genes (Basel). .

Abstract

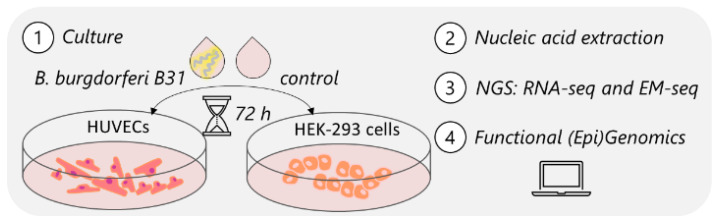
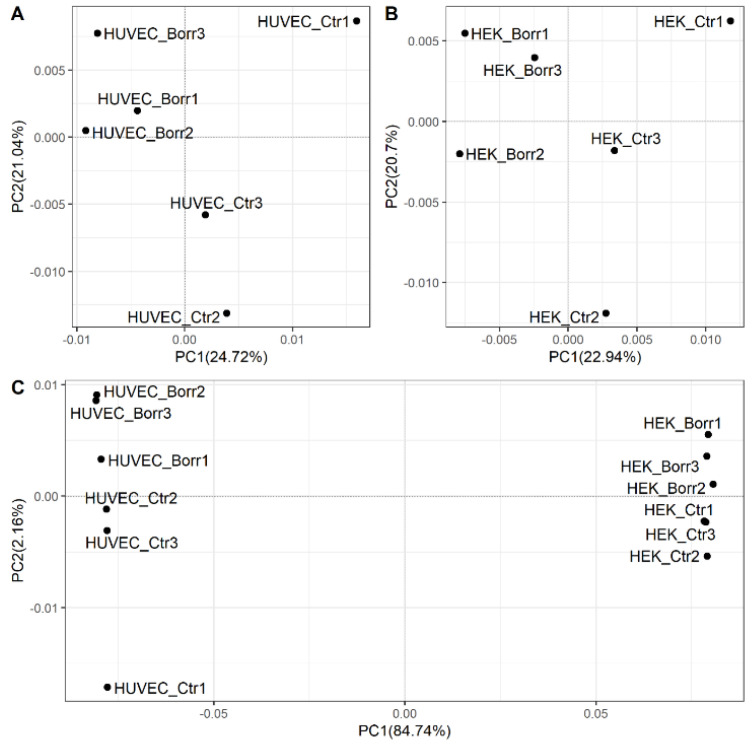
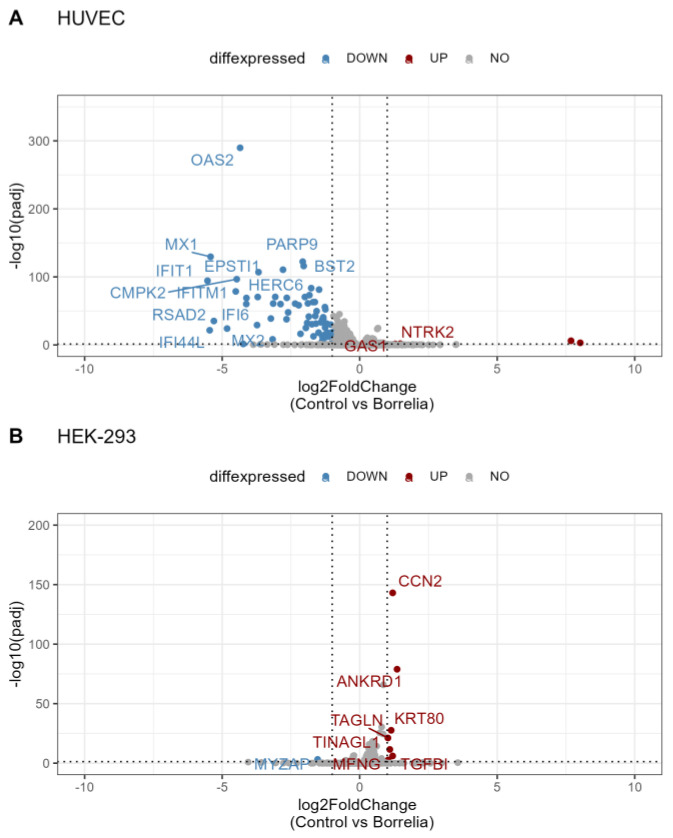
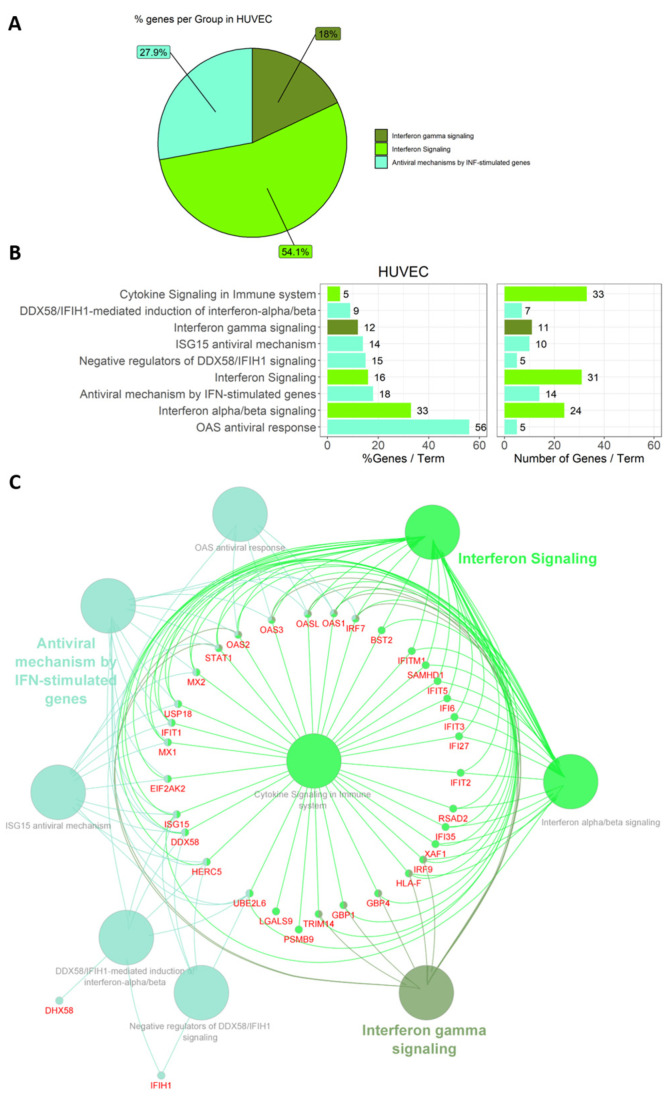
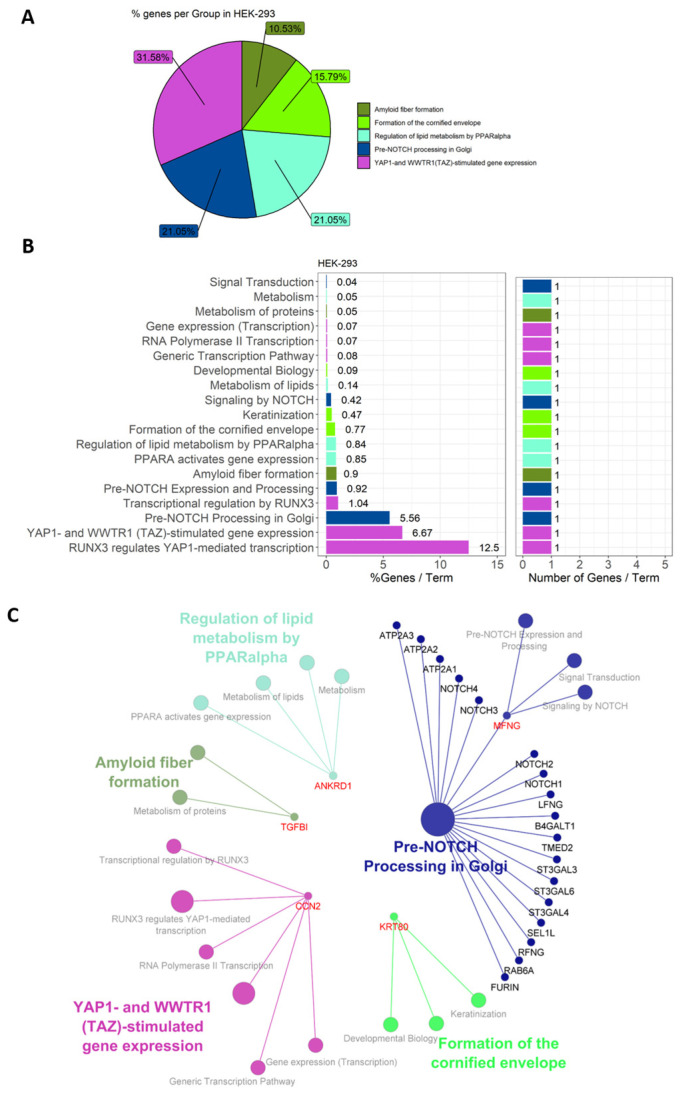
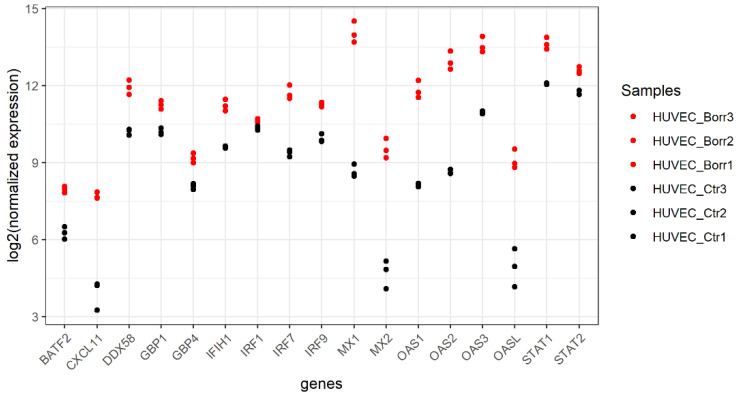
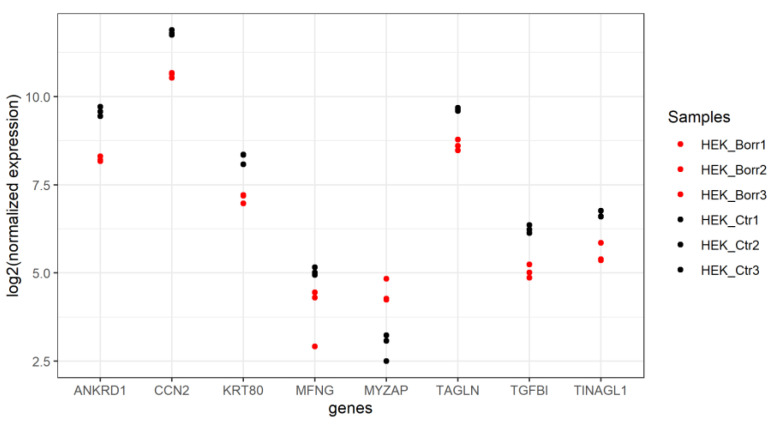
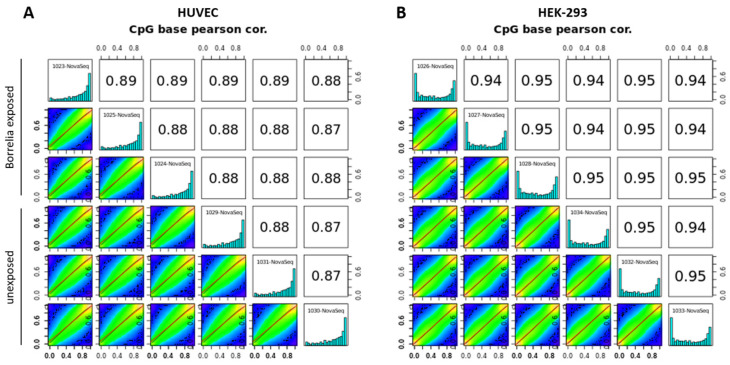
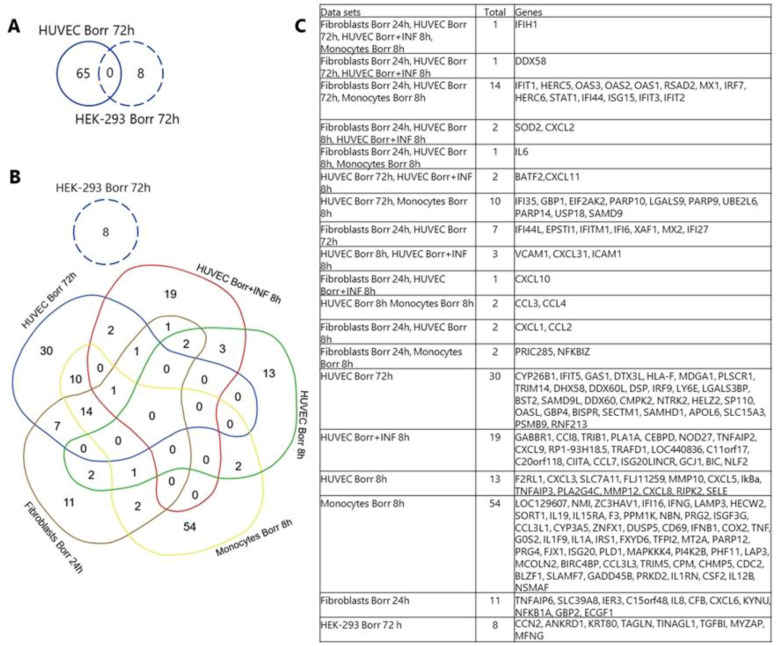
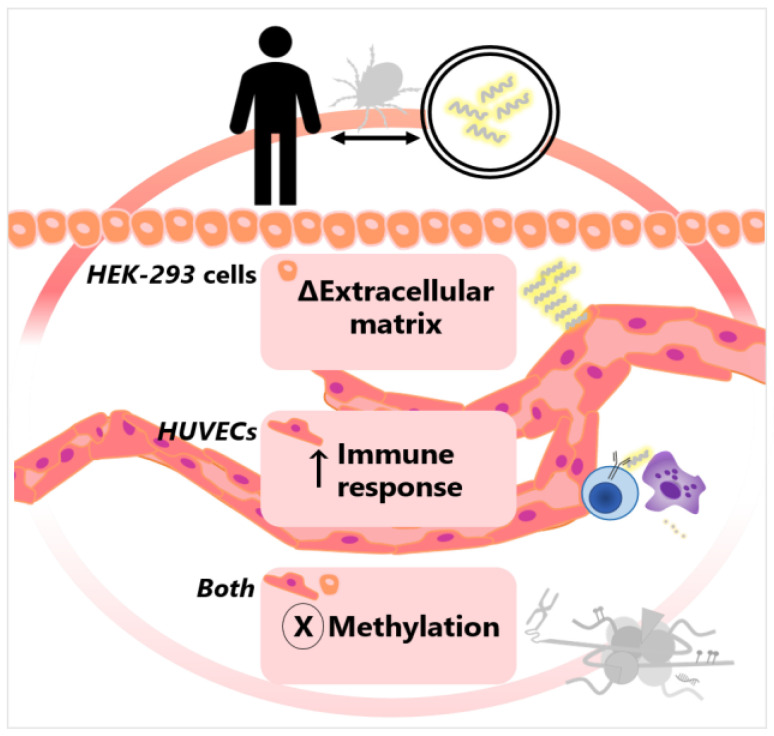
Lyme disease, caused by infection with members of the Lyme borreliosis group of Borrelia spirochete bacteria, is increasing in frequency and distribution worldwide. Epigenetic interactions between the mammalian host, tick, and bacterial pathogen are poorly understood. In this study, high-throughput next-generation sequencing (NGS) allowed for the in vitro study of the transcriptome, non-coding RNAs, and methylome in human host cells in response to Borrelia burgdorferi infection. We tested the effect of the Borrelia burgdorferi strain B31 on a human primary cell line (HUVEC) and an immortalized cell line (HEK-293) for 72 h, a long-duration time that might allow for epigenetic responses in the exposed human host cells. Differential gene expression was detected in both cell models in response to B. burgdorferi. More differentially expressed genes were found in HUVECs compared to HEK-293 cells. Borrelia burgdorferi exposure significantly induced genes in the interferon, in addition to cytokine and other immune response signaling in HUVECs. In HEK-293 cells, pre-NOTCH processing in Golgi was significantly downregulated in Borrelia-exposed cells. Other significantly altered gene expressions were found in genes involved in the extracellular matrix. No significant global methylation changes were detected in HUVECs or HEK-293 cells exposed to B. burgdorferi; however, two long non-coding RNAs and a pseudogene were deregulated in response to B. burgdorferi in HUVECs, suggesting that other epigenetic mechanisms may be initiated by infection.

Keywords: Borrelia burgdorferi; HEK-293 cells; HUVECs; Lyme disease; epigenetics; lncRNAs; transcriptome.


Conflict of interest statement

The authors declare no conflicts of interest. The funders had no role in the design of the study; in the collection, analyses, or interpretation of data; in the writing of the manuscript; or in the decision to publish the results.

Figures

Figure 1
Figure 1
Experimental workflow for human cell models exposed to B. burgdorferi B31. HUVECs and HEK-293 cells were exposed to B. burgdorferi B31 for 72 h. RNA and DNA were extracted and subjected to library preparation for next-generation sequencing (RNA-seq and enzymatic methyl-seq). Genome-wide epigenomic and transcriptomic data were used for functional enrichment analysis.
Figure 2
Figure 2
PCA of transcriptome data. Human HUVEC and HEK-293 human cell models remained unexposed (control; Ctr) or were exposed to B. burgdorferi strain B31 for 72 h (Borr). Experiments were performed in triplicate, as indicated by the sample names. Unexposed (Ctr) and B. burgdorferi-exposed (Borr) cells (A: HUVECs; B: HEK-293 cells) clustered separately along the x-axis with PC 1, explaining the variation between exposure conditions, while PC2 explained the clustering between replicates in each condition. The positive correlated samples are closer together and are located on the same side of the plot. Comparing HUVECs and HEK-293 cells (C), the replicates clustered separately along the x-axis, with PC1 explaining 84.74% of the variation between the cell types. PC2 explained 2.16% of sample correlation clustering. The positively correlated clusters under the HEK-293 cell condition are less extended than the HUVEC clusters.
Figure 3
Figure 3
Volcano plot of differential gene expression. Comparison of expression data from HUVECs (A) and HEK-293 cells (B) unexposed or exposed to B. burgdorferi strain B31 for 72 h. log2FC is plotted on the x-axis, representing the level of change between the two exposure conditions, against statistical significance in terms of padj on the y-axis. The horizontal line marks padj = 0.05, whereas the vertical lines represent the cut-off of log2FC at -1 and 1. The blue dots represent the genes expressed at a significantly lower level in control cells and upregulated in Borrelia-exposed cells, while the red dots represent the genes expressed at significantly higher levels in the control cells and downregulated in the Borrelia-exposed cells. The many genes highlighted in gray are outside the cut-offs. HUVECs have considerably more differentially expressed (DE) genes, most of which are expressed at lower levels in control cells and upregulated in response to Borrelia exposure. In contrast, in HEK-293 cells, there are more DE genes expressed at higher rather than lower levels in control cells and downregulated in response to Borrelia.
Figure 4
Figure 4
Functional annotation of DE genes in HUVECs. DE genes in HUVECs were assigned to three groups, as depicted in the pie chart (A) in three shades of green. Genes were assigned to nine pathway terms, with % genes/term and the number of genes/term mapped separately (B). The generated network (C) shows the groups (colored), pathway terms (grey), and shared genes (red) according to the functional analysis.
Figure 5
Figure 5
Functional annotation of DE genes in HEK-293 cells. All potential representative pathways are depicted, while only “Pre-NOTCH Processing in Golgi” is significant. DE genes in HEK-293 cells were assigned to five groups, as depicted in the pie chart (A). Genes were assigned to 19 pathway terms, with % genes/term and the number of genes/term mapped separately (B). The generated network (C) shows the groups (color coded), pathway terms (grey), and contributing genes (red) according to the functional analysis.
Figure 6
Figure 6
Expression of selected DE genes in HUVECs unexposed or exposed to B. burgdorferi strain B31. Basic leucine zipper transcription factor (BATF2), C-X-C Motif Chemokine Ligand 11(CXCL11), retinoic acid-inducible gene-I (RIG-I)-receptor (DDX58), guanylate-binding proteins (GBP), RIG-I-like receptor (IFIH1), interferon regulatory factors (IRFs), MX proteins that are dynamin-like GTPases, members of the 2′-5′-oligoadenylate synthetase (OAS) protein family, and two Signal Transducer and Activator of Transcription (STAT) factors from the data set are highlighted here. These genes, some of which were also the main players in the functional enrichment analysis used to explain the induced immune response, are clearly shown to be induced in their expression by B. burgdorferi exposure. Genes are plotted against log2 (normalized expression) per replicate (1–3) of the different cell treatments. Red dots represent B. burgdorferi-exposed cells (Borr), and black dots represent uninfected HUVECs (Ctr).
Figure 7
Figure 7
Expression of DE genes in HEK-293 cells unexposed or exposed to B. burgdorferi strain B31. Most DE genes in HEK-293 cells are downregulated upon B. burgdorferi-exposure. The 8 DE genes code for the following proteins: Ankyrin Repeat Domain 1 (ANKRD1), Cellular Communication Network Factor 2 (CCN2), Keratin 80 (KRT80), O-Fucosylpeptide 3-Beta-N-Acetylglucosaminyltransferase or manic fringe (MFNG), Myocardial Zonula Adherens Protein (MYZAP), Transgelin (TAGLN), Transforming Growth Factor Beta 1 (TGFB1), and Tubulointerstitial Nephritis Antigen-Like 1 (TINAGL1).
Figure 8
Figure 8
Correlation of methylation across samples. Histograms displaying percentage of methylation per cytosine base for unexposed and B. burgdorferi-exposed replicates are shown diagonally for each cell model. Numbers in the top-right panels indicate Pearson correlation values of the pairwise comparison. The panels in the lower left are scatter plots of percentage of methylation for each sample pairing. The settings for sample comparison of unexposed and B. burgdorferi-exposed cells in the figures shown here were 20% methylation difference, minimum CpG coverage of 10×, and a q-value 0.05 for both HUVECs (A) and HEK-293 cells (B).
Figure 9
Figure 9
Comparative analysis of gene expression induced by B. burgdorferi in different cell types. (A) Differentially expressed (DE) genes identified in this study for HUVECs and HEK-293 cells exposed to B. burgdorferi for 72 h were compared and showed no overlap in a Venn diagram. (B) The data sets are color-coded. Dame et al. (2007) examined the effects of B. burgdorferi with an MOI of 10:1 (green) and B. burgdorferi (MOI 10:1) in combination with interferon gamma (IFN-γ) (red) on HUVECs after 8 h exposure by microarray. Salazar et al. (2009) exposed monocytes to lysed and live B. burgdorferi for 8 h at various MOIs (1:1,10:1,100:1). Genes exclusively or more intensely upregulated by live B. burgdorferi (yellow) were included in the present comparative study. Meddeb et al. (2016) used fibroblasts which exposed to B. burgdorferi and two other pathogenic Borrelia strains at an MOI 100:1 for 24 h (brown) and subjected to microarray analysis. Consistent DE genes in response to the three pathogenic were considered for this comparative study. The data sets in blue represent the gene set of the present study, where HUVECs (solid blue line) or HEK-293 cells (dashed blue line) were exposed to B. burgdorferi for 72 h at an MOI of 50:1. Our HUVEC data set (solid blue) shows no overlap with HUVECs exposed to B. burgdorferi for 8 h (green). HUVECs showed some gene overlap with the others studies, while no shared DE genes were found between HEK-293 cells and the other data sets. The table (C) provides the gene names.
Figure 10
Figure 10
Summary of findings in human cells exposed to Borrelia burgdorferi.

Similar articles

References

    1. Rudenko N., Golovchenko M., Grubhoffer L., Oliver J.H. Updates on Borrelia burgdorferi sensu lato complex with respect to public health. Ticks Tick-Borne Dis. 2011;2:123–128. doi: 10.1016/j.ttbdis.2011.04.002. - DOI - PMC - PubMed
    1. De la Fuente J., Antunes S., Bonnet S., Cabezas-Cruz A., Domingos A.G., Estrada-Peña A., Johnson N., Kocan K.M., Mansfield K.L., Nijhof A.M., et al. Tick-Pathogen Interactions and Vector Competence: Identification of Molecular Drivers for Tick-Borne Diseases. Front. Cell. Infect. Microbiol. 2017;7:1–13. doi: 10.3389/fcimb.2017.00114. - DOI - PMC - PubMed
    1. Centers for Disease Control and Prevention Lyme Disease Charts and Figures: Historical Data. [(accessed on 18 May 2021)]; Available online: https://www.cdc.gov/lyme/stats/graphs.html.
    1. Public Health Agency of Canada Surveillance of Lyme Disease. [(accessed on 18 May 2021)]. Available online: https://www.canada.ca/en/public-health/services/diseases/lyme-disease/su....
    1. Smith R., Takkinen J. Lyme borreliosis: Europe-wide coordinated surveillance and action needed? Euro Surveill. Bull. Eur. Sur Mal. Transm. Eur. Commun. Dis. Bull. 2006;11:2977. doi: 10.2807/esw.11.25.02977-en. - DOI - PubMed

MeSH terms

Substances