. 2024 Aug 1;15(8):1013.
doi: 10.3390/genes15081013.

Interspecific and Intraspecific Transcriptomic Variations Unveil the Potential High-Altitude Adaptation Mechanisms of the Parnassius Butterfly Species

Affiliations

Interspecific and Intraspecific Transcriptomic Variations Unveil the Potential High-Altitude Adaptation Mechanisms of the Parnassius Butterfly Species

Chen Ding et al. Genes (Basel). .

Abstract

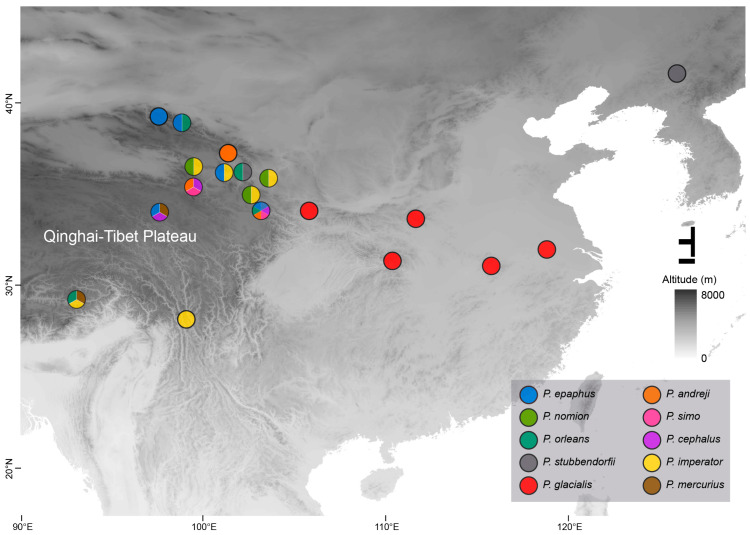
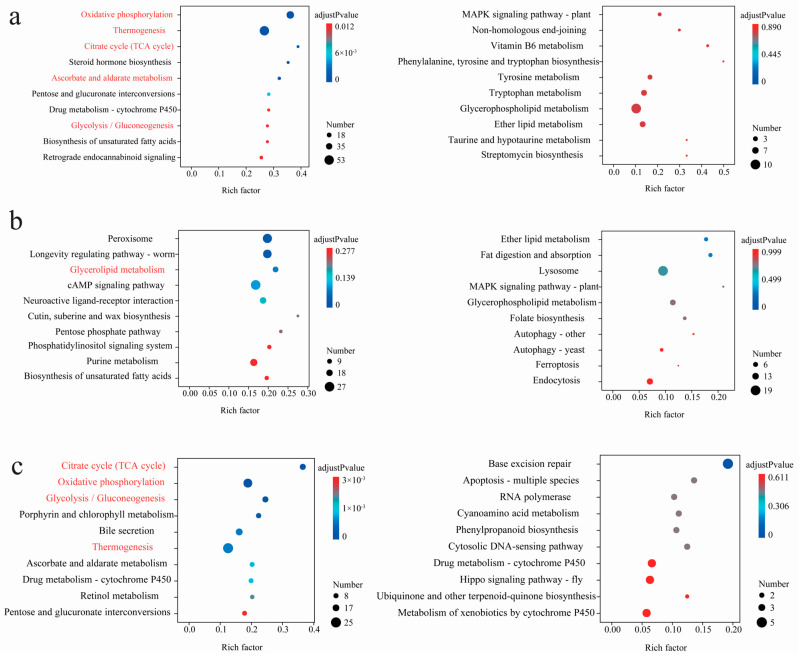
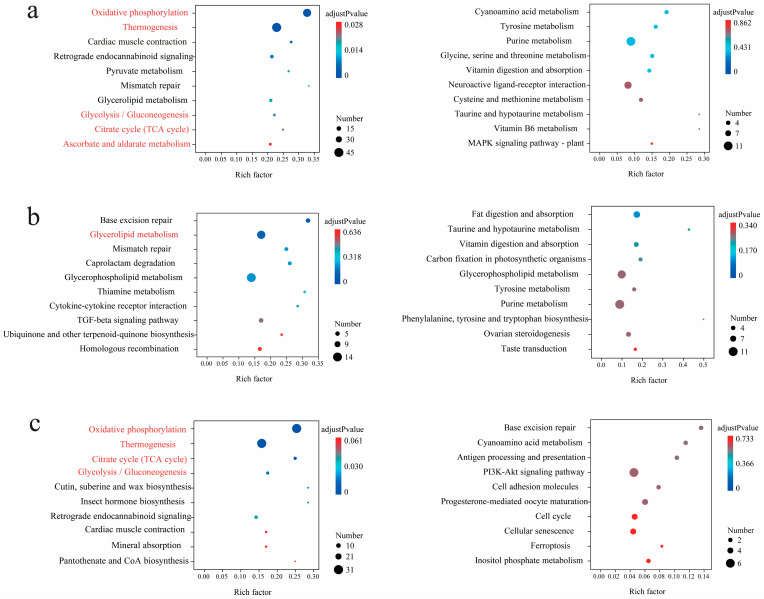
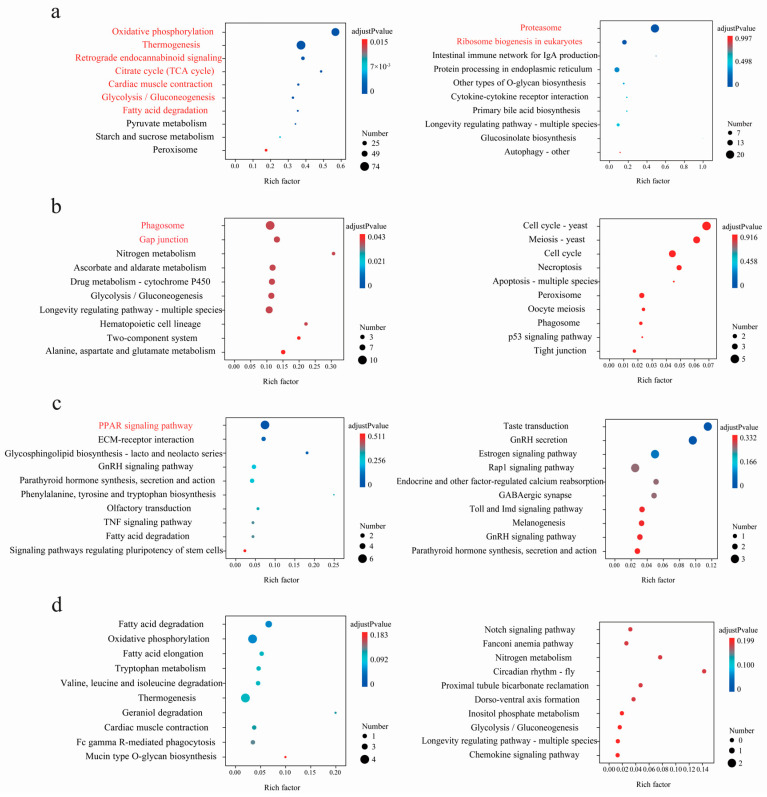
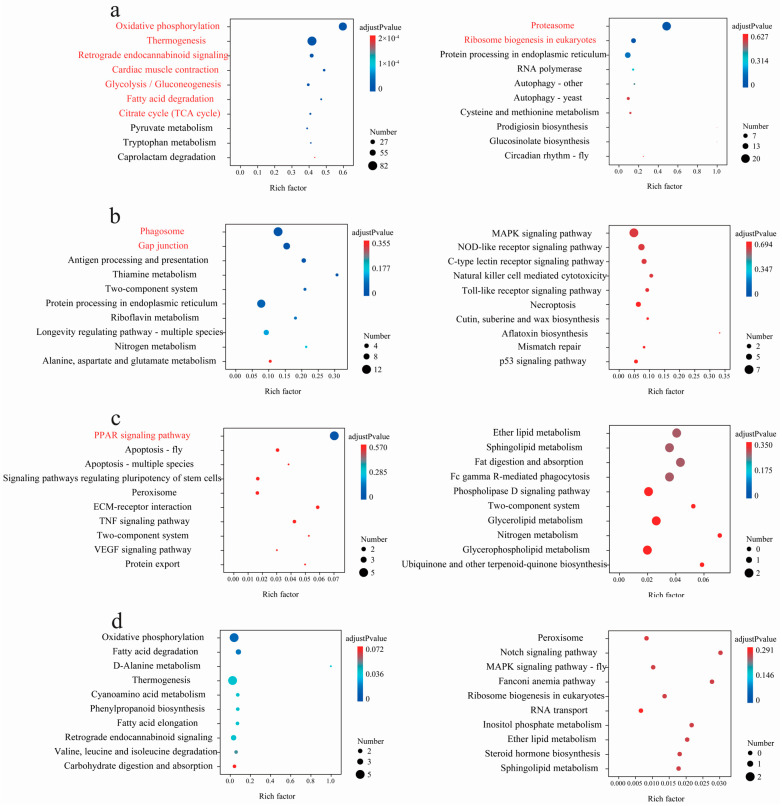
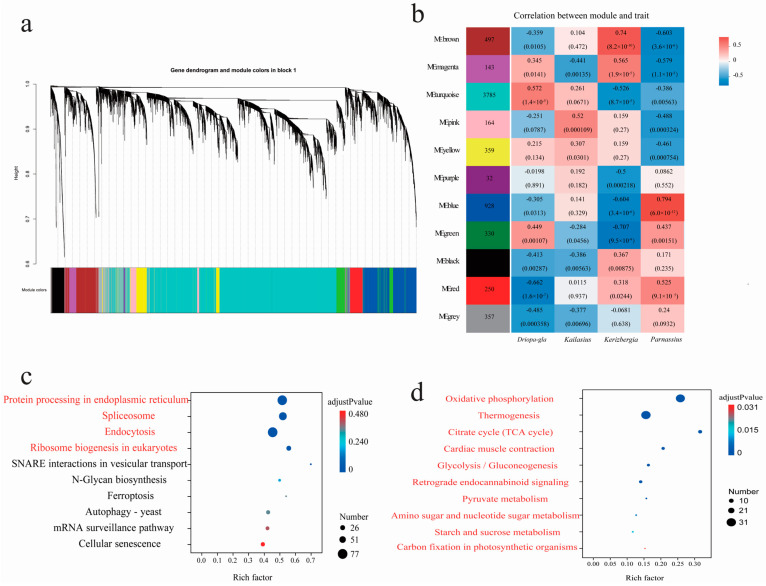
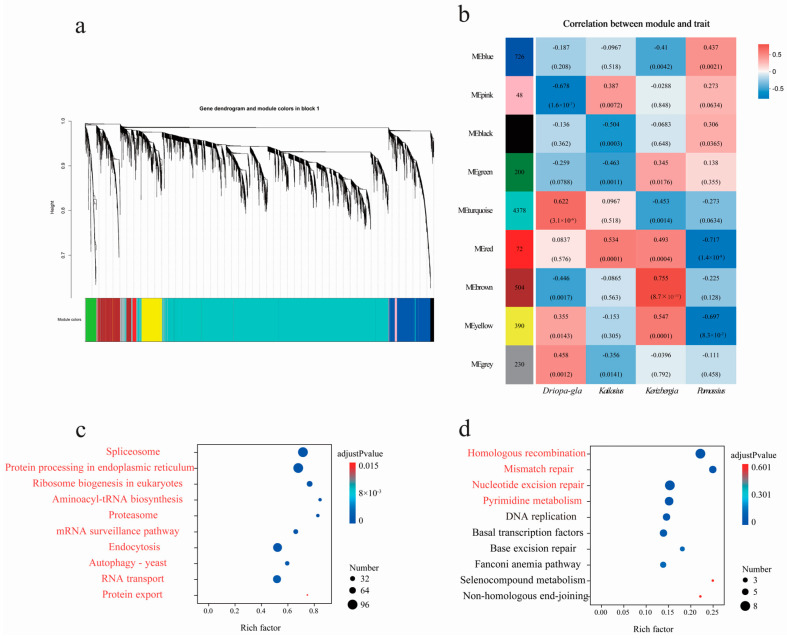
Parnassius butterflies have significantly advanced our understanding of biogeography, insect-plant interactions, and other fields of ecology and evolutionary biology. However, to date, little is known about the gene expression patterns related to the high-altitude adaptation of Parnassius species. In this study, we obtained high-throughput RNA-seq data of 48 adult Parnassius individuals covering 10 species from 12 localities in China, and deciphered their interspecific and intraspecific expression patterns based on comparative transcriptomic analyses. Though divergent transcriptional patterns among species and populations at different altitudes were found, a series of pathways related to genetic information processing (i.e., recombination, repair, transcription, RNA processing, and ribosome biogenesis), energy metabolism (i.e., oxidative phosphorylation, thermogenesis, and the citrate cycle), and cellular homeostasis were commonly enriched, reflecting similar strategies to cope with the high-altitude environments by activating energy metabolism, enhancing immune defense, and concurrently inhibiting cell growth and development. These findings deepen our understanding about the molecular mechanisms of adaptative evolution to extreme environments, and provide us with some theoretical criteria for the biodiversity conservation of alpine insects.

Keywords: Parnassius butterflies; adaptative evolution; alpine environment; high-throughput sequencing; transcriptome.


Conflict of interest statement

The authors declare no conflicts of interest.

Figures

Figure 1
Figure 1
The sampling localities of the Parnassius samples in this study.
Figure 2
Figure 2
Multiple regression analysis based on altitude, geographic location, and host plant. (a) Modeling with Jaccard distance matrix; (b) modeling with Bray–Curtis distance matrix.
Figure 3
Figure 3
The number of differentially expressed genes for each pairwise comparison. Bar chart diagrams showing overlaps of DEGs with increased (red) or decreased (blue) transcript abundance in three pairs of comparisons. (a) P. glacialis was used as the reference genome; (b) P. cephalus was used as the reference genome.
Figure 4
Figure 4
(ac) KEGG enrichment results of the DEGs (P. glacialis was used as the reference genome: left, up-regulated; right, down-regulated) in pairwise comparisons of HA vs. LA, MA vs. LA, and HA vs. MA (the latter group used as the control, similarly hereinafter), respectively. For each comparison, only the top 10 pathways with the most significant enrichment are shown. The shared pathways that appear in the same pairwise comparison are highlighted in red, regardless of the reference genome (similarly hereinafter).
Figure 5
Figure 5
(ac) KEGG enrichment results of the DEGs (P. cephalus was used as the reference genome: left, up-regulated; right, down-regulated) in pairwise comparisons of HA vs. LA, MA vs. LA, and HA vs. MA, respectively. For each comparison, only the top 10 pathways with the most significant enrichment are shown.
Figure 6
Figure 6
KEGG enrichment results of the DEGs (P. glacialis is used as the reference genome: left, up-regulated; right, down-regulated) in pairwise comparisons of And_el vs. And_my (a), Sim_el vs. Sim_bc (b), Nom_ck vs. Nom_bm (c), and Epa_hs vs. Epa_gg (d), respectively. For each comparison, only the top 10 pathways with the most significant enrichment are shown.
Figure 7
Figure 7
KEGG enrichment results of the DEGs (P. cephalus is used as the reference genome: left, up-regulated; right, down-regulated) in pairwise comparisons of And_el vs. And_my (a), Sim_el vs. Sim_bc (b), Nom_ck vs. Nom_bm (c), and Epa_hs vs. Epa_gg (d), respectively. For each comparison, only the top 10 pathways with the most significant enrichment are shown.
Figure 8
Figure 8
(a) Hierarchical clustering tree (gene dendrogram) showing 11 modules of genes co-expressed by WGCNA using P. glacialis as the reference genome. The major tree branches constitute 11 modules, labeled with different colors. (b) Module–locality relationship (each row represents a module, each column represents a specific sampling locality, and the correlation coefficient between module and locality is represented by the value in each cell at the row–column intersection, with the p-value shown in parentheses. (c,d) KEGG enrichment analyses of the genes in the turquoise and red modules, respectively. For each module, only the top 10 pathways with the most significant enrichment are shown (Table S7).
Figure 9
Figure 9
(a) Hierarchical clustering tree (gene dendrogram) showing nine modules of genes co-expressed by WGCNA analyses using P. cephalus as the reference genome. The major tree branches constitute nine modules, labeled with different colors. (b) Module–locality relationship (each row represents a module, each column represents a specific sampling locality, and the correlation coefficient between module and locality is represented by the value in each cell at the row–column intersection, with the p-value shown in parentheses. (c,d) KEGG enrichment analyses of the genes in the turquoise and brown modules, respectively. For each module, only the top 10 pathways with the most significant enrichment are shown.
Figure 10
Figure 10
Validation expression patterns in P. glacialis and P. cephalus representative samples determined by qPCR. The left ordinate represents the qPCR-based expression levels, and the right ordinate represents the RNA-seq-based expression levels.

Similar articles

Cited by

References

    1. Su C., Ding C., Zhao Y., He B., Nie R., Hao J. Diapause-linked gene expression pattern and related candidate duplicated genes of the mountain butterfly Parnassius glacialis (Lepidoptera: Papilionidae) revealed by comprehensive transcriptome profiling. Int. J. Mol. Sci. 2023;24:5577. doi: 10.3390/ijms24065577. - DOI - PMC - PubMed
    1. Ding D., Liu G., Hou L., Gui W., Chen B., Kang L. Genetic variation in PTPN1 contributes to metabolic adaptation to high-altitude hypoxia in Tibetan migratory locusts. Nat. Commun. 2018;9:4991. doi: 10.1038/s41467-018-07529-8. - DOI - PMC - PubMed
    1. Zhao J., Xia Y., Cannon C.H. Evolutionary diversification of alpine ginger reflects the early uplift of the Himalayan-Tibetan Plateau and rapid extrusion of Indochina. Gondwana Res. 2016;32:232–241. doi: 10.1016/j.gr.2015.02.004. - DOI
    1. Cui Y., Liu D., Zhao Z., Zhang J., Li S., Liu Z. Transcriptome analysis and identification of genes associated with leaf crude protein content in foxtail millet [Setaria italica (L.) P. Beauv.] Front. Genet. 2023;14:1122212. doi: 10.3389/fgene.2023.1122212. - DOI - PMC - PubMed
    1. Liu P., Zhang X., Meng R., Liu C., Li M., Zhang T. Identification of chemosensory genes from the antennal transcriptome of Semiothisa cinerearia. PLoS ONE. 2020;15:e0237134. doi: 10.1371/journal.pone.0237134. - DOI - PMC - PubMed

LinkOut - more resources