. 2024 Aug 15;15(8):1079.
doi: 10.3390/genes15081079.

Proteomic and Phosphoproteomic Analyses during Plant Regeneration Initiation in Cotton (Gossypium hirsutum L.)

Affiliations

Proteomic and Phosphoproteomic Analyses during Plant Regeneration Initiation in Cotton (Gossypium hirsutum L.)

Haixia Guo et al. Genes (Basel). .

Abstract

Somatic embryogenesis (SE) is a biotechnological tool used to generate new individuals and is the preferred method for rapid plant regeneration. However, the molecular basis underlying somatic cell regeneration through SE is not yet fully understood, particularly regarding interactions between the proteome and post-translational modifications. Here, we performed association analysis of high-throughput proteomics and phosphoproteomics in three representative samples (non-embryogenic calli, NEC; primary embryogenic calli, PEC; globular embryos, GE) during the initiation of plant regeneration in cotton, a pioneer crop for genetic biotechnology applications. Our results showed that protein accumulation is positively regulated by phosphorylation during SE, as revealed by correlation analyses. Of the 1418 proteins that were differentially accumulated in the proteome and the 1106 phosphoproteins that were differentially regulated in the phosphoproteome, 115 proteins with 229 phosphorylation sites overlapped (co-differential). Furthermore, seven dynamic trajectory patterns of differentially accumulated proteins (DAPs) and the correlated differentially regulated phosphoproteins (DRPPs) pairs with enrichment features were observed. During the initiation of plant regeneration, functional enrichment analysis revealed that the overlapping proteins (DAPs-DRPPs) were considerably enriched in cellular nitrogen metabolism, spliceosome formation, and reproductive structure development. Moreover, 198 DRPPs (387 phosphorylation sites) were specifically regulated at the phosphorylation level and showed four patterns of stage-enriched phosphorylation susceptibility. Furthermore, enrichment annotation analysis revealed that these phosphoproteins were significantly enriched in endosomal transport and nucleus organization processes. During embryogenic differentiation, we identified five DAPs-DRPPs with significantly enriched characteristic patterns. These proteins may play essential roles in transcriptional regulation and signaling events that initiate plant regeneration through protein accumulation and/or phosphorylation modification. This study enriched the understanding of key proteins and their correlated phosphorylation patterns during plant regeneration, and also provided a reference for improving plant regeneration efficiency.

Keywords: cotton; plant regeneration; proteomic and phosphoproteomic analyses; somatic embryogenesis.


Conflict of interest statement

The authors declare no conflict of interest.

Figures
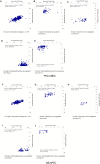
Figure 1
Figure 1
The positive correlation between changes in proteins and their phosphorylation. Correlation between protein and phosphorylated modification changes in PEC vs. NEC (A). Significantly upregulated proteins (B), significantly downregulated proteins (C), significantly upregulated phosphoproteins (D), and significantly downregulated phosphoproteins (E). Correlation between protein and phosphorylated modification changes in GE vs. PEC (F). Significantly upregulated proteins (G), significantly downregulated proteins (H), significantly upregulated phosphoproteins (I), and significantly downregulated phosphoproteins (J).
Figure 2
Figure 2
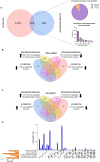
Association analysis of DAPs and correlated DRPPs during SE. (A) Venn diagram of DAPs and DRPPs in the proteome and phosphoproteome. The proportion of modified amino acids (upper right) and phosphorylation sites per protein (lower right) in overlapping proteins. S, serine; T, threonine; Y, tyrosine. (B) Venn diagram of up- and downregulated proteins/phosphoproteins in PEC vs. NEC. (C) Venn diagram of up- and downregulated proteins/phosphoproteins in GE vs. PEC. (D) Upset plots showing the intersection of DAPs and DRPPs of PEC vs. NEC, GE vs. PEC, and GE vs. NEC in the proteome and phosphoproteome. Blue bars: The horizontal axis represents comparison groups in different protein datasets (proteome or phosphoproteome), whereas the vertical axis represents the number of DAPs or DRPPs in each dataset. The red bars indicate the number of DAPs or DRPPs in different groups.
Figure 3
Figure 3
Hierarchical clustering analysis (HCA) of the overlapping proteins (DAPs-DRPPs) during plant regeneration initiation. (A) Hierarchical clustering analysis (HCA) of overlapping proteins in the quantitative proteome. Cluster identification and the number of profiles included in each cluster are indicated on the left. The x-axis represents the samples, and the y-axis represents the relative abundance of the proteins. The color of the line indicates the affiliation of the protein to the current class. Heat map: The x-axis represents the samples, the y-axis represents the different phosphoproteins, and the color of the heat map indicates the relative abundance of proteins in the sample. The two most significantly enriched items from the GO and Kyoto Encyclopedia of Genes and Genomes (KEGG) enrichment analyses are shown to the right of the corresponding cluster enrichment pattern clustering graphs. GO-CC: GO-cellular component. GO-BF, biological process. GO-MF: molecular function. (B) HCA of overlapping phosphoproteomic proteins. The x-axis represents the samples, and the y-axis represents the relative abundance of phosphoproteins.
Figure 4
Figure 4
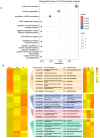
Proteins susceptible to regulation by phosphorylation during SE. (A) GO enrichment analysis of the proteins susceptible to regulation by phosphorylation. (B) Heat map of the 198 phosphoproteins (387 sites). A global color gradient ranging between green for proteins with fold change ≤ 0.5, yellow for values between 0.6 and 2, and red for values ≥ 2.0 was applied to the clustered data set.

Similar articles

Cited by

References

    1. Vogel G. How does a single somatic cell become a whole plant? Science. 2005;309:86. doi: 10.1126/science.309.5731.86. - DOI - PubMed
    1. Roeder A., Otegui M., Dixit R., Anderson C., Faulkner C., Zhang Y., Harrison M., Kirchhelle C., Goshima G., Coate J., et al. Fifteen compelling open questions in plant cell biology. Plant Cell. 2021;34:72–102. doi: 10.1093/plcell/koab225. - DOI - PMC - PubMed
    1. Yao Y., Xiang D., Wu N., Wang Y., Chen Y., Yuan Y., Ye Y., Hu D., Zheng C., Yan Y., et al. Control of rice ratooning ability by a nucleoredoxin that inhibits histidine kinase dimerization to attenuate cytokinin signaling in axillary buds. Mol. Plant. 2023;16:1911–1926. doi: 10.1016/j.molp.2023.10.009. - DOI - PubMed
    1. Zhang S., Zhu C., Zhang X., Liu M., Xue X., Lai C., Xu X., Chen Y., Zhang Z., Lai Z., et al. Single-cell RNA sequencing analysis of the embryogenic callus clarifies the spatiotemporal developmental trajectories of the early somatic embryo in Dimocarpus longan. Plant J. 2023;115:1277–1297. doi: 10.1111/tpj.16319. - DOI - PubMed
    1. Zhu X., Xu Z., Wang G., Cong Y., Yu L., Jia R., Qin Y., Zhang G., Li B., Yuan D., et al. Single-cell resolution analysis reveals the preparation for reprogramming the fate of stem cell niche in cotton lateral meristem. Genome Biol. 2023;24:194. - PMC - PubMed

MeSH terms

LinkOut - more resources