. 2024 Aug 19;15(8):1093.
doi: 10.3390/genes15081093.

Integration of Bioinformatics and Machine Learning to Identify CD8+ T Cell-Related Prognostic Signature to Predict Clinical Outcomes and Treatment Response in Breast Cancer Patients

Affiliations

Integration of Bioinformatics and Machine Learning to Identify CD8+ T Cell-Related Prognostic Signature to Predict Clinical Outcomes and Treatment Response in Breast Cancer Patients

Baoai Wu et al. Genes (Basel). .

Abstract

The incidence of breast cancer (BC) continues to rise steadily, posing a significant burden on the public health systems of various countries worldwide. As a member of the tumor microenvironment (TME), CD8+ T cells inhibit cancer progression through their protective role. This study aims to investigate the role of CD8+ T cell-related genes (CTRGs) in breast cancer patients.

Methods: We assessed the abundance of CD8+ T cells in the TCGA and METABRIC datasets and obtained CTRGs through WGCNA. Subsequently, a prognostic signature (CTR score) was constructed from CTRGs screened by seven machine learning algorithms, and the relationship between the CTR score and TME, immunotherapy, and drug sensitivity was analyzed. Additionally, CTRGs' expression in different cells within TME was identified through single-cell analysis and spatial transcriptomics. Finally, the expression of CTRGs in clinical tissues was verified via RT-PCR.

Results: The CD8+ T cell-related prognostic signature consists of two CTRGs. In the TCGA and METABRIC datasets, the CTR score appeared to be negatively linked to the abundance of CD8+ T cells, and BC patients with higher risk score show a worse prognosis. The low CTR score group exhibits higher immune infiltration levels, closely associated with inhibiting the tumor microenvironment. Compared with the high CTR score group, the low CTR score group shows better responses to chemotherapy and immune checkpoint therapy. Single-cell analysis and spatial transcriptomics reveal the heterogeneity of two CTRGs in different cells. Compared with the adjacent tissues, CD163L1 and KLRB1 mRNA are downregulated in tumor tissues.

Conclusions: This study establishes a robust CD8+ T cell-related prognostic signature, providing new insights for predicting the clinical outcomes and treatment responses of breast cancer patients.

Keywords: CD8+ T cell; breast cancer; machine learning; prognostic signature; tumor microenvironment.


Conflict of interest statement

The authors declare no conflicts of interest.

Figures

Figure 1
Figure 1
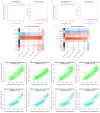
Survival analysis based on CD8+ T cell abundance. Survival curves for different CD8+ T cell abundances in the TCGA-BRCA and METABRIC cohorts. (A,E) The xCell algorithm. (B,F) The quantiseq algorithm. (C,G) The ssGSEA algorithm. (D,H) MCPcounter algorithm.
Figure 2
Figure 2
WGCNA analysis based on CD8+ T cell abundance. (A,B) Evaluation of the soft threshold in the TCGA-BRCA and METABRIC. (C,D) Correlation between each gene co-expression module and CD8+ T cell abundance in both datasets. Scatter plots of the green module MM and GS in the TCGA-BRCA cohort, including Activated_CD8_T_cell_ssGSEA (E), T_cells_CD8_MCPcounter (F), T_cells_CD8_xCell (G), and T_cells_CD8_quantiseq (H). Scatter plots of the turquoise module MM and GS in the METABRIC cohort, including Activated_CD8_T_cell_ssGSEA (I), T_cells_CD8_MCPcounter (J), T_cells_CD8_xCell (K), and T_cells_CD8_quantiseq (L).
Figure 3
Figure 3
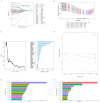
Screening of prognostic CTRGs through machine learning algorithm. (A) Plot of ten-fold cross-validations. (B) Plot of the LASSO coefficient. Screening of prognostic CTRGs using the Random Forest algorithm (C), and CoxBoost algorithm (D). (E) The top 10 most vital genes selected by the XGboost algorithm. (F) The top 10 most vital genes selected by the GBM algorithm.
Figure 4
Figure 4
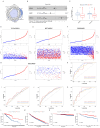
Construction of prognostic signature related to CD8+ T cells. (A) Venn diagram of six algorithms. (B) Identifying CTRGs with independent prognostic value. (C) Differential expression of two prognostic signature genes in normal and tumor tissues (**** p < 0.0001). Scatter plots of CTR score and survival status in the TCGA-BRCA (D), METABRIC (E), GSE96058 (F), and GSE20685 (G) datasets. (HK) ROC curves of CTR score in the TCGA-BRCA, METABRIC, GSE96058, and GSE20685 datasets. Survival curves in the TCGA-BRCA (L), METABRIC (M), GSE96058 (N), and GSE20685 (O) datasets.
Figure 5
Figure 5
Association of CTR score with CD8+ T cell abundance. Comparison of CD8+ T cell abundance estimated by four algorithms in low and high CTR score groups in TCGA-BRCA (AD) and METABRIC (EH) (**** p < 0.0001). Assessment of the association between CTR score and CD8+ T cell abundance estimated by four algorithms in TCGA-BRCA (I) and METABRIC (J) (*** p < 0.001). Correlation analysis between two prognostic signature genes and CD8+ T cell abundance, estimated by four algorithms in TCGA-BRCA (K) and METABRIC (L).
Figure 6
Figure 6
Relationship between CTR score and clinical characteristics. Differences in CTR score in the TCGA-BRCA cohort by status (A), stage (B), T stage (C), and age (D) (* p-value < 0.05; ** p-value < 0.01; *** p-value < 0.001; **** p-value < 0.0001). Differences in CTR score in the METABRIC cohort by status (E), ER (F), and age (G). Survival curves for different risk groups in the TCGA-BRCA cohort for ages < 65 (H), ages ≥ 65 (I), stages I–II (J), stages III–VI (K), T1–T2 (L), T3–T4 (M), N0–N1 (N), and N2–N3 (O).
Figure 7
Figure 7
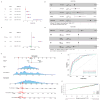
Construction of a nomogram. Assessment of the independence of the CTR score in the TCGA-BRCA (A,B) and METABRIC (C,D) cohorts (* p-value < 0.05; ** p-value < 0.01; *** p-value < 0.001). (E) Nomogram in the TCGA-BRCA. (F) ROC curve of the nomogram. (G) Calibration curve of the nomogram.
Figure 8
Figure 8
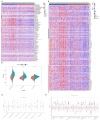
Relationship between CTR score and immune cell infiltration. (A) Differences in immune infiltration levels between different CTR score groups assessed by five algorithms. (B) Differences in tumor microenvironment scores (immune, stromal, and estimate score) between CTR score groups (**** p < 0.0001). (CE) Association of CTR score with immune checkpoints, cancer immune cycles and 29 immune characteristics (* p < 0.05, ** p < 0.01, *** p < 0.001, **** p < 0.0001).
Figure 9
Figure 9
Differences in sensitivity to immunotherapy and chemotherapeutic agents in various CTR score groups. (AD) Differences in Immune Phenotype Scores (IPS) between different groups (*** p < 0.001). (EL) Differences in chemotherapy sensitivity to docetaxel, cisplatin, 5-fluorouracil, cyclophosphamide, epirubicin, vinorelbine, vincristine, and gemcitabine between different groups (* p < 0.05, **** p < 0.0001).
Figure 10
Figure 10
Single-cell and spatial transcriptomic analysis of prognostic feature genes. (A) Different cell types in the EMTAB8107 dataset. Expression levels of KLRB1 (B) and CD163L1 (C) in different cells. (D) Distribution of different cells in GSE203612-GSM6177603-NYU-BRCA2. (E,F) Distribution of CD163L1 and KLRB1 in different cells.
Figure 11
Figure 11
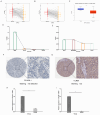
Validation of expression levels of prognostic-related CTRGs. (A,B) Expression levels of KLRB1 and CD163L1 in cancerous tissues and paired adjacent non-cancerous tissues (**** p < 0.0001). (C) Expression of CD163L1 protein in the UALCAN database (**** p < 0.0001). (D) Expression levels of CD163L1 in normal epithelial cell line (HMEL) and breast cancer cell lines (CAL51, T47D, and HMC18) in the CCLE database. (E) Expression level of KLRB1 in breast cancer cell lines. (F,G) IHC staining images of KLRB1 and CD163L1 proteins in cancerous tissues. (H,I) Experimental validation of the prognostic CTRGs (* p < 0.05, *** p < 0.001).

Similar articles

Cited by

References

    1. Trapani D., Ginsburg O., Fadelu T., Lin N.U., Hassett M., Ilbawi A.M., Anderson B.O., Curigliano G. Global Challenges and Policy Solutions in Breast Cancer Control. Cancer Treat. Rev. 2022;104:102339. doi: 10.1016/j.ctrv.2022.102339. - DOI - PubMed
    1. Sung H., Ferlay J., Siegel R.L., Laversanne M., Soerjomataram I., Jemal A., Bray F. Global Cancer Statistics 2020: GLOBOCAN Estimates of Incidence and Mortality Worldwide for 36 Cancers in 185 Countries. CA Cancer J. Clin. 2021;71:209–249. doi: 10.3322/caac.21660. - DOI - PubMed
    1. Goel S., Chandarlapaty S. Emerging Therapies for Breast Cancer. Cold Spring Harb. Perspect. Med. 2023;13:a041333. doi: 10.1101/cshperspect.a041333. - DOI - PMC - PubMed
    1. Loibl S., André F., Bachelot T., Barrios C.H., Bergh J., Burstein H.J., Cardoso M.J., Carey L.A., Dawood S., Del Mastro L., et al. Early Breast Cancer: ESMO Clinical Practice Guideline for Diagnosis, Treatment and Follow-Up. Ann. Oncol. 2024;35:159–182. doi: 10.1016/j.annonc.2023.11.016. - DOI - PubMed
    1. Siegel R.L., Giaquinto A.N., Jemal A. Cancer Statistics, 2024. CA Cancer J. Clin. 2024;74:12–49. doi: 10.3322/caac.21820. - DOI - PubMed

Substances

LinkOut - more resources