. 2024 Jul 25;60(8):1202.
doi: 10.3390/medicina60081202.

Expression Pattern of PDE4B, PDE4D, and SFRP5 Markers in Colorectal Cancer

Affiliations

Expression Pattern of PDE4B, PDE4D, and SFRP5 Markers in Colorectal Cancer

Mateo Bevanda et al. Medicina (Kaunas). .

Abstract

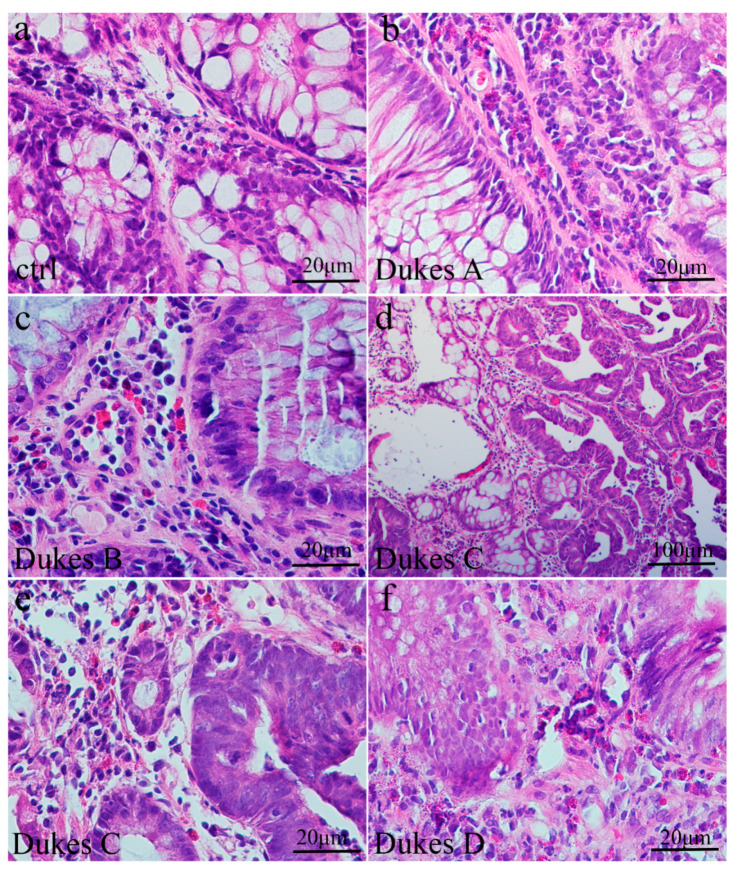
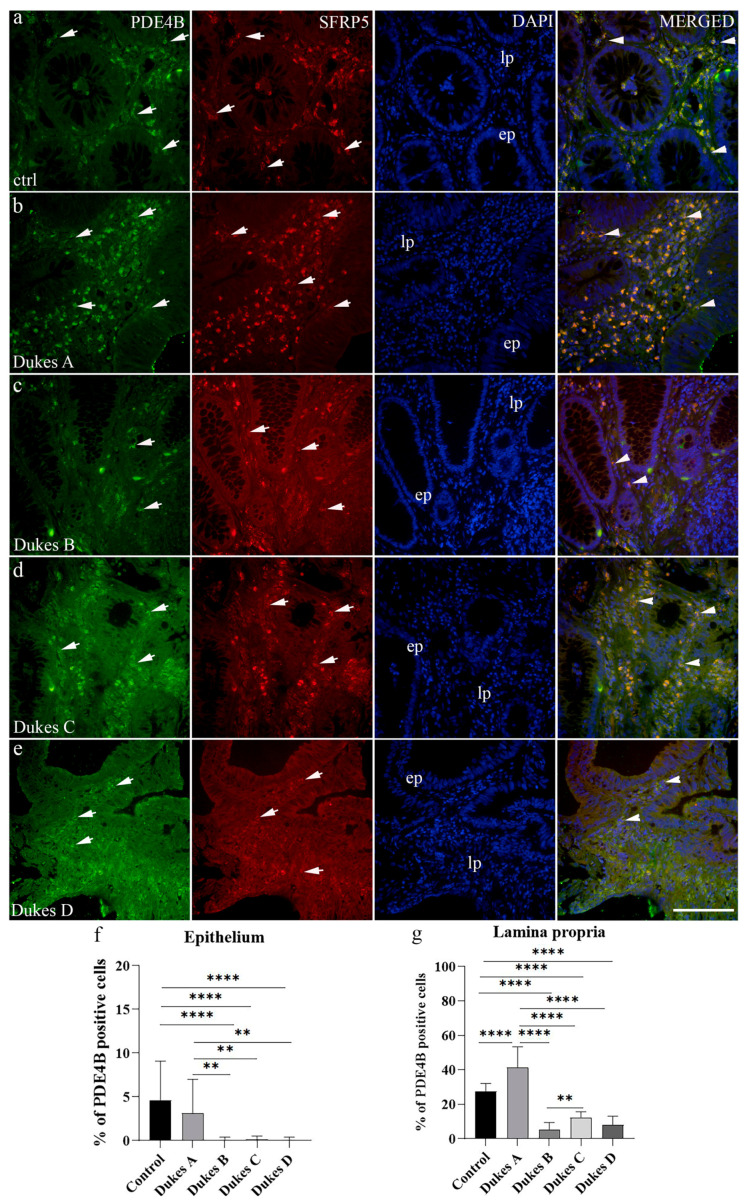
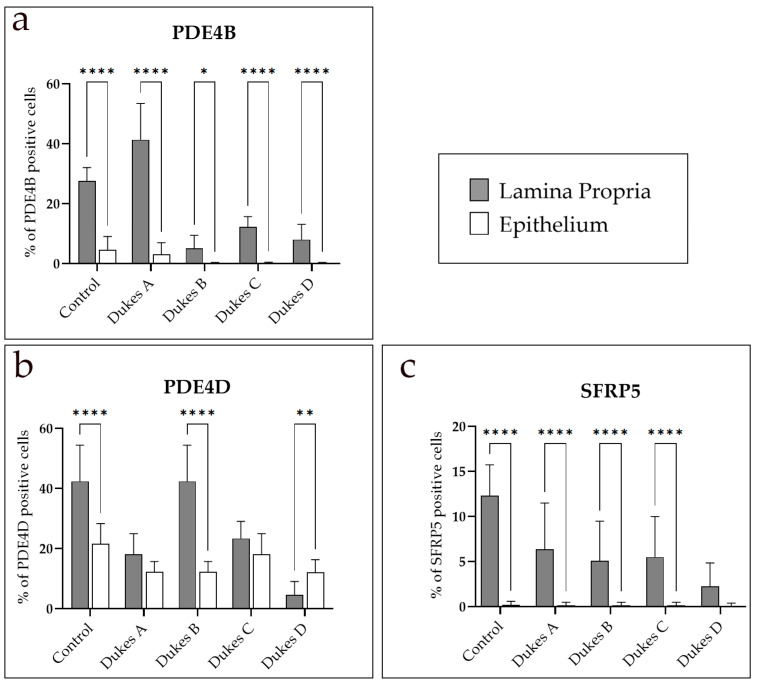
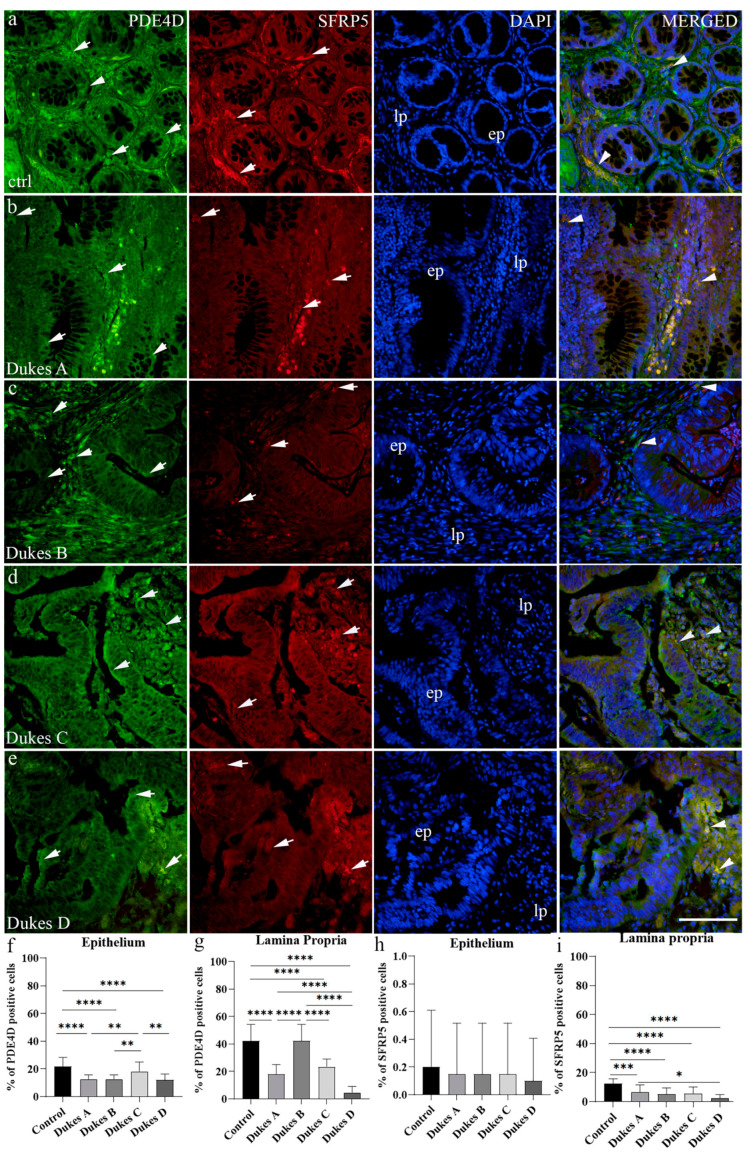
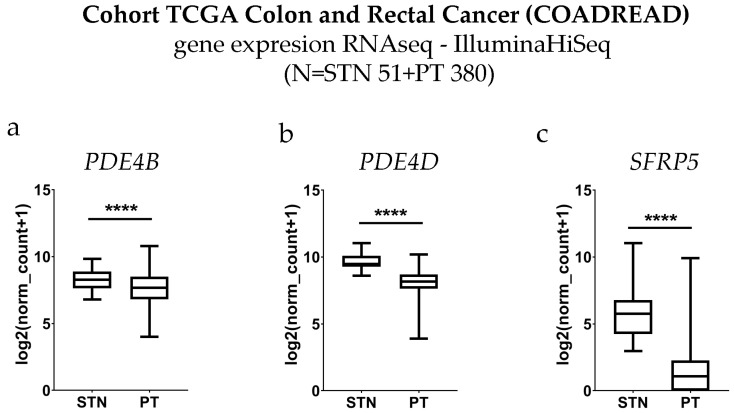
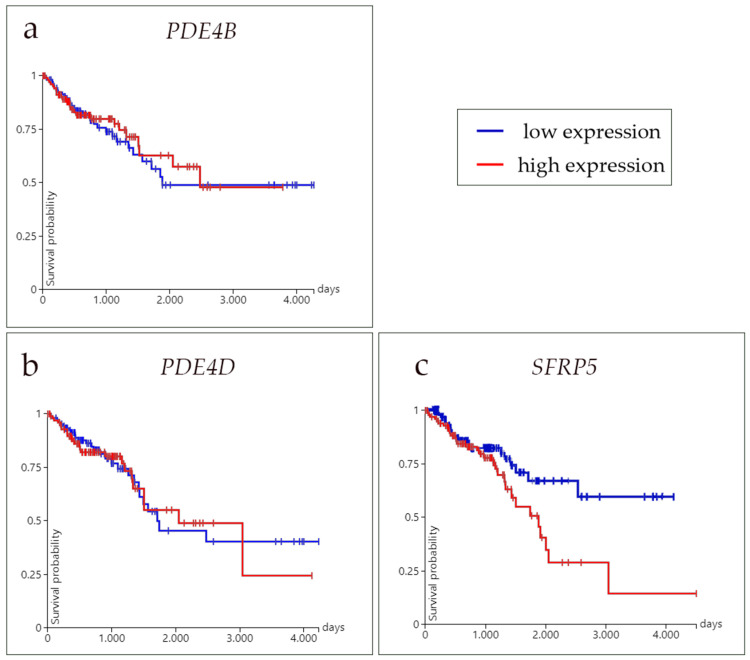
Background and Objectives: Colorectal cancer (CRC) is the most frequently diagnosed malignant disease of the gastrointestinal system, and new diagnostic and prognostic markers are needed to elucidate the complete tumor profile. Materials and Methods: We used CRC tumor tissues (Dukes' A-D) and adjacent noncancerous tissues of 43 patients. Immunohistochemistry was used to examine the expression of phosphodiesterase 4B (PDE4B), phosphodiesterase 4D (PDE4D), and secreted frizzled related protein 5 (SFRP5) markers. We also analyzed the expression levels of PDE4B, PDE4D, and SFRP5 in CRC tissues compared to control tissues using RNA-sequencing data from the UCSC Xena browser. Results: In CRC stages, the distribution of PDE4B-positive cells varied, with differing percentages between epithelium and lamina propria. Statistically significant differences were found in the number of PDE4B-positive epithelial cells between healthy controls and all CRC stages, as well as between different CRC stages. Similarly, significant differences were observed in the number of PDE4B-positive cells in the lamina propria between healthy controls and all CRC stages, as well as between different CRC stages. CRC stage Dukes' C exhibited a significantly higher number of PDE4B-positive cells in the lamina propria compared to CRC stage Dukes' B. Significant differences were noted in the number of PDE4D-positive epithelial cells between healthy controls and CRC stages Dukes' A, B, and D, as well as between CRC stage Dukes' C and stages A, B, and D. CRC stage Dukes' A had significantly more PDE4D-positive cells in the lamina propria compared to stage D. Significant differences were also observed in the number of SFRP5-positive cells in the lamina propria between healthy controls and all CRC stages, as well as between CRC stages Dukes' A and D. While the expression of PDE4D varied across CRC stages, the expression of SFRP5 remained consistently strong in both epithelium and lamina propria, with significant differences noted mainly in the lamina propria. The expression levels of PDE4B, PDE4D, and SFRP5 reveal significant differences in the expression of these genes between CRC patients and healthy controls, with notable implications for patient prognosis. Namely, our results demonstrate that PDE4B, PDE4D, and SFRP5 are significantly under-expressed in CRC tissues compared to control tissues. The Kaplan-Meier survival analysis and the log-rank (Mantel-Cox) test revealed distinct prognostic implications where patients with lower expression levels of SFRP5 exhibited significantly longer overall survival. The data align with our immunohistochemical results and might suggest a potential tumor-suppressive role for these genes in CRC. Conclusions: Considering significantly lower gene expression, aligned with our immunohistochemical data in tumor tissue in comparison to the control tissue, as well as the significantly poorer survival rate in the case of its higher expression, we can hypothesize that SFRP5 is the most promising biomarker for CRC out of the observed proteins. These findings suggest alterations in PDE4B, PDE4D, and SFRP5 expression during CRC progression, as well as between different stages of CRC, with potential implications for understanding the molecular mechanisms involved in CRC development and progression.

Keywords: PDE4B; PDE4D; SFRP5; colorectal cancer.


Conflict of interest statement

The authors declare no conflicts of interest.

Figures

Figure 1
Figure 1
Section through the normal adult colon (a) showing crypts containing abundant goblet cells and underlying lamina propria; section of human Dukes’ A colon cancer (b) with moderately-to-well-formed crypts lined by atypical epithelial cells which are large and tall; section of human Dukes’ B colon cancer (c) with the gland lumen containing cellular debris; section of human Dukes’ C and D (df) colon with irregularly and poorly formed glands lined by atypical epithelial cells with high mitotic activity and necrotic debris.
Figure 2
Figure 2
Immunofluorescence staining of the control normal adult human colon (a), human Dukes’ A (b), human Dukes’ B (c), human Dukes’ C (d), and human Dukes’ D (e) colon cancer. Arrows show the expression pattern of phosphodiesterase 4B (PDE4B) and secreted frizzled related protein 5 (SFRP5) positive cells in epithelium (ep) and lamina propria (lp) as indicated on the DAPI image. Co-localization of PDE4B and SFRP5 is indicated by arrowheads under column merged. Images were taken at a magnification of 40×. The scale bar is 100 µm, which refers to all images. The percentages of PDE4B-positive cells in control tissue and human Dukes’ A–D CRC stages in the epithelium (f) and lamina propria (g). To compare expression of analyzed protein in different substructures of colon mucosa between the observed groups, ordinary one-way ANOVA followed by Tukey’s multiple comparison tests was used. Data are presented as the mean ± SD (vertical line). Bars are presented in different color for easier distinction between groups. Significant differences are indicated by ** p ˂ 0.001 and **** p ˂ 0.00001. In each group, a minimum of ten representative images were assessed.
Figure 3
Figure 3
The percentages of phosphodiesterase 4B (PDE4B) (a), phosphodiesterase 4D (PDE4D) (b), and secreted frizzled related protein 5 (SFRP5) (c) positive cells in the epithelium and lamina propria in control tissue and human Dukes’ A–D colon cancer. Within each analyzed group, a two-way ANOVA test followed by Šídák’s multiple comparisons test was used to compare the expression of the observed proteins between the different substructures. Data are presented as the mean ± SD (vertical line). Significant differences are indicated by * p ˂ 0.01, ** p ˂ 0.001, and **** p ˂ 0.00001. In each group, a minimum of ten representative images were assessed.
Figure 4
Figure 4
Immunofluorescence staining of the control normal adult human colon (a), human Dukes’ A (b), human Dukes’ B (c), human Dukes’ C (d), and human Dukes’ D (e) colon cancer. Arrows show the expression pattern of phosphodiesterase 4D (PDE4D) and secreted frizzled related protein 5 (SFRP5) positive cells in epithelium (ep) and lamina propria (lp) as indicated on the DAPI image. Co-localization of PDE4D and SFRP5 is indicated by arrowheads under column merged. Images were taken at a magnification of 40×. The scale bar is 100 µm, which refers to all images. The percentages of PDE4D- and SFRP5-positive cells in control normal adult human colon and human Dukes’ A–D colon cancer in the epithelium (f,h) and lamina propria (g,i). To compare expression of analyzed proteins in different substructures of colon mucosa between the observed groups, ordinary one-way ANOVA followed by Tukey’s multiple comparison tests was used. Data are presented as the mean ± SD (vertical line). Bars are presented in different color for easier distinction between groups. Significant differences are indicated by * p ˂ 0.01, ** p ˂ 0.001, and **** p ˂ 0.00001. In each group, a minimum of ten representative images were assessed.
Figure 5
Figure 5
Cohort TCGA colon and rectal cancer (COADREAD) gene expression of phosphodiesterase 4B (PDE4B) (a), phosphodiesterase 4D (PDE4D) (b), and secreted frizzled related protein 5 (SFRP5) (c) RNAseq—IlluminaHiSeq with control (STN) and colorectal cancer patient groups (PT). Data are expressed as log2(norm count + 1), unpaired t-test with Welch’s correction, **** p < 0.0001.
Figure 6
Figure 6
Graphic presentation of survival analysis (days) of phosphodiesterase 4B (PDE4B) (a), phosphodiesterase 4D (PDE4D) (b), and secreted frizzled related protein 5 (SFRP5) (c) in high (red line) and low (blue line). mRNA expression in colorectal cancer was expressed as the average survival time in days. The Kaplan–Meier method and log-rank test for survival length were used. Data are used from the TCGA Colon and Rectal Cancer (COADREAD) study.

Similar articles

Cited by

References

    1. Bray F., Ferlay J., Soerjomataram I., Siegel R.L., Torre L.A., Jemal A. Global cancer statistics 2018: GLOBOCAN estimates of incidence and mortality worldwide for 36 cancers in 185 countries. CA Cancer J. Clin. 2018;68:394–424. doi: 10.3322/caac.21492. - DOI - PubMed
    1. Lewandowska A., Rudzki G., Lewandowski T., Stryjkowska-Gora A., Rudzki S. Risk Factors for the Diagnosis of Colorectal Cancer. Cancer Control. 2022;29:10732748211056692. doi: 10.1177/10732748211056692. - DOI - PMC - PubMed
    1. Akkoca A.N., Yanık S., Ozdemir Z.T., Cihan F.G., Sayar S., Cincin T.G., Cam A., Ozer C. TNM and Modified Dukes staging along with the demographic characteristics of patients with colorectal carcinoma. Int. J. Clin. Exp. Med. 2014;7:2828–2835. - PMC - PubMed
    1. Hansen R.T., 3rd, Conti M., Zhang H.T. Mice deficient in phosphodiesterase-4A display anxiogenic-like behavior. Psychopharmacology. 2014;231:2941–2954. doi: 10.1007/s00213-014-3480-y. - DOI - PubMed
    1. Müller M.F., Ibrahim A.E., Arends M.J. Molecular pathological classification of colorectal cancer. Virchows Arch. 2016;469:125–134. doi: 10.1007/s00428-016-1956-3. - DOI - PMC - PubMed

MeSH terms

LinkOut - more resources