

Trends in SARS-CoV-2 Cycle Threshold Values in Bosnia and Herzegovina-A Retrospective Study
- PMID: 39203427
- PMCID: PMC11356242
- DOI: 10.3390/microorganisms12081585
Trends in SARS-CoV-2 Cycle Threshold Values in Bosnia and Herzegovina-A Retrospective Study
Abstract
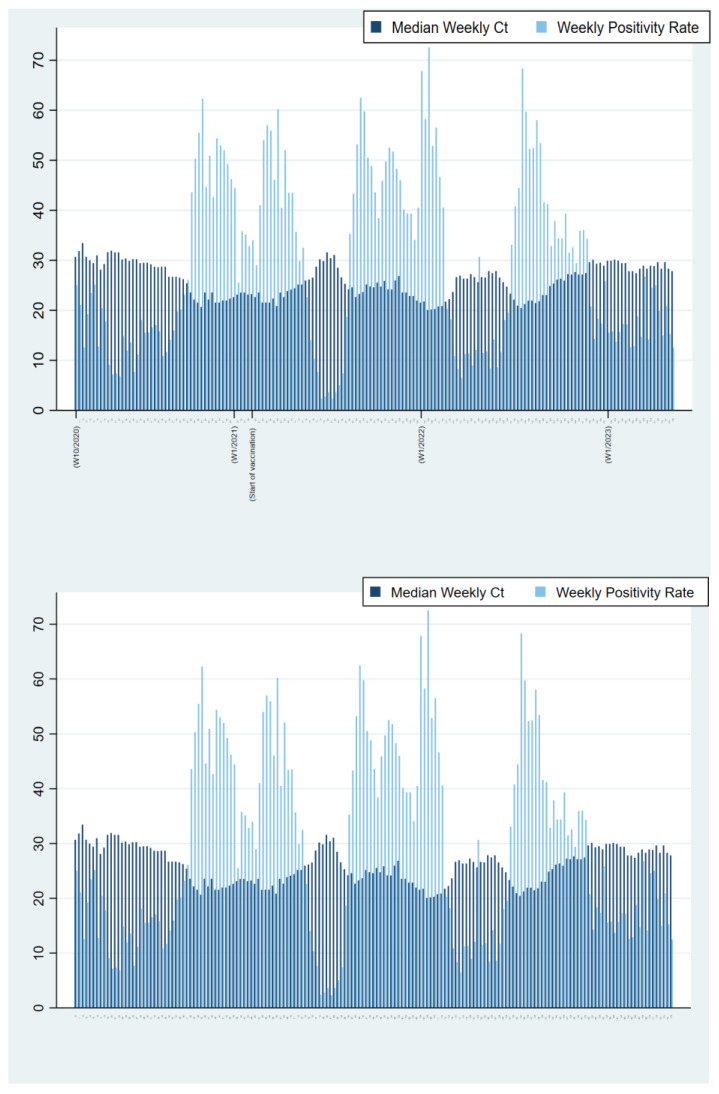
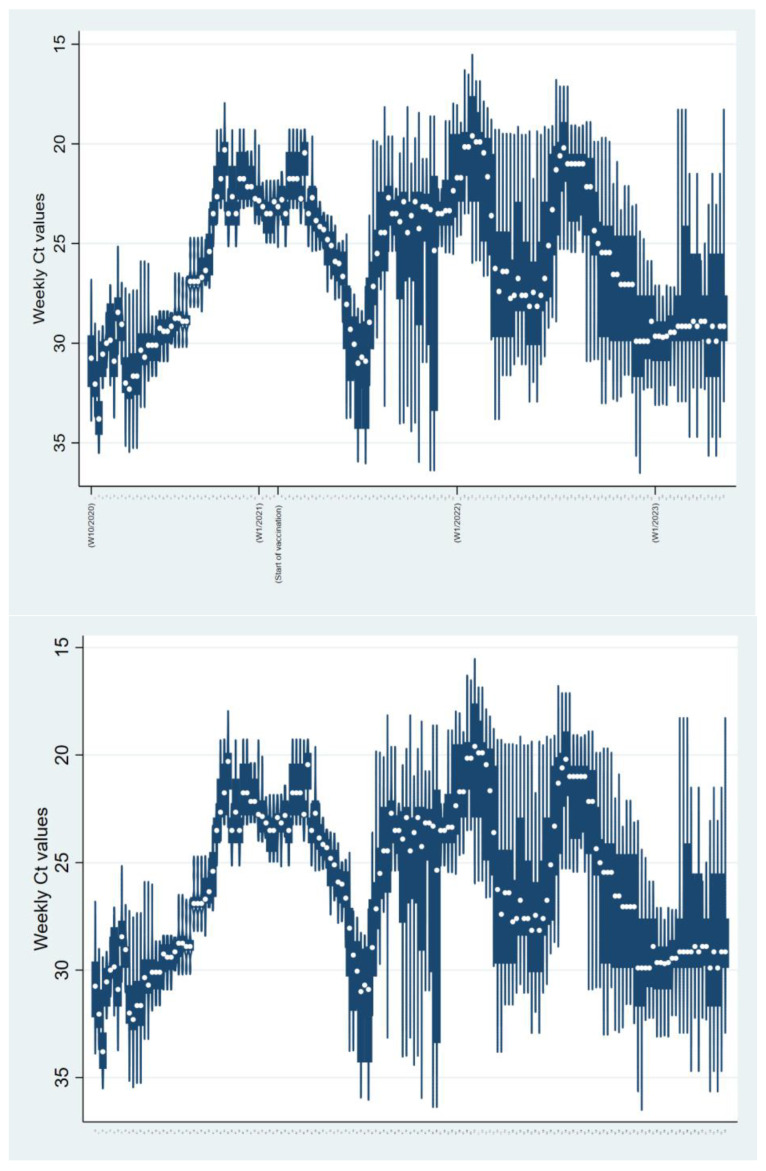
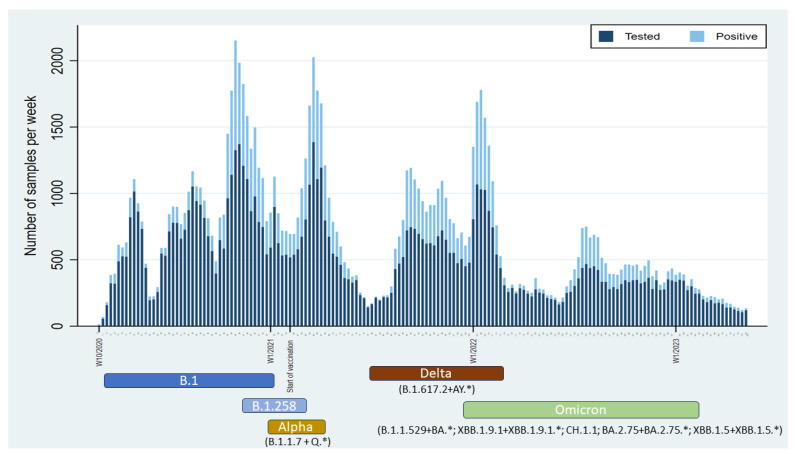
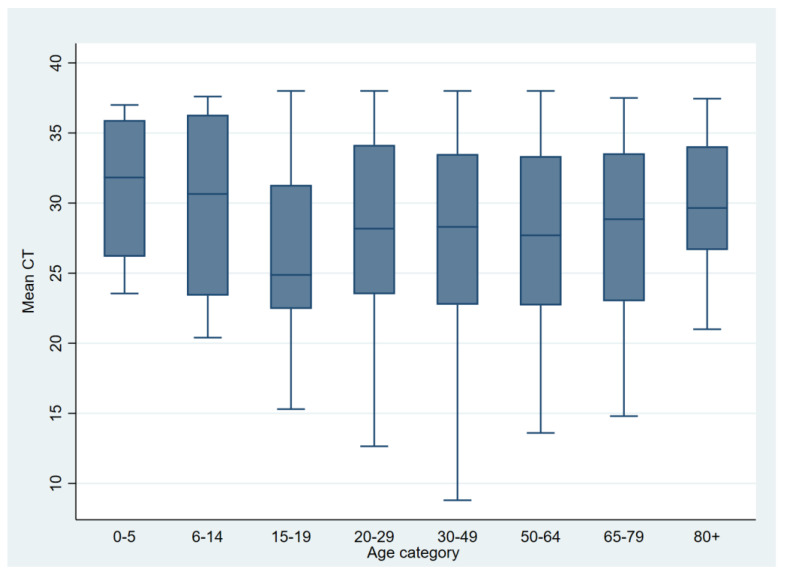
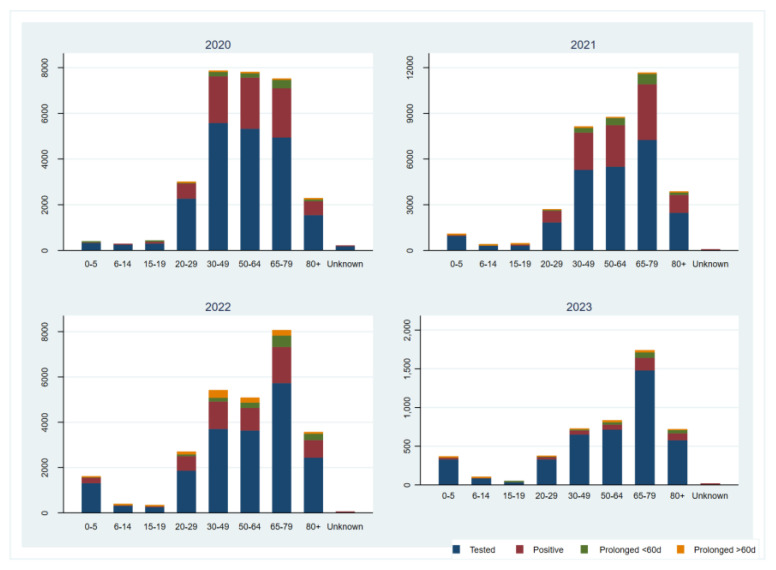
The emergence of severe acute respiratory syndrome coronavirus 2 (SARS-CoV-2), which led to the COVID-19 pandemic, has significantly impacted global public health. The proper diagnosis of SARS-CoV-2 infection is essential for the effective control and management of the disease. This study investigated the SARS-CoV-2 infection using RT-qPCR tests from laboratories in Bosnia and Herzegovina. We performed a retrospective study of demographic data and Ct values from 170,828 RT-qPCR tests from April 2020 to April 2023, representing 9.3% of total national testing. Samples were collected from 83,413 individuals across different age groups. Of all tests, 33.4% were positive for SARS-CoV-2, with Ct values and positivity rates varying across demographics and epidemic waves. The distribution was skewed towards older age groups, although lower positivity rates were observed in younger age groups. Ct values, indicative of viral load, ranged from 12.5 to 38. Lower Ct values correlated with higher positive case numbers, while higher Ct values signaled outbreak resolution. Additionally, Ct values decreased during epidemic waves but increased with the dominance of certain variants. Ct value-distribution has changed over time, particularly after the introduction of SARS-CoV-2 variants of interest/concern. Established Ct value trends might, therefore, be used as an early indicator and additional tool for informed decisions by public health authorities in SARS-CoV-2 and future prospective pandemics. Moreover, they should not be overlooked in future epidemiological events.
Keywords: Bosnia and Herzegovina; Ct values; SARS-CoV-2; decision-making tool; variants of concern.
Conflict of interest statement
The authors declare no conflicts of interest.
Figures
References
-
- Bustin S.A., Benes V., Garson J.A., Hellemans J., Huggett J., Kubista M., Mueller R., Nolan T., Pfaffl M.W., Shipley G.L., et al. The MIQE guidelines: Minimum information for publication of quantitative real-time PCR experiments. Clin. Chem. 2009;55:611–622. doi: 10.1373/clinchem.2008.112797. - DOI - PubMed
-
- Singanayagam A., Patel M., Charlett A., Bernal J.L., Saliba V., Ellis J., Ladhani S., Zambon M., Gopal R. Duration of infectiousness and correlation with RT-PCR cycle threshold values in cases of COVID-19, England, January to May 2020. Eurosurveillance. 2020;25:2001483. doi: 10.2807/1560-7917.ES.2020.25.32.2001483. - DOI - PMC - PubMed
-
- Lyngse F.P., Kirkeby C., Halasa T., Andreasen V., Skov R.L., Møller F.T., Krause T.G., Mølbak K. Nationwide study on SARS-CoV-2 transmission within households from lockdown to reopening, Denmark, 27 February 2020 to 1 August 2020. Eurosurveillance. 2022;27:2001800. doi: 10.2807/1560-7917.ES.2022.27.6.2001800. - DOI - PMC - PubMed
Grants and funding
LinkOut - more resources
Full Text Sources
Miscellaneous
