. 2024 Aug 9;12(8):1633.
doi: 10.3390/microorganisms12081633.

Molecular Evolutionary Analyses of the Fusion Genes in Human Parainfluenza Virus Type 4

Affiliations

Molecular Evolutionary Analyses of the Fusion Genes in Human Parainfluenza Virus Type 4

Fuminori Mizukoshi et al. Microorganisms. .

Abstract

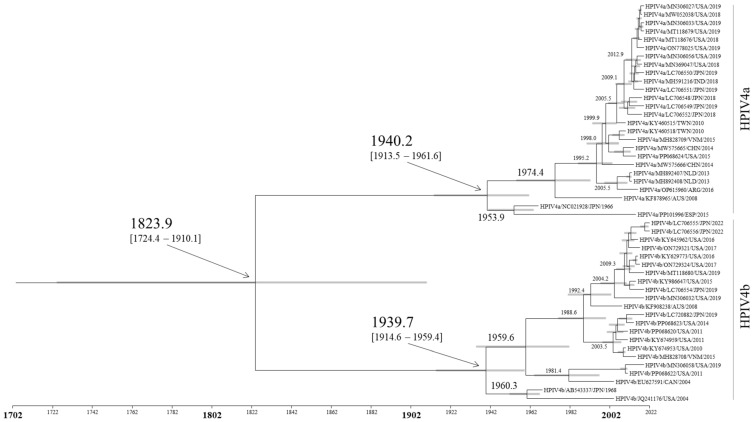
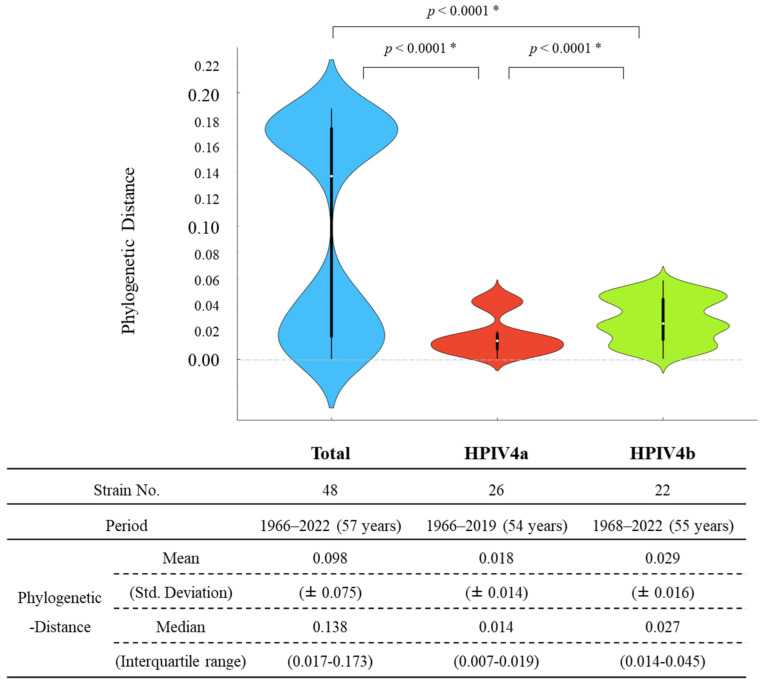
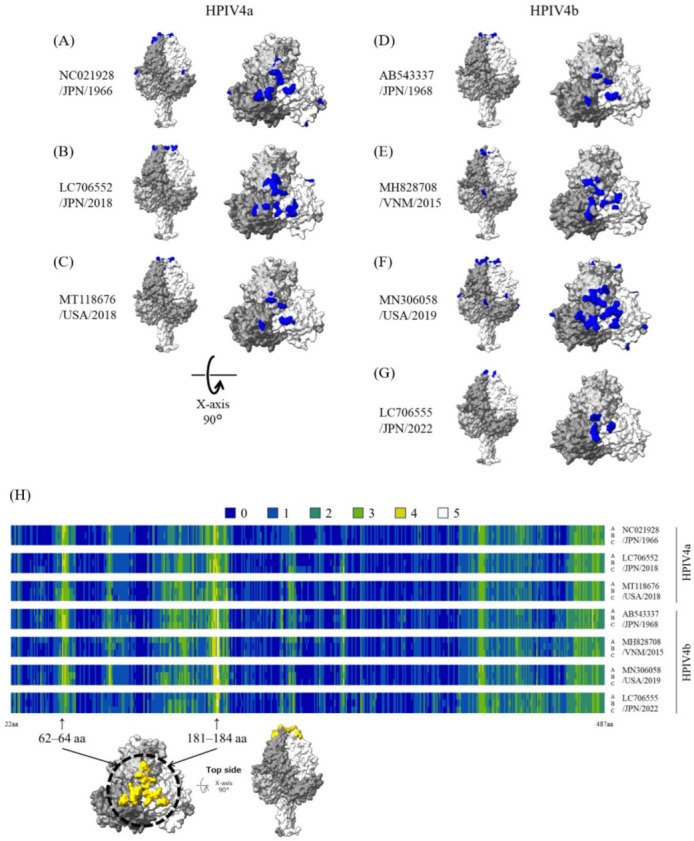
The human parainfluenza virus type 4 (HPIV4) can be classified into two distinct subtypes, 4a and 4b. The full lengths of the fusion gene (F gene) of 48 HPIV4 strains collected during the period of 1966-2022 were analyzed. Based on these gene sequences, the time-scaled evolutionary tree was constructed using Bayesian Markov chain Monte Carlo methods. A phylogenetic tree showed that the first division of the two subtypes occurred around 1823, and the most recent common ancestors of each type, 4a and 4b, existed until about 1940 and 1939, respectively. Although the mean genetic distances of all strains were relatively wide, the distances in each subtype were not wide, indicating that this gene was conserved in each subtype. The evolutionary rates of the genes were relatively low (4.41 × 10⁻⁴ substitutions/site/year). Moreover, conformational B-cell epitopes were predicted in the apex of the trimer fusion protein. These results suggest that HPIV4 subtypes diverged 200 years ago and the progenies further diverged and evolved.

Keywords: fusion gene; human parainfluenza virus 4; molecular evolution.


Conflict of interest statement

The authors declare no conflicts of interest.

Figures

Figure 1
Figure 1
The time-scaled phylogenetic tree of the F gene in HPIV4 constructed by the Bayesian MCMC method. The horizontal axis represents time (years). Gray bars indicate the 95% HPD for a branched year.
Figure 2
Figure 2
Phylodynamics of the F gene in total HPIV4 (A), HPIV4a (B), and HPIV4b (C) determined using Bayesian skyline plot analysis. The y-axis represents the effective population size on logarithmic scale, and the x-axis indicate the time in years. The thick line shows the median value over time. The intervals with the HPDs (95%) are shown by thin lines.
Figure 3
Figure 3
Phylogenetic distances of the F gene in HPIV4 illustrated by violin plots. The width of the violin plot represents kernel density, indicating the distribution shape of the data. The central box plot and white dots represent the interquartile range and the median, respectively. The whiskers from box plots represent the data intervals. The detailed statistical data are shown below the violin plots. There were significant differences in all combinations of genotypes and clusters (Unpaired t-test; * p < 0.0001).
Figure 4
Figure 4
Structural models of the fusion trimer proteins and mapping of predicted conformational epitopes. Chains A, B, and C are colored dark gray, light gray, and white, respectively. The predicted conformational epitopes are shown in blue. The strains are as follows: (A) HPIV4a prototype strain collected in 1966 (NC021928); (B) HPIV4a strain collected in 2018 (LC706552); (C) HPIV4a strain collected in 2018 (MT118676); (D) HPIV4b prototype strain collected in 1968 (AB543337); (E) HPIV4b strain collected in 2015 (MH828708); (F) HPIV4b strain collected in 2019 (MN306058); (G) HPIV44b strain collected in 2022 (LC706555). (H) The sites and the number of methods which were predicted as epitopes are visualized in the heat maps. As an example, the strongly predicted epitope sites (residues aa62–64 and aa181–184) in the fusion trimer proteins are shown in yellow. Detailed information on the sites is presented in Supplementary Table S5.

Similar articles

Cited by

References

    1. Branche A.R., Falsey A.R. Parainfluenza Virus Infection. Semin. Respir. Crit. Care Med. 2016;37:538–554. doi: 10.1055/s-0036-1584798. - DOI - PMC - PubMed
    1. Henrickson K.J. Parainfluenza viruses. Clin. Microbiol. Rev. 2003;16:242–264. doi: 10.1128/CMR.16.2.242-264.2003. - DOI - PMC - PubMed
    1. Kimura H., Hayashi Y., Kitagawa M., Yoshizaki M., Saito K., Harada K., Okayama K., Miura Y., Kimura R., Shirai T., et al. Pathogen Profiles in Outpatients with Non-COVID-19 during the 7th Prevalent Period of COVID-19 in Gunma, Japan. Microorganisms. 2023;11:2142. doi: 10.3390/microorganisms11092142. - DOI - PMC - PubMed
    1. Li Z.J., Zhang H.Y., Ren L.L., Lu Q.B., Ren X., Zhang C.H., Wang Y.F., Lin S.H., Zhang X.A., Li J., et al. Etiological and epidemiological features of acute respiratory infections in China. Nat. Commun. 2021;12:5026. doi: 10.1038/s41467-021-25120-6. - DOI - PMC - PubMed
    1. Wang X., Li Y., Deloria-Knoll M., Madhi S.A., Cohen C., Arguelles V.L., Basnet S., Bassat Q., Brooks W.A., Echavarria M., et al. Global burden of acute lower respiratory infection associated with human parainfluenza virus in children younger than 5 years for 2018: A systematic review and meta-analysis. Lancet Glob. Health. 2021;9:e1077–e1087. doi: 10.1016/S2214-109X(21)00218-7. - DOI - PMC - PubMed

LinkOut - more resources