. 2024 Aug 2;15(8):1004.
doi: 10.3390/mi15081004.

Microfluidic Wound-Healing Assay for Comparative Study on Fluid Dynamic, Chemical and Mechanical Wounding on Microglia BV2 Migration

Affiliations

Microfluidic Wound-Healing Assay for Comparative Study on Fluid Dynamic, Chemical and Mechanical Wounding on Microglia BV2 Migration

Ehsan Yazdanpanah Moghadam et al. Micromachines (Basel). .

Abstract

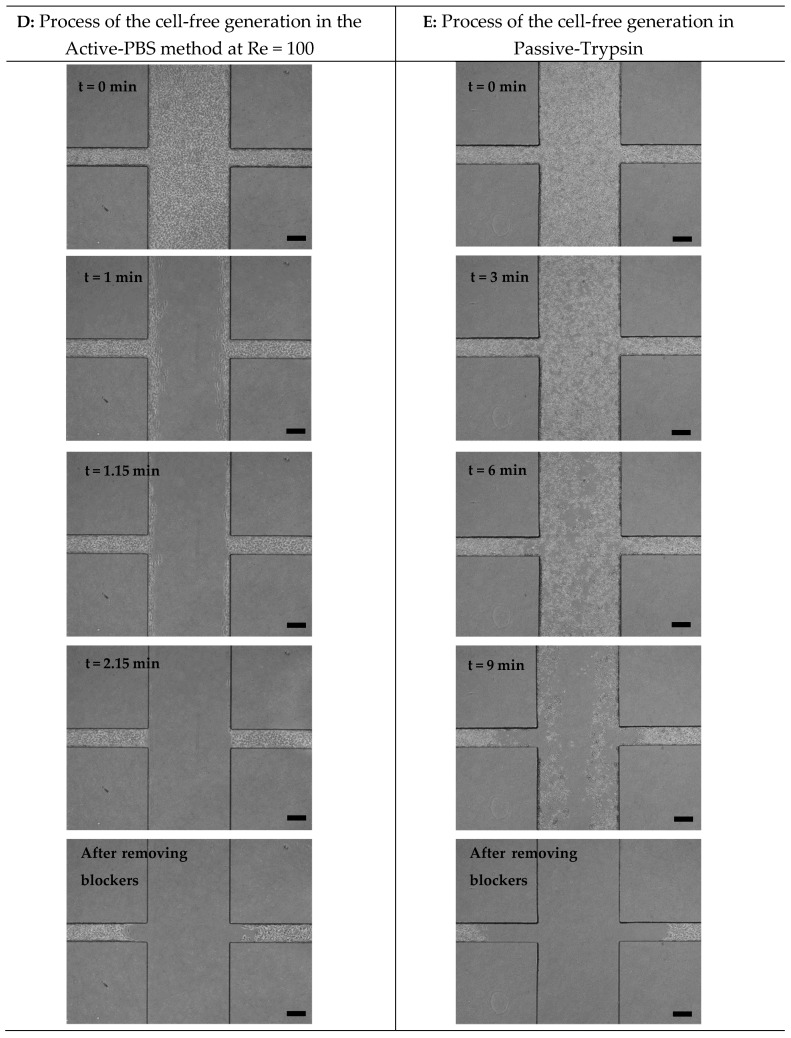
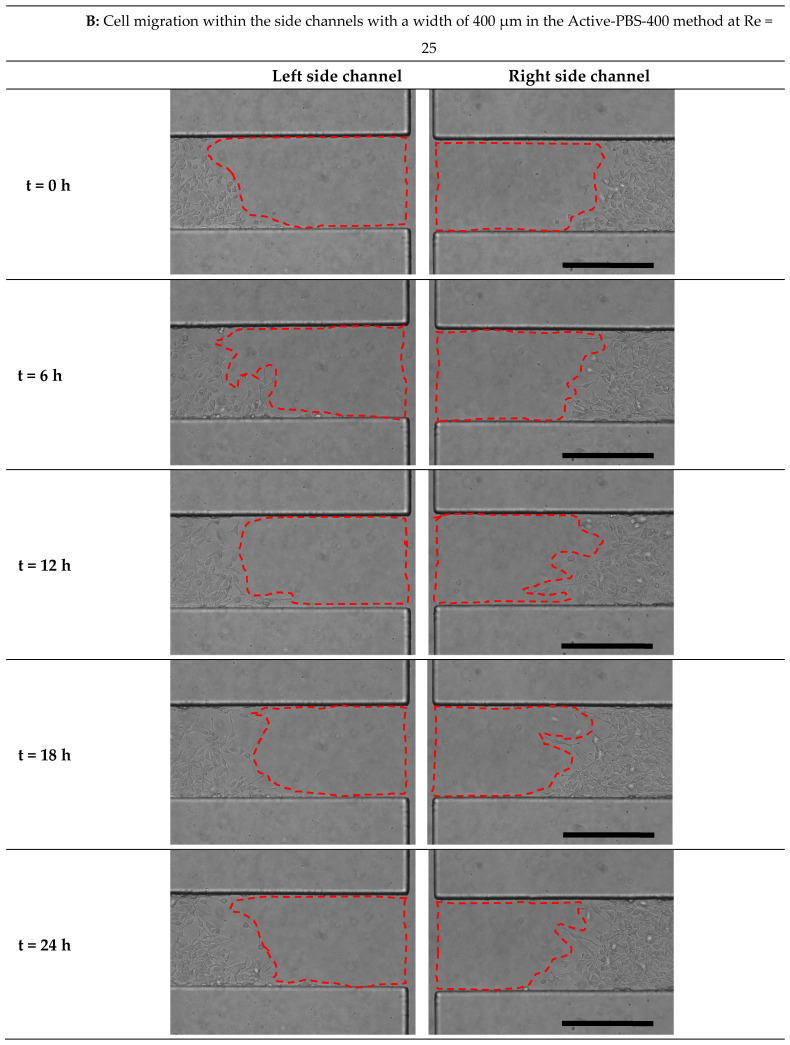
Microglial cells, or brain immune cells, are highly dynamic and continuously migrate in pathophysiological conditions. Their adhesion, as a physical characteristic, plays a key role in migration. In this study, we presented a microfluidic chip combination of two assays: a microglial BV2 adhesion assay and a wound-healing migration assay. The chip could create the cell-free area (wound) under chemical stimuli with trypsin (chemical assay) and also mechanical stimuli with the PBS flow (mechanical assay). The microfluidic chip functioned as the cell adhesion assay during wounding, when the cell adhesion of microglia BV2 cells was characterized by the cell removal time under various shear stress ranges. The cell detachment pattern on the glass substrate was found under physiological conditions. After wounding, the chip operated as a migration assay; it was shown that cell migration in the cell-free area generated chemically with trypsin was highly improved compared to mechanical cell-free area creations with PBS flow and the scratch assay. Our findings indicated that the increase in inlet flow rate in the mechanical assay led to a reduced experiment time and mechanical force on the cells, which could improve cell migration. Furthermore, the study on the effect of the device geometry showed that the increased channel width had an inhibitory effect on cell migration. The bi-functional chip offers an opportunity for the development of new models for a better understanding of cellular adhesion and migration in in vitro microenvironments.

Keywords: chemical and mechanical wound-healing assays; fluid loading; microfluidic cell adhesion assay; microfluidic migration assay; microglia BV2 cells.


Conflict of interest statement

The authors declare that they have no conflict of interest.

Figures

Figure 1
Figure 1
Schematic of the microfluidic assay and process of wound-healing in the device. (A) Photo of the microfluidic device with the microchannels filled with red dye (scale bar = 8 mm). (B) The layout of the device: (C) Top view and (D) side view show the device dimensions.
Figure 2
Figure 2
There were two experimental setups for the cell-free creation using the microfluidic device: (A) Active-PBS method and (B) Passive-Trypsin method. (C) The cell-free area was generated as follows: (C1) microglial BV2 cells reach confluence within the device (scale bar = 400 µm). (C2) While the side channels were blocked, trypsin or PBS flow was driven from the inlet to the outlet to wash the cells in the main channel. (C3) After unblocking the side channels, the initial cell-free area was introduced (the wound edge to the baseline, A0). (C4) The cells began to migrate to the cell-free area. The cell migration area was obtained by subtracting A0 from the cell-free area at the desired time (At) (scale bar= 400 µm).
Figure 3
Figure 3
Process of the cell-free generation for the Active-PBS method at (A) Re = 5, (B) Re = 25, (C) Re = 50, and (D) Re = 100 and for (E) the Passive-Trypsin method. Scale bar = 200 µm.
Figure 3
Figure 3
Process of the cell-free generation for the Active-PBS method at (A) Re = 5, (B) Re = 25, (C) Re = 50, and (D) Re = 100 and for (E) the Passive-Trypsin method. Scale bar = 200 µm.
Figure 4
Figure 4
(A) The areas in the main channel were categorized based on the sequence of cell removal during wounding. Initially, the cells in Ahigh (1,440,000 µm2 with ~1870 cells) were removed, and next Amedium (240,000 µm2 with ~310 cells), and finally Alow (120,000 µm2 with ~155 cells). (B) The duration for cell removal under different shear stress ranges at Re = 25, 50, and 100.
Figure 5
Figure 5
Velocity streamline for the devices with a side channel width of (A) 200 µm and (B) 400 µm at Re = 25, 50, and 100.
Figure 6
Figure 6
Quantification of (A) cell migration distance (δ), (B) cell migration rate (µr), and (C) the initial wound area in the side channel after wounding for the Passive-Trypsin-200 method and the Active-PBS-200 method at Re = 25, 50, and 100. (D) Re corresponding to the inlet of the main channel in the Passive-Trypsin-200 method during wounding. Quantification of (E) cell migration distance (δ), (F) cell migration rate (µr), and (G) the initial wound area in the side channel after wounding for the Passive-Trypsin-200 method and the Active-PBS-400 method at Re = 25, 50, and 100. Data represent the mean ± SD of three independent experiments (n = 3). ANOVA was used for statistical analysis, *: p < 0.05, **: p < 0.01, ***: p < 0.001, and ****: p < 0.0001.
Figure 7
Figure 7
Time-lapse images from cell migration in the side channels with a width of 200 µm in (A) the Passive-Trypsin-200 method and the Active-PBS-200 method at (B) Re = 25, (C) Re = 50, and (D) Re = 100 at 0, 6, 12, 18, and 24 h after the cell-free generation. Scale bar = 200 µm.
Figure 7
Figure 7
Time-lapse images from cell migration in the side channels with a width of 200 µm in (A) the Passive-Trypsin-200 method and the Active-PBS-200 method at (B) Re = 25, (C) Re = 50, and (D) Re = 100 at 0, 6, 12, 18, and 24 h after the cell-free generation. Scale bar = 200 µm.
Figure 7
Figure 7
Time-lapse images from cell migration in the side channels with a width of 200 µm in (A) the Passive-Trypsin-200 method and the Active-PBS-200 method at (B) Re = 25, (C) Re = 50, and (D) Re = 100 at 0, 6, 12, 18, and 24 h after the cell-free generation. Scale bar = 200 µm.
Figure 7
Figure 7
Time-lapse images from cell migration in the side channels with a width of 200 µm in (A) the Passive-Trypsin-200 method and the Active-PBS-200 method at (B) Re = 25, (C) Re = 50, and (D) Re = 100 at 0, 6, 12, 18, and 24 h after the cell-free generation. Scale bar = 200 µm.
Figure 8
Figure 8
Time-lapse images from cell migration in the scratch assay at (A) 0 h, (B) 6 h, (C) 12 h, (D) 18 h, and (E) 24 h. Scale bar = 500 µm.
Figure 9
Figure 9
Time-lapse images from cell migration within the side channels with a width of 400 µm in (A) the Passive-Trypsin-400 method. The Active-PBS-400 method at (B) Re = 25, (C) Re = 50, and (D) Re = 100 at 0, 6, 12, 18, and 24 h after cell-free generation. Scale bar = 400 µm.
Figure 9
Figure 9
Time-lapse images from cell migration within the side channels with a width of 400 µm in (A) the Passive-Trypsin-400 method. The Active-PBS-400 method at (B) Re = 25, (C) Re = 50, and (D) Re = 100 at 0, 6, 12, 18, and 24 h after cell-free generation. Scale bar = 400 µm.
Figure 9
Figure 9
Time-lapse images from cell migration within the side channels with a width of 400 µm in (A) the Passive-Trypsin-400 method. The Active-PBS-400 method at (B) Re = 25, (C) Re = 50, and (D) Re = 100 at 0, 6, 12, 18, and 24 h after cell-free generation. Scale bar = 400 µm.
Figure 9
Figure 9
Time-lapse images from cell migration within the side channels with a width of 400 µm in (A) the Passive-Trypsin-400 method. The Active-PBS-400 method at (B) Re = 25, (C) Re = 50, and (D) Re = 100 at 0, 6, 12, 18, and 24 h after cell-free generation. Scale bar = 400 µm.
Figure 10
Figure 10
Comparison of cell migration by increasing the width of the side channel from 200 µm to 400 µm in four groups of (A) the Passive-Trypsin method and the Active-PBS methods at (B) Re = 25, (C) 50, and (D) 100. (E) Cell migration rate in chemical and mechanical microfluidic assays for the chip with side channel widths of (E) 200 µm and (F) 400 µm at 6, 12, 18, and 24 h after wounding. (G) Cell migration rate during migration with respect to the average shear stress subjected to the residual cells of the side channel in wounding to obtain a range of equivalent shear stress in the scratch assay.

References

    1. Galloway D.A., Phillips A.E.M., Owen D.R.J., Moore C.S. Phagocytosis in the brain: Homeostasis and disease. Front. Immunol. 2019;10:1–15. - PMC - PubMed
    1. Lenz K.M., Nelson L.H. Microglia and beyond: Innate immune cells as regulators of brain development and behavioral function. Front. Immunol. 2018;9:698. doi: 10.3389/fimmu.2018.00698. - DOI - PMC - PubMed
    1. Parkhurst C.N., Gan W.B. Microglia dynamics and function in the CNS. Curr. Opin. Neurobiol. 2010;20:595–600. doi: 10.1016/j.conb.2010.07.002. - DOI - PMC - PubMed
    1. Kotecha S.A., Schlichter L.C. A Kv1.5 to Kv1.3 switch in endogenous hippocampal microglia and a role in proliferation. J. Neurosci. 1999;19:10680–10693. doi: 10.1523/JNEUROSCI.19-24-10680.1999. - DOI - PMC - PubMed
    1. Wake H., Moorhouse A.J., Nabekura J. Functions of microglia in the central nervous system--beyond the immune response. Neuron Glia Biol. 2011;7:47–53. doi: 10.1017/S1740925X12000063. - DOI - PubMed

LinkOut - more resources