. 2024 Aug 14;16(16):2697.
doi: 10.3390/nu16162697.

Impact of Dietary Isoflavones in Standard Chow on Reproductive Development in Juvenile and Adult Female Mice with Different Metabolic Phenotypes

Affiliations

Impact of Dietary Isoflavones in Standard Chow on Reproductive Development in Juvenile and Adult Female Mice with Different Metabolic Phenotypes

Zianka Meyer et al. Nutrients. .

Abstract

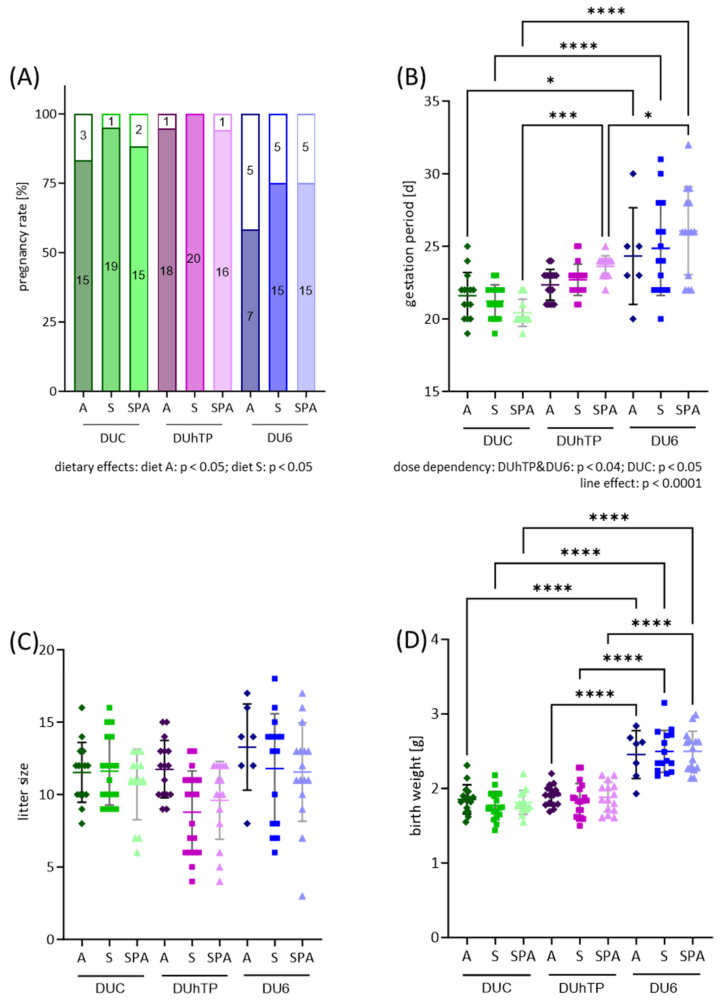
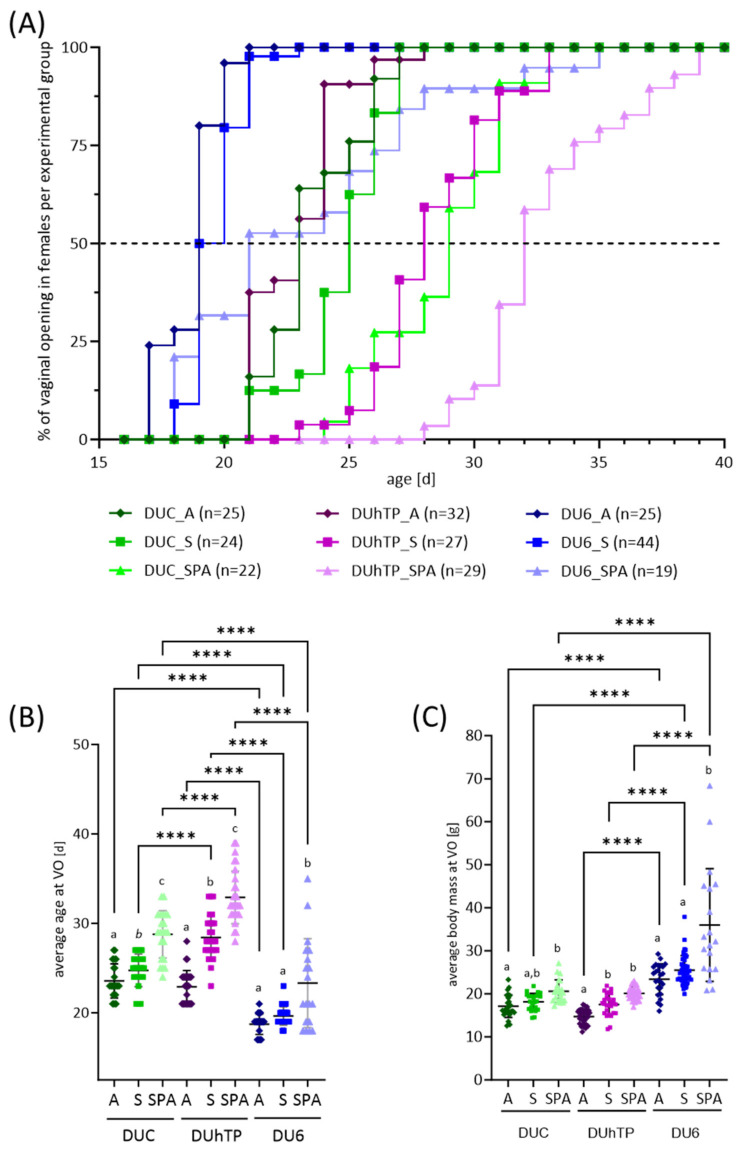
Two factors influencing female reproduction have been repeatedly studied in different animal species and humans, namely, 1. secondary plant compounds, especially phytoestrogens (mainly isoflavones (IFs)), and 2. the physical constitution/metabolic phenotype (e.g., obesity). So far, these research results have only been considered separately. In this study, we investigated the influence on reproduction of both phytochemicals, mainly dietary IFs, and the metabolic phenotype represented by three mouse models considered as three distinct genetic groups (a control group, a mouse model with high metabolic activity, and a mouse line with obese body weight). The IF content in different investigated standard chows with similar macronutrient profiles varied significantly (p < 0.005), leading to high mean total plasma IF levels of up to 5.8 µmol/L in juvenile and 6.7 µmol/L in adult female mice. Reproductive performance was only slightly affected; only an IF dose-dependent effect on gestation length was observed in all genetic groups, as well as an effect on pregnancy rate in obese mice. Dietary IF exposure, however, caused earlier onset of vaginal opening by 4-10 days in juvenile mice (p < 0.05), dependent on the genetic group, resulting in a slight acceleration of sexual maturation in the already precocious obese model and to a strong earlier maturation in the otherwise late-maturing sporty model, bred for high treadmill performance. Therefore, our results may help to draw the missing line between the effect of dietary secondary plant constituents, such as IFs, and metabolic phenotype on sexual development.

Keywords: diet; fertility; isoflavones; metabolism; obesity.


Conflict of interest statement

The authors declare no conflicts of interest.

Figures

Figure 1
Figure 1
Experimental study design. On the day of weaning, males and females of the non-inbred lines DUC, DUhTP, and DU6 from genetically different litters/families were each divided into three groups and fed with unautoclaved diet A, autoclaved diet S, or diet SPA. Two mating periods were performed while avoiding inbreeding. The female offspring of the second mating, corresponding to generation 2, were used for the investigations on day 21 and day 4 of pregnancy (DOP4). Abbreviations: DUC—Dummerstorf control line, DUhTP—Dummerstorf mice paternally selected for high treadmill performance, DU6—Dummerstorf mice paternally selected for high body mass, A—Altromin, S—Ssniff®, and SPA—Ssniff phytoestrogen-poor alternative.
Figure 2
Figure 2
Effects of genetic background (line) and diet on reproductive performance in female mice. Successful mating was assumed by the presence of a vaginal plug and dated as DOP1 (first day of pregnancy). (A) Pregnancy was determined by the delivery of offspring within 35 days. The pregnancy rate is shown as a percentage bar chart, with integrated numbers of successful and unsuccessful pregnancies. (B) Duration of gestation in female DUC (n ≥ 14), DUhTP (n ≥ 16), and DU6 (n ≥ 6) mice from DOP 1 to birth. Gestation is shown in days as a scatter dot plot, each dot representing one pregnant female mouse. (C) The average litter size of DUC (n ≥ 13), DUhTP (n ≥ 15), and DU6 (n ≥ 7) mice are shown as a scatter dot plot, each dot representing the size of an individual litter. (D) Average offspring birth weights are shown in a scatter dot plot; each dot represents the average body weight of an animal per litter. Colors indicate mouse strain: green—DUC, purple—DUhTP, blue—DU6. The shade of color indicates the chow group: dark—diet A, medium—diet S, and light—diet SPA. Statistical analysis for (A) pregnancy rate was performed using a two-tailed Chi-Square test and a two-way ANOVA for (BD). Significant differences are indicated as follows: * p < 0.05, *** p < 0.001, **** p < 0.0001. For abbreviations, see Figure 1.
Figure 3
Figure 3
Effects of genetic background and diet on reproductive development in juvenile female mice DUC (green), DUhTP (purple), and DU6 mice (blue) fed with diet A (dark-colored), S (medium-colored), and SPA (light-colored). The onset of puberty in young female mice was identified by determining the age [d] at vaginal opening. (A) Puberty onsets over time in the different lines and feeding groups were plotted as a staircase graph. The dashed line indicates the day when 50% of the mice in each group (median) had an open vagina. (B) Average age and (C) average body mass on the day of vaginal opening are demonstrated as dot plots. The number of animals examined (n) is given in Figure A. Statistical analysis was performed using two-way ANOVA. Significant differences between the mouse lines are indicated as **** p < 0.0001. Diet-associated differences within the lines are marked with different letters, italicized in (B) at p = 0.07. For abbreviations, see Figure 1.
Figure 4
Figure 4
Effects of genetic background and diet on reproductive development in juvenile 21-day-old DUC (first row), DUhTP (second row), and DU6 females (third row) that received diet (A) (left), S (middle), or SPA (right). The photographs show (A) the outer genitals and (B) the ovary, uterine horns, and uteri of diet A (left), S (middle), or SPA (right)-fed DU6 mice. For abbreviations, see Figure 1.
Figure 5
Figure 5
Effects of genetic background and diet on (A) relative uteri weights and (B) relative ovarian weights in adult female mice DUC (green), DUhTP (purple), and DU6 mice (blue) fed with diet A (dark-colored), S (medium-colored), and SPA (light-colored). The number of animals examined (n) is given in Table 3. Statistical analysis was performed using two-way ANOVA. Significant differences between the mouse lines are indicated as * p < 0.05, *** p < 0.001, and **** p < 0.0001. For abbreviations, see Figure 1.
Figure 6
Figure 6
Relative expression of (A) estrogen receptor 1 (Esr) and (B) estrogen receptor 2 mRNA (Esr2) in ovaries of adult DUC (green), DUhTP (purple), and DU6 (blue) females determined by RT-qPCR (n = 5 each). (C) Plasma estradiol concentration was measured by ELISA (n = 5 each). The shade of color indicates the chow group: dark—diet A, medium—diet S, and light—diet SPA. Data are visualized as scatter plots. Statistical analysis was performed using two-way ANOVA. The line effect was determined using one-way ANOVA. Significant differences are indicated as follows: * p < 0.05, ** p < 0.01, and **** p < 0.0001. For abbreviations, see Figure 1.

References

    1. Křížová L., Křešťáková V., Dadáková K., Kašparovský T. Production of Bovine Equol-Enriched Milk: A Review. Animals. 2021;11:735. doi: 10.3390/ani11030735. - DOI - PMC - PubMed
    1. Kasparovska J., Krizova L., Lochman J., Dadakova K., Kasparovsky T. Soybean-Derived Isoflavone Determination in Rumen Fluid and Milk by LC–MS-(TOF) J. Chromatogr. Sci. 2016;54:997–1003. doi: 10.1093/chromsci/bmw033. - DOI - PubMed
    1. Nørskov N.P., Givens I., Purup S., Stergiadis S. Concentrations of phytoestrogens in conventional, organic and free-range retail milk in England. Food Chem. 2019;295:1–9. doi: 10.1016/j.foodchem.2019.05.081. - DOI - PubMed
    1. Kuhnle G.G.C., Dell’Aquila C., Aspinall S.M., Runswick S.A., Mulligan A.A., Bingham S.A. Phytoestrogen Content of Foods of Animal Origin: Dairy Products, Eggs, Meat, Fish, and Seafood. J. Agric. Food Chem. 2008;56:10099–10104. doi: 10.1021/jf801344x. - DOI - PubMed
    1. Soukup S.T., Stoll D.A., Danylec N., Schoepf A., Kulling S.E., Huch M. Metabolism of daidzein and genistein by gut bacteria of the class coriobacteriia. Foods. 2021;10:2741. doi: 10.3390/foods10112741. - DOI - PMC - PubMed

LinkOut - more resources