. 2024 Aug 7;17(8):1041.
doi: 10.3390/ph17081041.

Real-World Application of a Quantitative Systems Pharmacology (QSP) Model to Predict Potassium Concentrations from Electronic Health Records: A Pilot Case towards Prescribing Monitoring of Spironolactone

Affiliations

Real-World Application of a Quantitative Systems Pharmacology (QSP) Model to Predict Potassium Concentrations from Electronic Health Records: A Pilot Case towards Prescribing Monitoring of Spironolactone

Andreas D Meid et al. Pharmaceuticals (Basel). .

Abstract

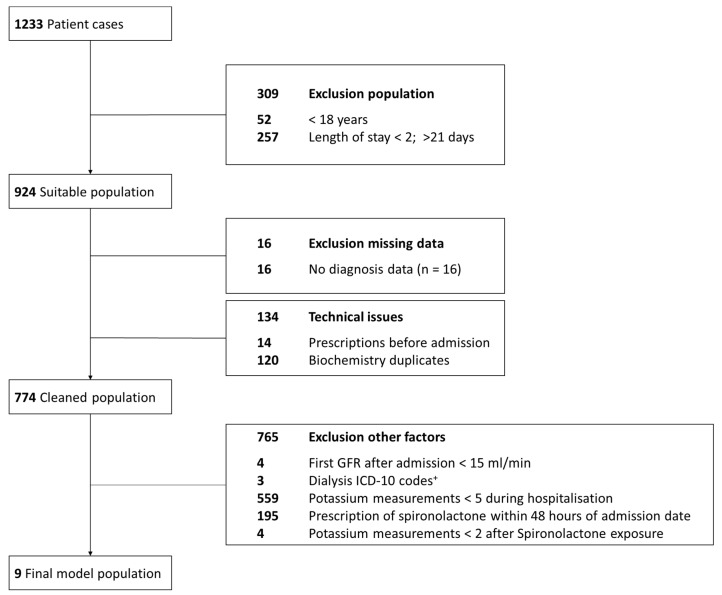
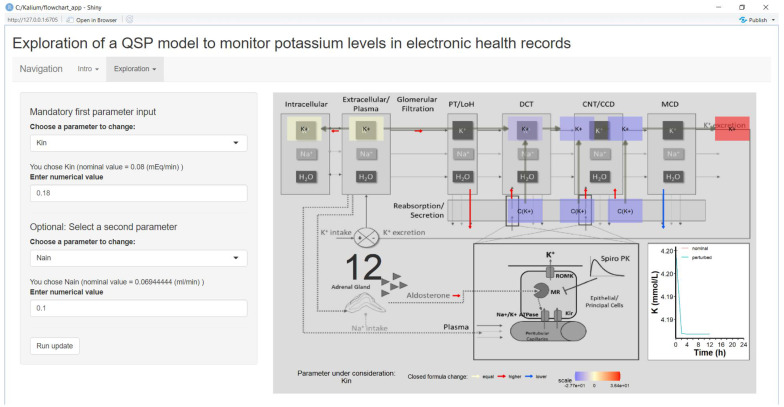
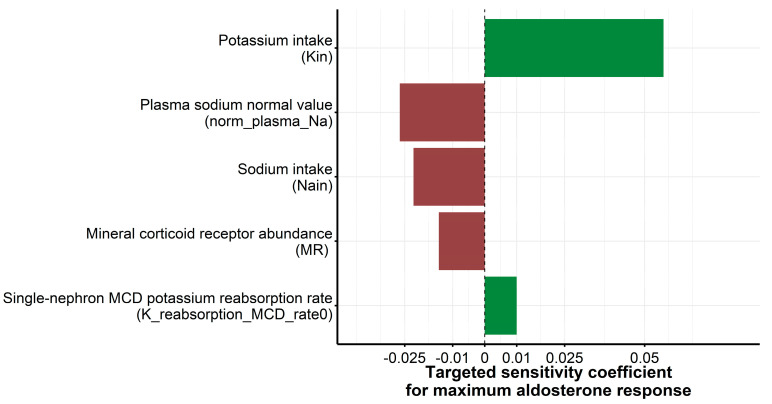
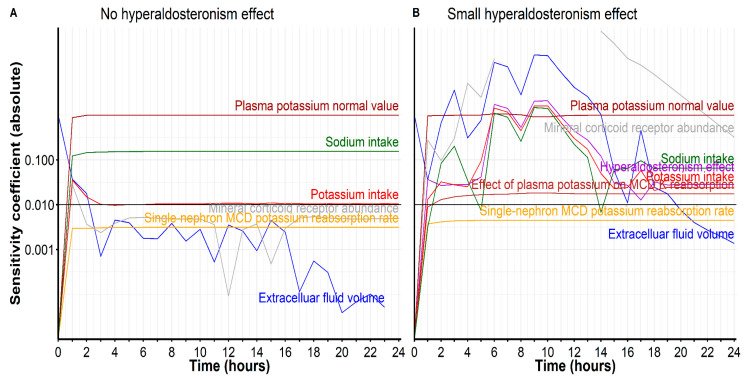
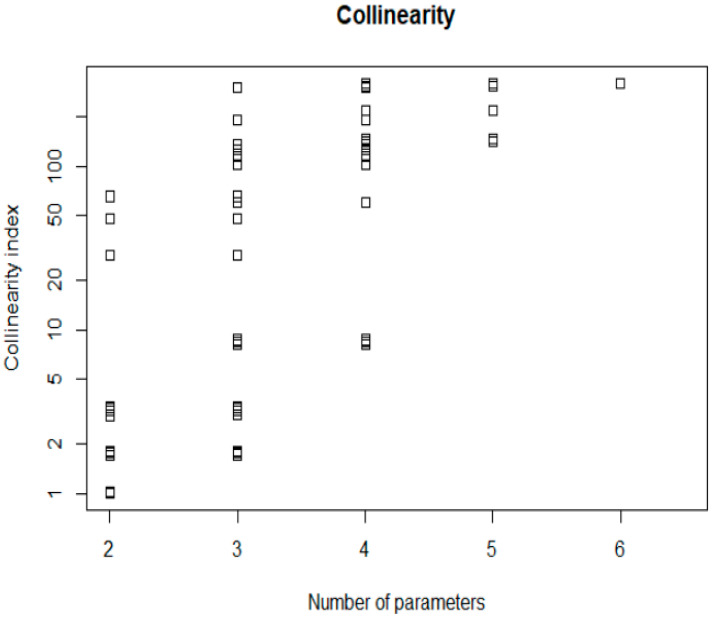
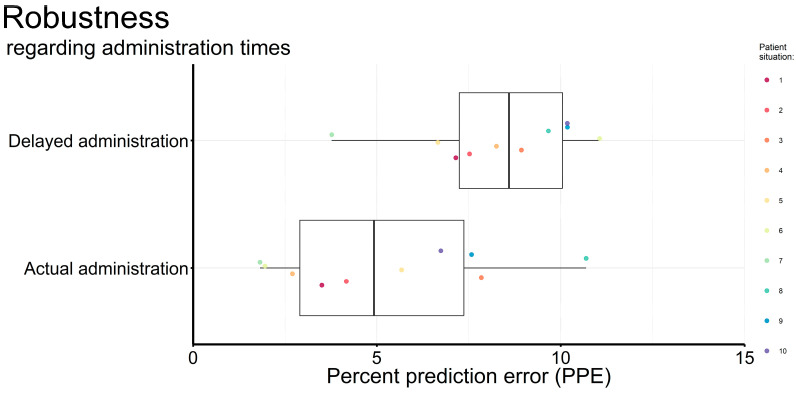
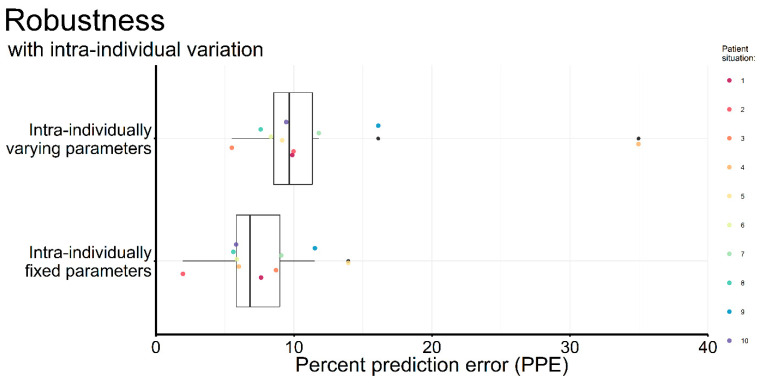
Quantitative systems pharmacology (QSP) models are rarely applied prospectively for decision-making in clinical practice. We therefore aimed to operationalize a QSP model for potas-sium homeostasis to predict potassium trajectories based on spironolactone administrations. For this purpose, we proposed a general workflow that was applied to electronic health records (EHR) from patients treated in a German tertiary care hospital. The workflow steps included model exploration, local and global sensitivity analyses (SA), identifiability analysis (IA) of model parameters, and specification of their inter-individual variability (IIV). Patient covariates, selected parameters, and IIV then defined prior information for the Bayesian a posteriori prediction of individual potassium trajectories of the following day. Following these steps, the successfully operationalized QSP model was interactively explored via a Shiny app. SA and IA yielded five influential and estimable parameters (extracellular fluid volume, hyperaldosteronism, mineral corticoid receptor abundance, potassium intake, sodium intake) for Bayesian prediction. The operationalized model was validated in nine pilot patients and showed satisfactory performance based on the (absolute) average fold error. This provides proof-of-principle for a Prescribing Monitoring of potassium concentrations in a hospital system, which could suggest preemptive clinical measures and therefore potentially avoid dangerous hyperkalemia or hypokalemia.

Keywords: electronic health records (EHR); kidney; maximum a posteriori (MAP) (Bayesian) estimation; potassium; quantitative systems pharmacology (QSP); sensitivity analysis; spironolactone.


Conflict of interest statement

The authors declare no conflicts of interest.

Figures

Figure A1
Figure A1
Patient flowchart. ICD-10: International Statistical Classification of Diseases and Related Health Problems 10th revision; GFR: Glomerular filtration rate; ICD-10 codes +: N18.5, T82.4, Y60.2, Y61.2, Y62.2, Y84.1, Z49 *, Z99.2.
Figure A2
Figure A2
Live screenshot of the Shiny app. The Supplementary Material File S1, Figures S1-1–S1-15 provides animated gif produced with various inputs from Shiny app.
Figure A3
Figure A3
Targeted sensitivity analyses investigating parameter influence on maximum aldosterone response within 24 h (original model parameter names in brackets).
Figure A4
Figure A4
Local sensitivity analysis of potentially influential parameters in a situation with no hyperaldosteronism (A) or little hyperaldosteronism (B). The parameters studied included mineral corticoid receptor abundance (denoted as MR in the original model code), potassium intake (Kin), sodium intake (Nain), plasma potassium normal value (norm_plasma_K), plasma sodium normal value (norm_plasma_Na), extracelluar fluid volume (V_ecf), single-nephron medullary collecting duct (MCD) potassium reabsorption rate (K_reabsorption_MCD_rate0), plasma potassium effect on plasma aldosterone (m_K_ALDO), aldosterone effect on luminal potassium permeability (Aldo_KSec_scale), effect of plasma potassium on MCD potassium (K) reabsorption (m_plasmaK_MCD), and hyperaldosteronism effect (hyperaldo_effect) (display is limited to those parameters whose maximum value exceed 0.00001). The nominal (starting) value of the latter is set to zero in case of no hyperaldosteronism (A) or set to 0.1 in case of little hyperaldosteronism (B).
Figure A5
Figure A5
Collinearity indices γ obtained by local identifiability analysis of models with a varying number of model parameters estimated. Among the four-parameter models, either sodium intake or hyperaldosteronism effect could be included without exceeding the conventional collinearity limit of 15; models with mineral corticoid receptor abundance, potassium intake, extracellular fluid volume, and either sodium intake or hyperaldosteronism achieved collinearity indices γ of 8.42 or 8.12, respectively.
Figure A6
Figure A6
Robustness of the proposed approach with uncertainty in administration times. In a simulation experiment, ten baseline patients were randomly chosen in terms of their model parameters, covariates, and initial values of state variables to follow them up for five hospital days where spironolactone is administered on the last four days (50 mg scheduled at 8 am). Normally distributed random fluctuations (standard deviation, SD: 0.25) were added to the administration times, as well as for the five simulated potassium values (multiplied with mean 1 and SD of 0.075) recorded at 9 am. In addition to the “normal” scenario with these random fluctuations, a scenario with systematically late administration times (half an hour later than scheduled) was considered. Percent predictive error (PPE) was determined patient by patient and these values are shown here in the form of a boxplot.
Figure A7
Figure A7
Robustness of the proposed approach with intra-individual variability in parameter estimates. In a simulation experiment, ten baseline patients were randomly chosen in terms of their model parameters, covariates, and initial values of state variables to follow them up for five hospital days where spironolactone is administered on the last four days (50 mg scheduled at 8 am, respectively). Normally distributed random fluctuations (multiplied with mean 1 and standard deviation, SD: 0.075) were added to the administration times, as well as for the five simulated potassium values (multiplied with mean 1 and SD of 0.1) recorded at 9 am. In addition to the “normal” scenario with these random fluctuations, a scenario with dynamically changing model parameters with each day was investigated (original parameter value multiplied with mean 1 and SD of 0.15. Percent predictive error (PPE) was determined patient by patient and these values are shown here in the form of a boxplot.
Figure A8
Figure A8
Steps required for implementing the QSP model in routine clinical settings. Crucial steps on the way to implementation are (model) validation in specific settings (and potentially special populations) and impact assessment preceding the actual implementation process. A strong argument would be a better performing model than available alternatives in a validation study. During pre-implementation, it is advisable to conduct stakeholder meetings, to design the alert interface and integrate with EHRs, and to develop training materials and simulation scenarios (in accordance with the FITT framework [42], among others). During the pilot phase, the alert system should be implemented in a small, controlled environment. Pilot users should be offered intensive training and support and feedback is to be gathered. At full-scale implementation, the system can be gradually expanded to other units or departments with continuously provided training and support, while also system performance and user feedback are to monitored regularly. Post-implementation then should include regular evaluations and user satisfaction surveys to facilitate iterative improvements based on collected data. Potential applications may refer to the clinical situation to monitor, while practical actions may include reminders for close patient monitoring, dosing recommendations, or alerts for increased risk of event.
Figure A9
Figure A9
Framework-based overview on how alert acceptance of medication alerts can be increased in clinical routine. Based on the experience with rule-based alerts, optimizing the acceptance of model-based alerts in clinical routines requires a comprehensive framework that addresses technological, human, and organizational factors. Already in 2013 Robert Campbell suggested 5 rights for medication alerts, indicating that the right information has to be displayed to the right person, in the right format, through the right channel, at the right time in the workflow (Campbell R 2013). When it comes to implementation, the guides project offers more information on how the implementation process should be supported, including user training and monitoring (www.guidesproject.org). Italic: Items of the guides checklist on implementing clinical decision support systems (www.guidesproject.org). CDS = Clinical decision support.
Figure 1
Figure 1
Global sensitivity analysis (SA) for pre-selected model parameters indicated by the Sobol sensitivity metric over 24 h. All parameters were allowed to fluctuate simultaneously—within physiologically plausible, predefined limits. If, for example, the upper limit for potassium intake is increased (e.g., in the case of supplementation), the sensitivity metric is much increased (where a value of 1 indicates highest impact and a value of 0.1 is still considered as sufficient impact by convention).
Figure 2
Figure 2
Uncertainty analysis for potassium trajectory simulation over 24 h. Simulations were based on a model with variations in parameters of potassium intake, sodium intake, mineral corticoid receptor abundance, extracellular fluid volume, and hyperaldosteronism effect. Monte Carlo sampling from physiological ranges of these parameters yielded simulated potassium values over time (thin line: median; dark-gray shaded area: 95% interval; light-gray shaded area: entire range within minimum and maximum values).
Figure 3
Figure 3
Observed potassium measurements (blue dots), spironolactone administrations (red dashed lines), and potassium trajectories predicted at midnight and at 11 am (black solid line). Of note, predicted baseline was derived from very first potassium measurement (defined as day zero).

Similar articles

References

    1. Helmlinger G., Sokolov V., Peskov K., Hallow K.M., Kosinsky Y., Voronova V., Chu L., Yakovleva T., Azarov I., Kaschek D., et al. Quantitative Systems Pharmacology: An Exemplar Model-Building Workflow with Applications in Cardiovascular, Metabolic, and Oncology Drug Development. CPT Pharmacomet. Syst. Pharmacol. 2019;8:380–395. doi: 10.1002/psp4.12426. - DOI - PMC - PubMed
    1. Musante C.J., Ramanujan S., Schmidt B.J., Ghobrial O.G., Lu J., Heatherington A.C. Quantitative Systems Pharmacology: A Case for Disease Models. Clin. Pharmacol. Ther. 2017;101:24–27. doi: 10.1002/cpt.528. - DOI - PMC - PubMed
    1. Visser S.A., de Alwis D.P., Kerbusch T., Stone J.A., Allerheiligen S.R. Implementation of quantitative and systems pharmacology in large pharma. CPT Pharmacomet. Syst. Pharmacol. 2014;3:e142. doi: 10.1038/psp.2014.40. - DOI - PMC - PubMed
    1. Cucurull-Sanchez L. An industry perspective on current QSP trends in drug development. J. Pharmacokinet. Pharmacodyn. :2024. doi: 10.1007/s10928-024-09905-y. in press. - DOI - PMC - PubMed
    1. Lasiter L., Tymejczyk O., Garrett-Mayer E., Baxi S., Belli A.J., Boyd M., Christian J.B., Cohen A.B., Espirito J.L., Hansen E., et al. Real-world Overall Survival Using Oncology Electronic Health Record Data: Friends of Cancer Research Pilot. Clin. Pharmacol. Ther. 2022;111:444–454. doi: 10.1002/cpt.2443. - DOI - PMC - PubMed

LinkOut - more resources