

An Investigation on the Relationship between Dust Emission and Air Flow as Well as Particle Size with a Novel Containment Two-Chamber Setup
- PMID: 39204433
- PMCID: PMC11359288
- DOI: 10.3390/pharmaceutics16081088
An Investigation on the Relationship between Dust Emission and Air Flow as Well as Particle Size with a Novel Containment Two-Chamber Setup
Abstract
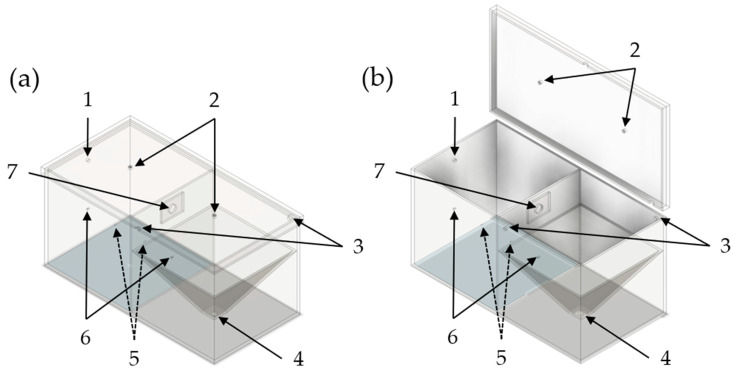
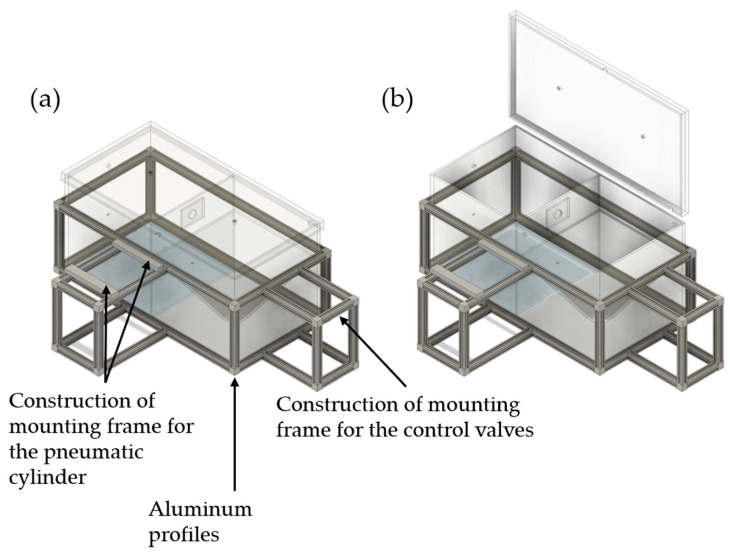
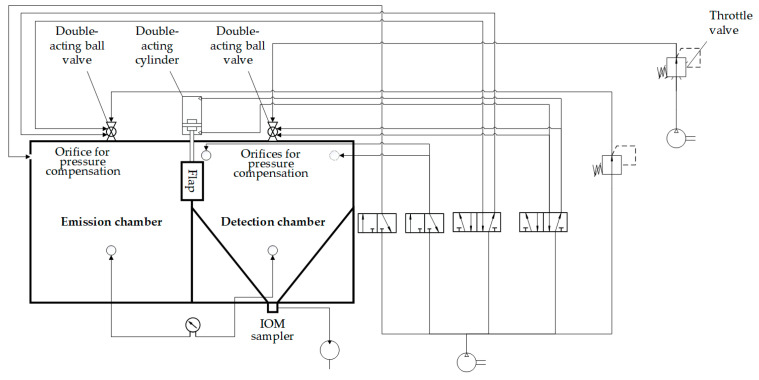
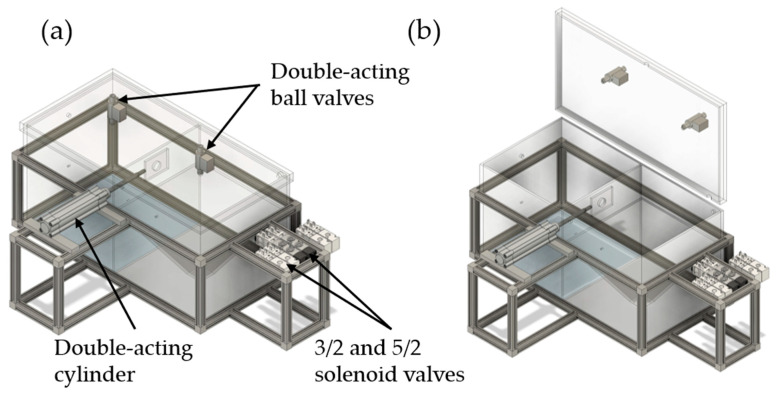
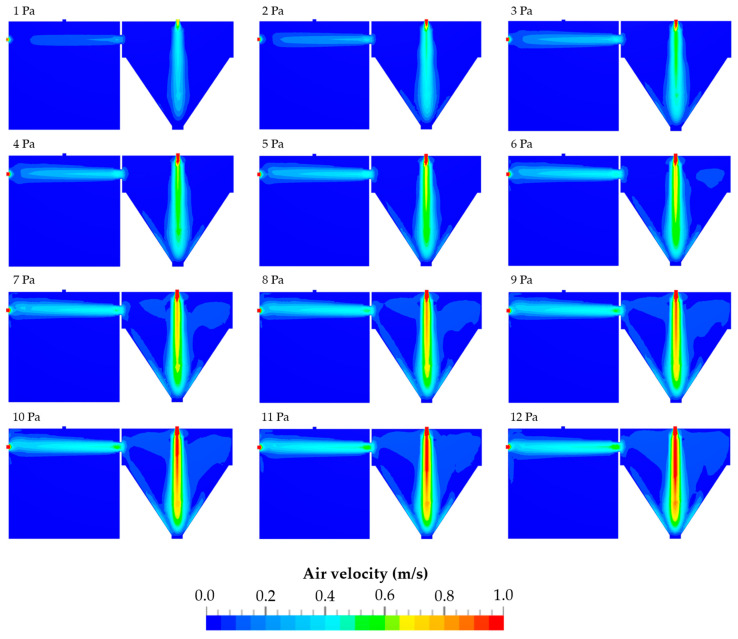
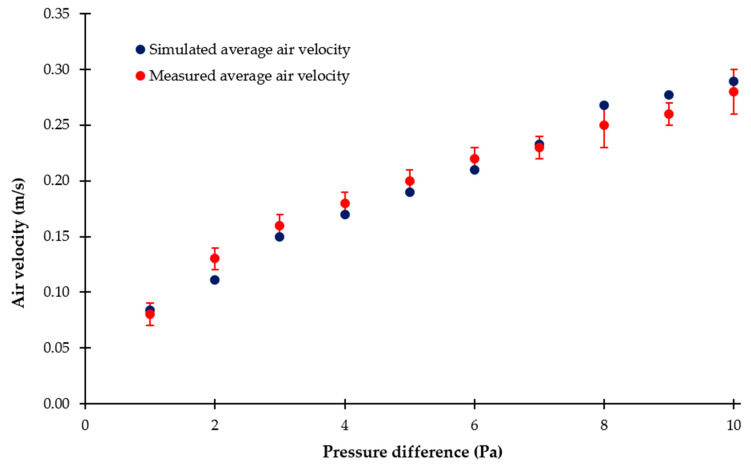
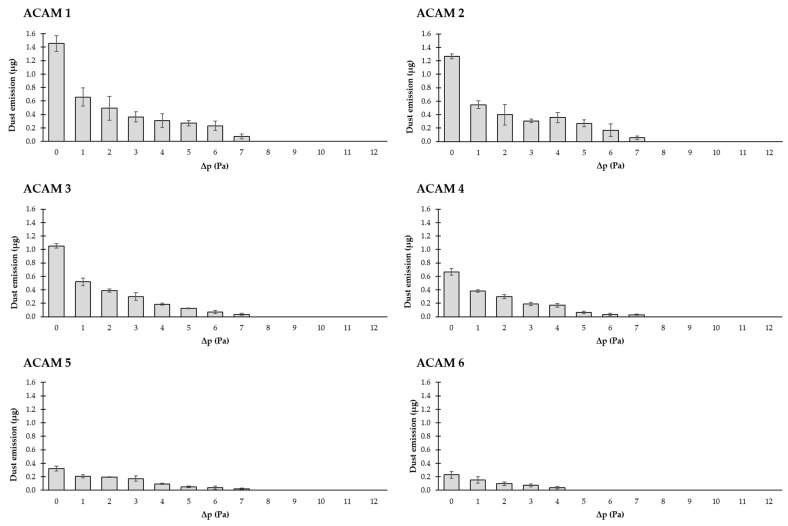
In the present study with a novel two-chamber setup (TCS) for dustiness investigations, the relationship between pressure differences as well as air velocities and the resulting dust emissions is investigated. The dust emissions of six particle size fractions of acetaminophen at pressure differences between 0 and 12 Pa are examined. The results show that both simulated and measured air velocities increase with increasing pressure difference. Dust emissions decrease significantly with increasing pressure difference and air velocity. Fine particles cause higher dust emissions than coarse particles. A high goodness of fit is obtained with exponential and quadratic functions to describe the relationship between pressure difference and dust emission, indicating that even moderate increases in pressure may lead to a reduction in the emission. Average air velocities within the TCS simulated with Computational Fluid Dynamics are between 0.09 and 0.37 m/s, whereas those measured experimentally are between 0.09 and 0.41 m/s, both ranges corresponding to the recommended values for effective particle separation in containment systems. These results underline the ability of the novel TCS to control pressure and airflow, which is essential for reliable dust emission measurements and thus provide support for further scientific and industrial applications.
Keywords: HPAPI; containment; dust emissions; dustiness; flow barrier; two-chamber setup.
Conflict of interest statement
Authors Martin Schöler and Jonas Brügmann were employed by the company Fett Compacting GmbH. The remaining authors declare that the research was conducted in the absence of any commercial or financial relationships that could be construed as a potential conflict of interest.
Figures
References
-
- International Society for Pharmaceutical Engineering (ISPE) ISPE D/A/CH Affiliate: Containment Manual. ISPE D/A/CH; Offenbach, Germany: 2017.
-
- Becker J., Pohlmann T. Development and Implementation of a Large-Scale HPAPI Manufacturing Process. Chim. Oggi-Chem. Today. 2019;35:20–24.
-
- Wollowitz S. Managing High-Potency Active Pharmaceutical Ingredients—A Drug Sponsor’s Guide. Drug Dev. Res. 2010;71:420–428. doi: 10.1002/ddr.20385. - DOI
LinkOut - more resources
Full Text Sources
