

A First Approach for the In Vitro Cultivation, Storage, and DNA Barcoding of the Endangered Endemic Species Euonymus koopmannii
- PMID: 39204610
- PMCID: PMC11359811
- DOI: 10.3390/plants13162174
A First Approach for the In Vitro Cultivation, Storage, and DNA Barcoding of the Endangered Endemic Species Euonymus koopmannii
Abstract
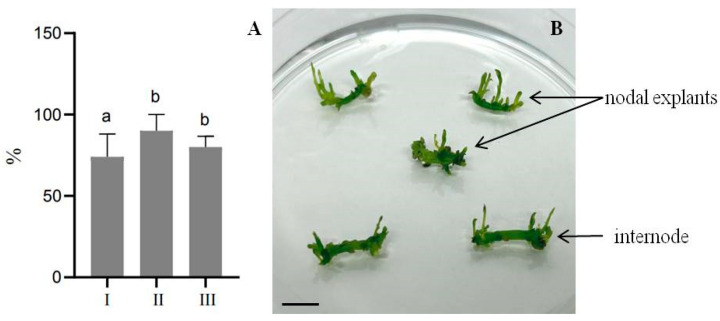
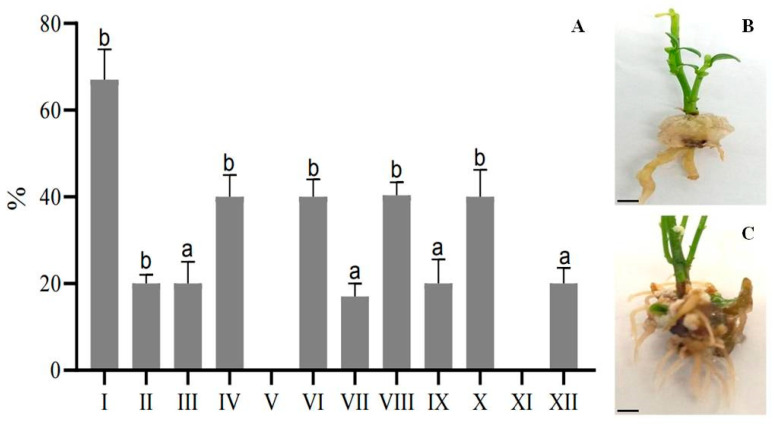
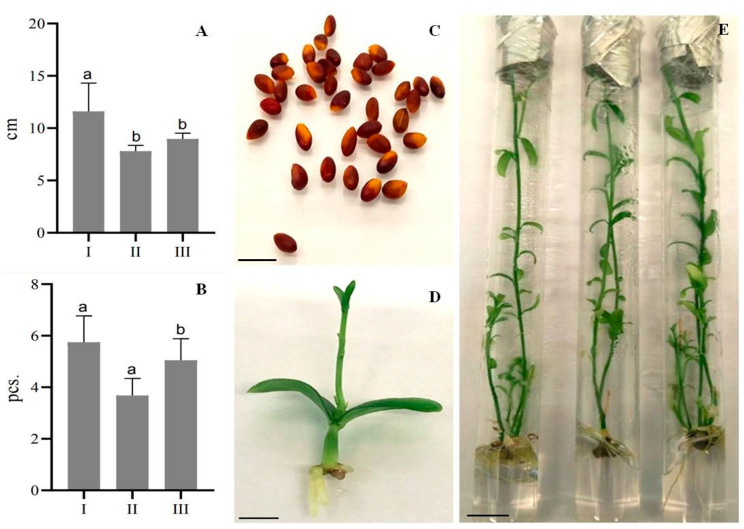
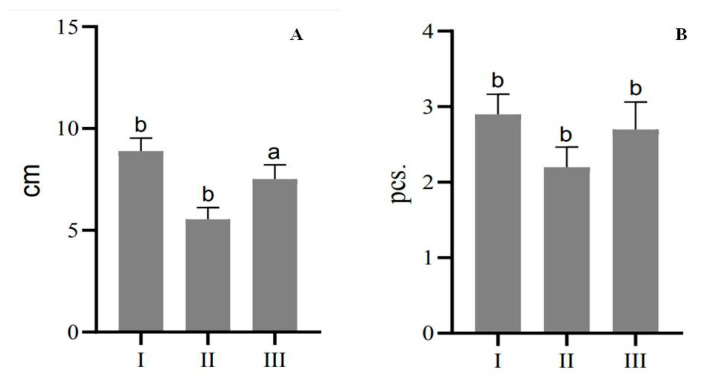
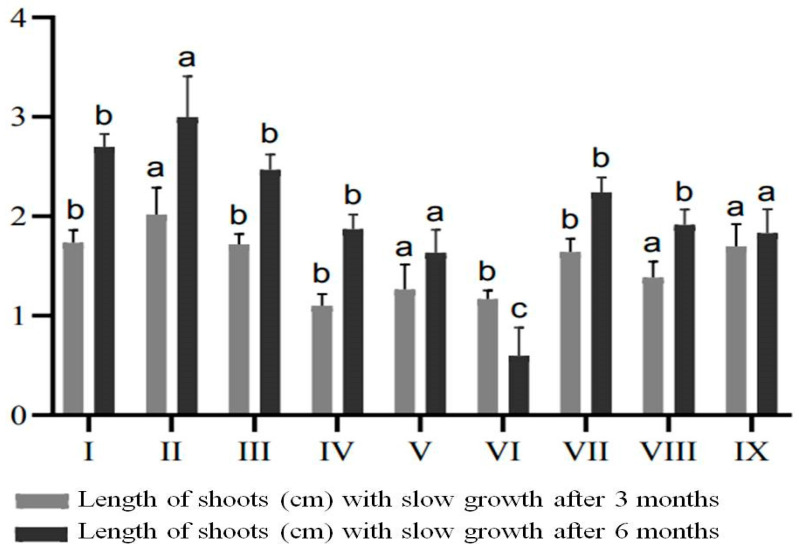
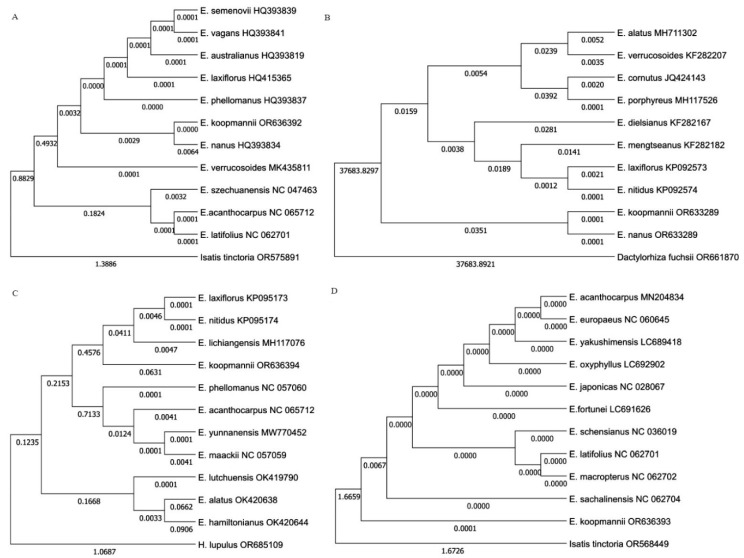
Euonymus koopmannii is a rare and protected species in Kazakhstan, valued for its ecological role in soil stabilization and its ornamental properties. This study presents the first use of micropropagation and phylogenetic analysis for the endemic plant E. koopmannii. Seedlings of E. koopmannii proved to be more effective than internodes as primary explants for plant micropropagation of in vitro culture, with a multiplication coefficient of 28.5 from seedlings and 6.1 from internodes. On MSR I medium supplemented with 0.5 mg/L IBA and 0.05 mg/L IAA, a higher success rate of 67% was achieved for root formation of test tube-grown E. koopmannii plants. Using mannitol as an osmotic agent at a concentration of 8 mg/L prolonged the storage time of E. koopmannii under slow growth conditions when compared to CCC and abscisic acid. Phylogenetic relationships and species identification were analyzed using four DNA-barcoding markers, comparing E. koopmannii with species from NCBI. All candidate barcoding markers showed sufficient levels of interspecific genetic variation among Euonymus species. In addition, ITS region and rbcL gene sequences effectively distinguished E. koopmannii from other species. These results provide fundamental information that will be valuable for future biotechnological and molecular studies.
Keywords: DNA-barcoding; Euonymus koopmannii; direct regeneration; micropropagation; slow growth storage.
Conflict of interest statement
The authors declare no conflicts of interest.
Figures
References
-
- Li Y., Dong Y., Liu Y., Yu X., Yang M., Huang Y. Comparative Analyses of Euonymus Chloroplast Genomes: Genetic Structure, Screening for Loci with Suitable Polymorphism, Positive Selection Genes, and Phylogenetic Relationships within Celastrineae. Front. Plant Sci. 2021;11:593984. doi: 10.3389/fpls.2020.593984. - DOI - PMC - PubMed
-
- Li Y.-N., Xie L., Li J., Zhang Z. Phylogeny of Euonymus L. inferred from molecular and morphological data. J. Syst. Evol. 2013;52:1–12. doi: 10.1111/jse.12068. - DOI
-
- Wittmack L. Garten-Zeitung. Volume 2 P. Parey; Berlin, Germany: 1883.
-
- Shukurov E.D. Atlas of Biological Diversity of the Western Tien Shan Book. Bismarck LLC; Bishkek, Kyrgyzstan: 2005. Central Asian transboundary project for the conservation of biodiversity of the Western Tien Shan. (In Russian)
-
- Ivashchenko A.A. Reserves and National Parks of Kazakhstan. Almatykitap; Almaty, Kazakhstan: 2006. p. 284. (In Russian)
Grants and funding
LinkOut - more resources
Full Text Sources
