. 2024 Aug 21;24(16):5402.
doi: 10.3390/s24165402.

Bedside Magnetocardiography with a Scalar Sensor Array

Affiliations

Bedside Magnetocardiography with a Scalar Sensor Array

Geoffrey Z Iwata et al. Sensors (Basel). .

Abstract

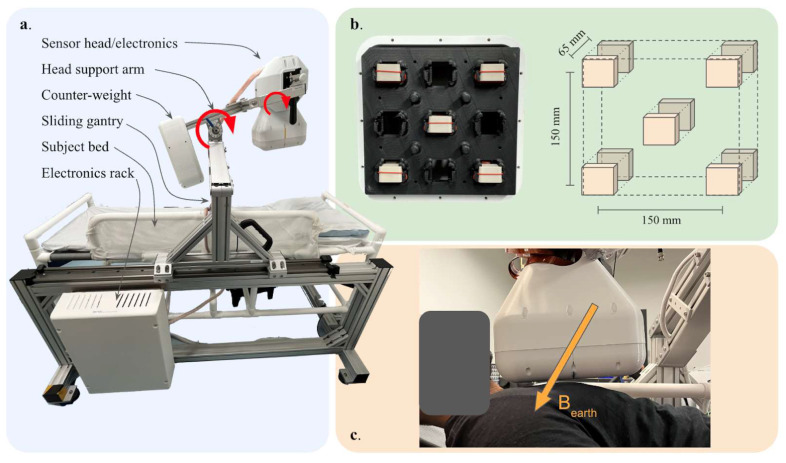
Decades of research have shown that magnetocardiography (MCG) has the potential to improve cardiac care decisions. However, sensor and system limitations have prevented its widespread adoption in clinical practice. We report an MCG system built around an array of scalar, optically pumped magnetometers (OPMs) that effectively rejects ambient magnetic interference without magnetic shielding. We successfully used this system, in conjunction with custom hardware and noise rejection algorithms, to record magneto-cardiograms and functional magnetic field maps from 30 volunteers in a regular downtown office environment. This demonstrates the technical feasibility of deploying our device architecture at the point-of-care, a key step in making MCG usable in real-world settings.

Keywords: magnetocardiography; medical devices; quantum sensors.


Conflict of interest statement

All authors were employed by SandboxAQ for the duration of the work presented.

Figures

Figure 1
Figure 1
Device overview. (a). Photograph of MCG system with critical components indicated. The sensor head and arm can pivot about the points indicated by the circulating red arrows, allowing an operator to position the device optimally over a participant’s chest. Sensors and their control modules are housed within the sensor head assembly, while the data acquisition electronics and other supporting components are placed in the electronics rack indicated at the bottom left. The participant bed is an MRI-compatible hospital-grade bed constructed from non-magnetic PVC. The gantry support is assembled from extruded aluminum. (b). (left) Photograph of the bottom layer of sensors within the sensor housing. The nonmagnetic, 3-D printed sensor mount can accommodate up to 9 sensors per layer. (right) Schematic of both sensor layers indicating dimensions and gradiometric baseline. (c). Photograph of a participant with the sensor array positioned for a measurement. The approximate direction of the Earth’s magnetic field is indicated with the arrow labelled Bearth.
Figure 2
Figure 2
Typical power spectral density (PSD) plot of the unshielded system. Magnetometer signals are shown in grey dashed lines. Filtered gradiometer signals are shown in colors. The PSD is calculated via Welch’s method with a Hann window and normalized by the noise bandwidth. Low frequency environmental noise and 60 Hz line noise dominate the magnetometer signal. These are effectively reduced by bandpass filtering, notch filtering and gradiometry, as described in Section 2.2.
Figure 3
Figure 3
Signal processing pipeline and example data. (a). Signal processing pipeline flowchart showing processing steps for time-series data acquired from a multi-channel sensor array. After data are loaded from storage, channel synchronization is performed by aligning common signals that were injected in all channels, including the ECG, which is up-sampled to optimize trigger timing. Filtering follows, which consists of a 60 Hz IRR notch filter and 0.5–45 Hz bandpass using a bi-directional Butterworth digital filter. Then bad channels and segments are identified in and removed from the data using automatic power thresholding and basic data checks. The noise rejection step consists of a combination of gradiometry and Principal Component Analysis (PCA), where signal components that have high noise character are removed. MCG epochs are identified using ECG as a trigger, with automated epoch rejection based on signal power and timing criteria. Finally, epochs are averaged together, and the epoch-average is visualized. (b). Epoch-average for each gradiometer channel is displayed based on approximate relative positions over the participant’s chest. The upper right sensor and lower left sensor show inverted features. (c). (Upper) Epoch-average of all five gradiometric signals overlayed. Inset shows SNR scaling as a function of the number of epochs used to average. Each line corresponds to a different ordering of averaging. SNR > 10 can be achieved with 60 s of averaging and reaches 18 after 214 averages. (Lower) Corresponding ECG Lead I trace acquired simultaneously with the MCG data.
Figure 4
Figure 4
Summary of SNRmax of the heartbeat averages, separated by experimental condition for all participants. N_participants = 23, N_observations = 92. Recording length = 300 s. The mean number of heartbeats averaged together for each participant is 191, with a standard deviation of 41. Considering the SNR scaling with number of heartbeats shows that differences in the number of heartbeats averaged cannot account for the spread in SNR values. Wings of each violin plot represent an empirical distribution of the participant results, computed by kernel density estimation (KDE). Mean SNR is indicated for each experimental condition with a gold dot, with the asymmetric standard deviation of the participant level distribution from the mean reported with thick black lines. Mixed modeling comparisons across condition-sorted datasets showed that there were no statistically significant differences in the distributions for each condition, indicating that the controlled factors in the study did not meaningfully affect the SNR.

References

    1. Murzin D., Mapps D.J., Levada K., Belyaev V., Omelyanchik A., Panina L., Rodionova V. Ultrasensitive Magnetic Field Sensors for Biomedical Applications. Sensors. 2020;20:1569. doi: 10.3390/s20061569. - DOI - PMC - PubMed
    1. Li Y., Che Z., Quan W., Yuan R., Shen Y., Liu Z., Wang W., Jin H., Lu G. Diagnostic outcomes of magnetocardiography in patients with coronary artery disease. Int. J. Clin. Exp. Med. 2015;8:2441–2446. - PMC - PubMed
    1. Khan M.A., Sun J., Li B., Przybysz A., Kosel J. Magnetic sensors-A review and recent technologies. Eng. Res. Express. 2021;3:022005. doi: 10.1088/2631-8695/ac0838. - DOI
    1. Agarwal R., Saini A., Alyousef T., Umscheid C.A. Magnetocardiography for the diagnosis of coronary artery disease: A systematic review and meta-analysis. Ann Noninvasive Electrocardiol. 2012;17:291–298. doi: 10.1111/j.1542-474X.2012.00538.x. - DOI - PMC - PubMed
    1. Kwon H., Kim K., Lee Y.H., Kim J.M., Yu K.K., Chung N., Ko Y.G. Non-Invasive Magnetocardiography for the Early Diagnosis of Coronary Artery Disease in Patients Presenting with Acute Chest Pain. Circ. J. 2010;74:1424–1430. doi: 10.1253/circj.CJ-09-0975. - DOI - PubMed

Grants and funding

LinkOut - more resources