Randomized Controlled Trial
. 2024 Jan-Dec;16(1):2390176.
doi: 10.1080/19490976.2024.2390176. Epub 2024 Aug 29.

Lactobacillus acidophilus ameliorates cholestatic liver injury through inhibiting bile acid synthesis and promoting bile acid excretion

Affiliations
Randomized Controlled Trial

Lactobacillus acidophilus ameliorates cholestatic liver injury through inhibiting bile acid synthesis and promoting bile acid excretion

Lingyi Wu et al. Gut Microbes. 2024 Jan-Dec.

Abstract

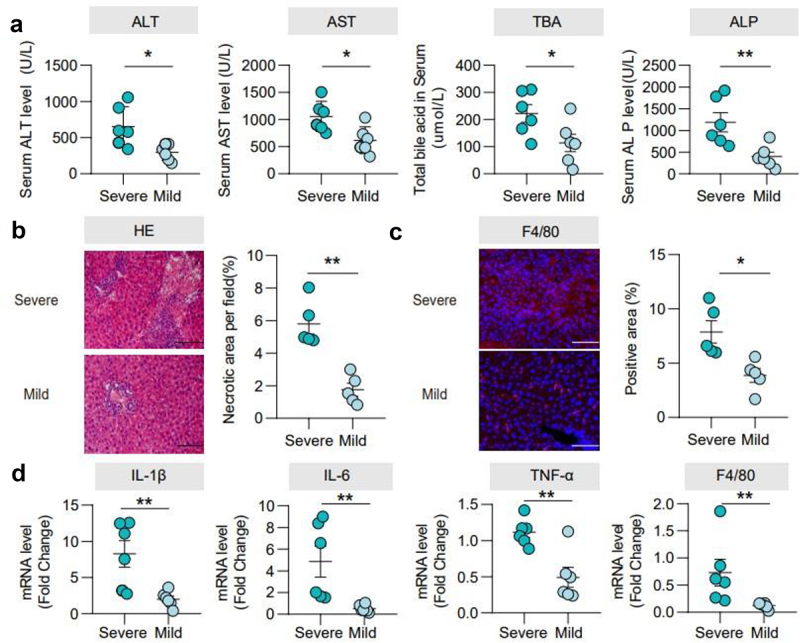
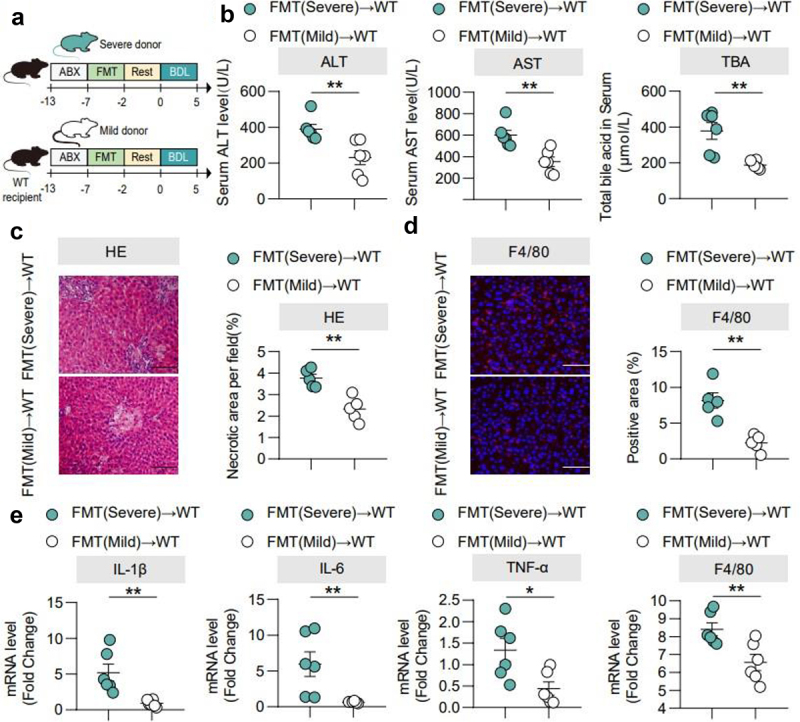
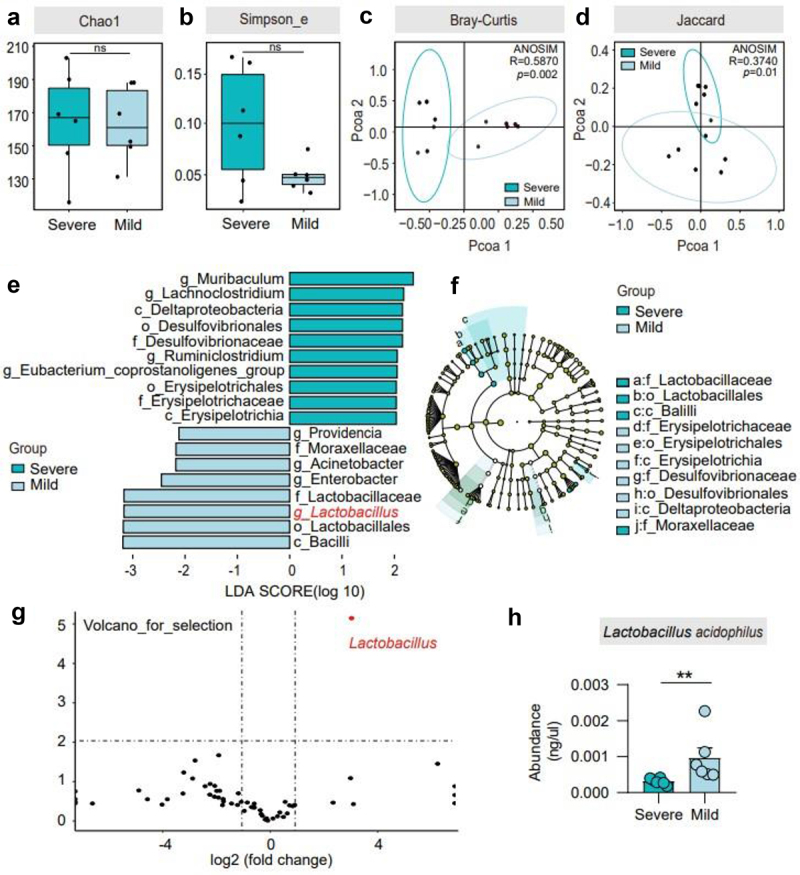
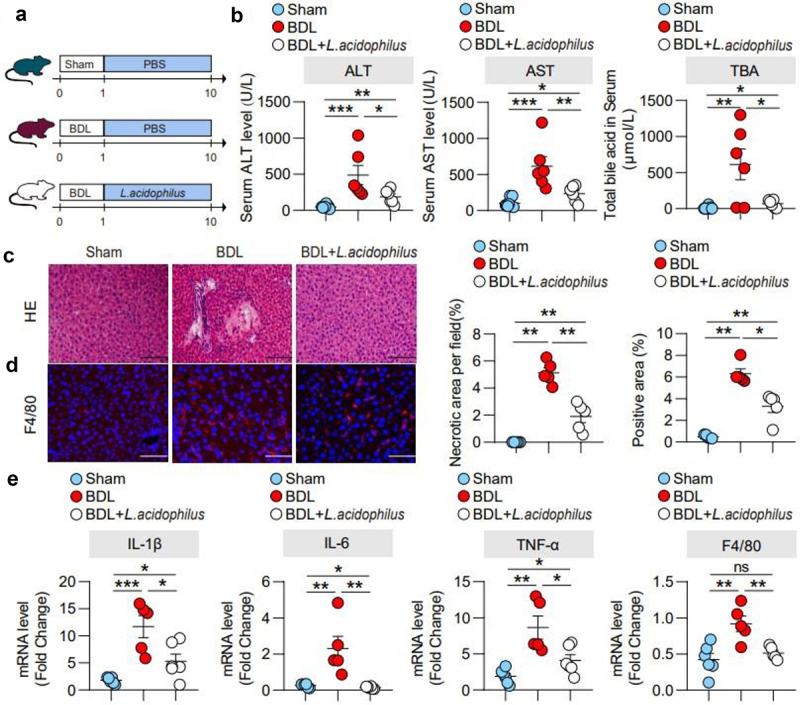
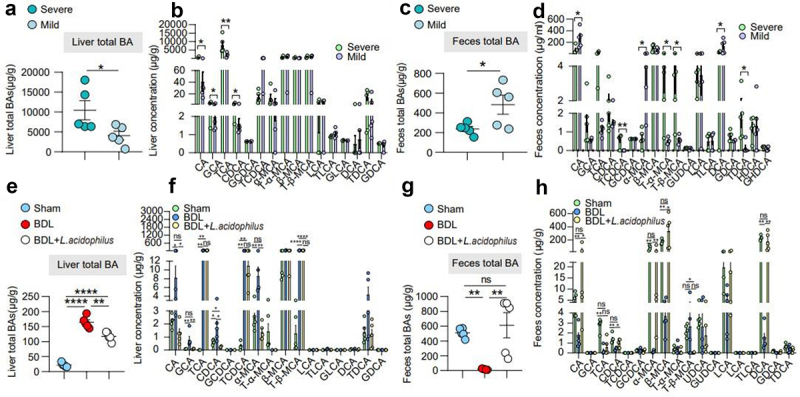
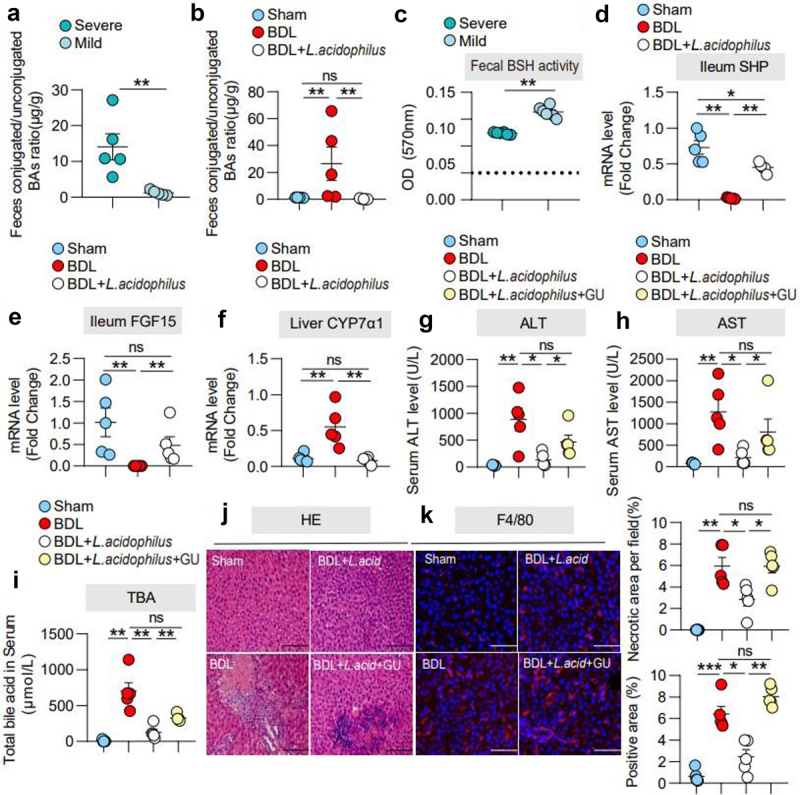
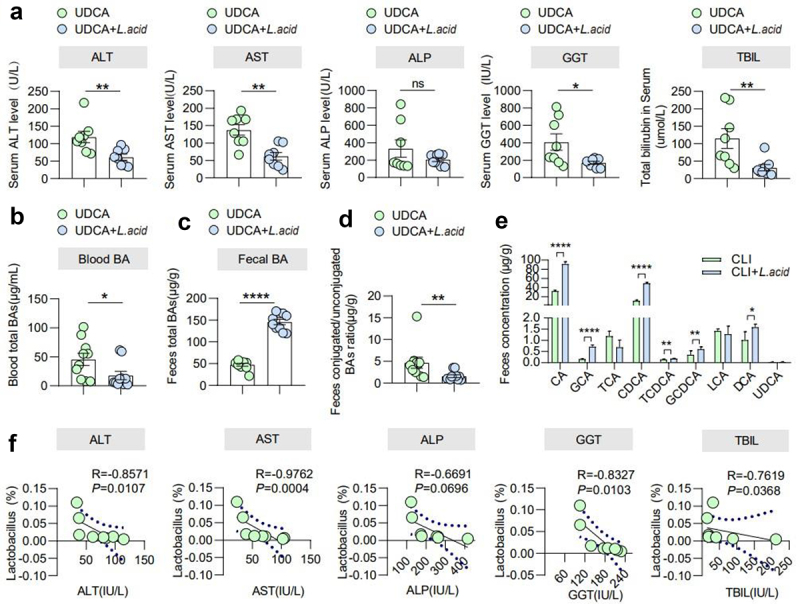
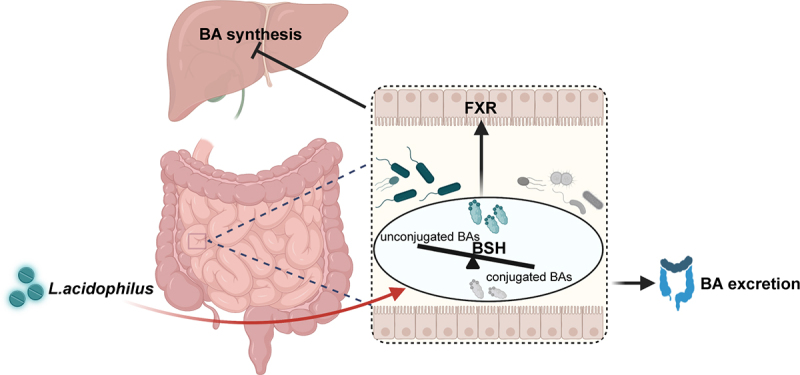
Gut microbiota dysbiosis is involved in cholestatic liver diseases. However, the mechanisms remain to be elucidated. The purpose of this study was to examine the effects and mechanisms of Lactobacillus acidophilus (L. acidophilus) on cholestatic liver injury in both animals and humans. Bile duct ligation (BDL) was performed to mimic cholestatic liver injury in mice and serum liver function was tested. Gut microbiota were analyzed by 16S rRNA sequencing. Fecal bacteria transplantation (FMT) was used to evaluate the role of gut microbiota in cholestasis. Bile acids (BAs) profiles were analyzed by targeted metabolomics. Effects of L. acidophilus in cholestatic patients were evaluated by a randomized controlled clinical trial (NO: ChiCTR2200063330). BDL induced different severity of liver injury, which was associated with gut microbiota. 16S rRNA sequencing of feces confirmed the gut flora differences between groups, of which L. acidophilus was the most distinguished genus. Administration of L. acidophilus after BDL significantly attenuated hepatic injury in mice, decreased liver total BAs and increased fecal total BAs. Furthermore, after L. acidophilus treatment, inhibition of hepatic Cholesterol 7α-hydroxylase (CYP7α1), restored ileum Fibroblast growth factor 15 (FGF15) and Small heterodimer partner (SHP) accounted for BAs synthesis decrease, whereas enhanced BAs excretion was attributed to the increase of unconjugated BAs by enriched bile salt hydrolase (BSH) enzymes in feces. Similarly, in cholestasis patients, supplementation of L. acidophilus promoted the recovery of liver function and negatively correlated with liver function indicators, possibly in relationship with the changes in BAs profiles and gut microbiota composition. L. acidophilus treatment ameliorates cholestatic liver injury through inhibited hepatic BAs synthesis and enhances fecal BAs excretion.

Keywords: Cholestatic liver injury; Lactobacillus; gut microbiota.


Conflict of interest statement

No potential conflict of interest was reported by the authors.

Figures

Figure 1.
Figure 1.
Characterization of mice with BDL-induced injury. (a). Serum ALT, AST, TBA, and ALP levels. (b). Representative images of the liver stained with hematoxylin and eosin (100 μm) and the quantification of the liver cell necrotic area. (c). Representative images of immunofluorescence analyses of F4/80 (200μm) and the quantification of the positive area. (d). Hepatic mRNA expression of inflammation-related genes. n = 6 individuals/group. Data are expressed as the mean ± SEM. Two-tailed Student’s t-test or Mann–Whitney test. Columns with different letters differ significantly (P < 0.05). *P < 0.05, **P < 0.01. Scale bar: 100 μm or 200 μm.
Figure 2.
Figure 2.
The severity of cholestatic liver injury depends on the transmission of gut microbiota. (a). FMT experimental design: mice received vancomycin (100 mg/kg), neomycin sulfate (200 mg/kg), metronidazole (200 mg/kg), and ampicillin (200 mg/kg) intragastrically once daily for 5 days to deplete the gut microbiota, in which feces sample derived from BDL-severe and BDL-mild and sacrificed at 5 days after BDL. (b). Serum ALT, AST, and TBA levels. (c). Representative images of liver stained with hematoxylin and eosin (100 μm) and quantification of liver cell necrosis area. (d). Representative images of immunofluorescence analyses of F4/80 (200 μm) and the quantification of the positive area. (e). Hepatic mRNA expression of inflammation-related genes. n = 6 individuals/group. Data are expressed as the mean ± SEM. Two-tailed Student’s t-test or Mann–Whitney test. Columns with different letters differ significantly (P < 0.05). *P < 0.05, **P < 0.01. Scale bar: 100 μm or 200 μm. Abbreviations: WT, wild type.
Figure 3.
Figure 3.
Different BDL groups showed differences in gut microbiota. (a)-(b). Alpha diversity in the two groups, according to the Chao1 and Simpson_e diversity indices. (c)-(d). Bray–Curtis and Jaccard distances from the two groups were determined by unweighted UniFrac PCoA (principal coordinates analysis) of the gut microbiota. (e)-(f). Cladogram using the LDA model results for the bacterial hierarchy. Differences were represented by the color of the most abundant class. The diameter of each circle is proportional to the abundance of the taxon. Each ring represents the next lower taxonomic level. LEfSe analysis indicated genera strikingly different among the gut microbiota. (g). Volcano plot displaying the relative abundance distribution of microbial OTUs. X-axis, log2 relative abundance; Y-axis, microbial OTU%. Each symbol represents one mouse or bacterial taxa. (h). The abundance of L. acidophilus in the severe and mild groups is shown. n = 6 individuals/group. For (c and d), differences in data were assessed by the ANOSIM test. Exact p levels are provided for all. Two-tailed Student’s t-test. Columns with different letters differ significantly (P < 0.05). * P < 0.05, ** P < 0.01. Abbreviations: OTUs, operational taxonomy units; ANOSIM, analysis of similarities; LDA, linear discriminant analysis; LEfSe, linear discriminant analysis effect size; PCoA, principal coordinate analysis.
Figure 4.
Figure 4.
Administration of L. acidophilus ameliorated cholestatic liver injury in cholestasis mice. (a). BDL was completed after one week of adaptive feeding, and L. acidophilus was administered for 9 days before sacrifice. (b). Serum ALT, AST and TBA levels. (c). Representative images of liver stained with hematoxylin and eosin (100 μm) and the quantification of the liver cell necrotic area. (d). Representative images of immunofluorescence analyses of F4/80 (200 μm) and the quantification of the positive area. (e). Hepatic mRNA expression of inflammation-related genes. n = 6 (sham), n = 5 (BDL), n = 6 (BDL+L. acidophilus) individuals/group. Data are expressed as the mean ± SEM. Two-tailed Student’s t-test or Mann–Whitney test. Columns with different letters differ significantly (p < 0.05). *p < 0.05, **p < 0.01. Scale bar: 100 μm or 200 μm. Abbreviations: L. acidophilus, Lactobacillus acidophilus.
Figure 5.
Figure 5.
L. acidophilus inhibited BAs synthesis and enhanced BAs excretion. (a)-(b). Liver BAs classes and BAs profile of mice with severe and mild injury. n = 6 individuals/group. (c)-(d). Feces BAs classes and BAs profile of mice with severe and mild injury. n = 6 individuals/group. (e)-(f). Liver BAs classes and BAs profile of L. acidophilus treatment. n = 6/5/6, respectively. (g)-(h). Feces BAs classes and BAs profile of L. acidophilus treatment. n = 6/5/6, respectively. Data are expressed as the mean ± SEM. Two-tailed Student’s t-test or Mann–Whitney test. Columns with different letters differ significantly (P < 0.05). * P < 0.05, ** P < 0.01, *** P < 0.001, **** P < 0.0001. Abbreviations: BAs, bile acids.
Figure 6.
Figure 6.
L. acidophilus treatment ameliorated cholestatic liver injury is required FXR signaling. (a). The ratio of conjugated/unconjugated BAs in feces in severe and mild groups. n = 5 individuals/group. (b). The ratio of conjugated/unconjugated BAs in feces in the sham, BDL, and BDL+ L. acidophilus groups. n = 5 individuals/group. (c). Fecal BSH enzyme activity in the severe and mild groups. n = 5 individuals/group. (d)- (e). Ileum mRNA expression of SHP and FGF15. (f). Liver mRNA expression of CYP7α1. n = 5 individuals/group. (g)-(i). Serum ALT, AST and TBA levels. (j). Representative images of liver stained with hematoxylin and eosin (100 μm) and the quantification of the liver cell necrotic area. (k). Representative images of immunofluorescence analyses of F4/80 (200 μm) and the quantification of the positive area. Data are expressed as the mean ± SEM. Two-tailed Student’s t-test or Mann–Whitney test. Columns with different letters differ significantly (P < 0.05). * P < 0.05, ** P < 0.01. *** P < 0.001. Scale bar: 100 μm or 200 μm. Abbreviations: FXR, farnesoid X receptor; L. acidophilus, Lactobacillus acidophilus; GU, (z)-guggulsterone.
Figure 7.
Figure 7.
L. acidophilus promoted recovery in cholestatic liver injury patients. (a). Blood liver features include ALT, AST, ALP, GGT, and TBIL levels in the UDCA and UDCA+L. acid groups. n = 8 individuals/group. (b). Blood total BAs in the UDCA and UDCA+L. acid groups. n = 10 individuals/group. (c). Fecal BAs in the UDCA and UDCA+L. acid groups. n = 10 individuals/group. (d). The ratio of conjugated/unconjugated BAs in feces in the UDCA and UDCA+L. acid groups. n = 10 individuals/group. (e). Fecal BAs profile in the UDCA and UDCA+L. acid groups. n = 10 individuals/group. (f). The correlations between the abundance of Lactobacillus and ALT, AST, ALP, GGT, and TBIL levels were analyzed using Spearman’s correlation. n = 8 individuals/group. Data are expressed as the mean ± SEM. Two-tailed Student’s t-test or Mann–Whitney test. Columns with different letters differ significantly (P < 0.05). * P < 0.05, ** P < 0.01, *** P < 0.001, **** P < 0.0001.
Figure 8.
Figure 8.
The schematic diagram of L. acidophilus ameliorating cholestatic liver injury. L. acidophilus inhibits hepatic BAs synthesis by activating intestinal FXR signaling, and increases unconjugated BAs by enriched BSH enzymes to enhance the BAs excretion, which could attenuate cholestatic liver injury.

References

    1. Kwan SY, Jiao J, Joon A, Wei P, Petty LE, Below JE, Daniel CR, Wu X, Zhang J, Jenq RR. et al. Gut microbiome features associated with liver fibrosis in Hispanics, a population at high risk for fatty liver disease. Hepatology. 2022;75(4):955–17. doi: 10.1002/hep.32197. - DOI - PMC - PubMed
    1. Trebicka J, Macnaughtan J, Schnabl B, Shawcross DL, Bajaj JS. The microbiota in cirrhosis and its role in hepatic decompensation. J Hepatol. 2021;75(Suppl 1):S67–S81. doi: 10.1016/j.jhep.2020.11.013. - DOI - PMC - PubMed
    1. Jansen PL, Ghallab A, Vartak N, Reif R, Schaap FG, Hampe J, Hengstler JG. The ascending pathophysiology of cholestatic liver disease. Hepatology. 2017;65(2):722–738. doi: 10.1002/hep.28965. - DOI - PubMed
    1. Dhillon AK, Kummen M, Troseid M, Åkra S, Liaskou E, Moum B, Vesterhus M, Karlsen TH, Seljeflot I, Hov JR. et al. Circulating markers of gut barrier function associated with disease severity in primary sclerosing cholangitis. Liver Int. 2019;39(2):371–381. doi: 10.1111/liv.13979. - DOI - PubMed
    1. LaRusso NF, Tabibian JH, O’Hara SP. Role of the intestinal microbiome in cholestatic liver disease. Dig Dis. 2017;35(3):166–168. doi: 10.1159/000450906. - DOI - PMC - PubMed

Publication types

MeSH terms

Substances

LinkOut - more resources