. 2024 Aug 8:28:101182.
doi: 10.1016/j.mtbio.2024.101182. eCollection 2024 Oct.

Long noncoding RNA MALAT1 mediates fibrous topography-driven pathologic calcification through trans-differentiation of myoblasts

Affiliations

Long noncoding RNA MALAT1 mediates fibrous topography-driven pathologic calcification through trans-differentiation of myoblasts

Woo-Jin Kim et al. Mater Today Bio. .

Abstract

Prosthesis-induced pathological calcification is a significant challenge in biomaterial applications and is often associated with various reconstructive medical procedures. It is uncertain whether the fibrous extracellular matrix (ECM) adjacent to biomaterials directly triggers osteogenic trans-differentiation in nearby cells. To investigate this possibility, we engineered a heterogeneous polystyrene fibrous matrix (PSF) designed to mimic the ECM. Our findings revealed that the myoblasts grown on this PSF acquired osteogenic properties, resulting in mineralization both in vitro and in vivo. Transcriptomic analyses indicated a notable upregulation in the expression of the long noncoding RNA metastsis-associated lung adenocarcinoma transcript 1 (Malat1) in the C2C12 myoblasts cultured on PSF. Intriguingly, silencing Malat1 curtailed the PSF-induced mineralization and downregulated the expression of bone morphogenetic proteins (Bmps) and osteogenic markers. Further, we found that PSF prompted the activation of Yap1 signaling and epigenetic modifications in the Malat1 promoter, crucial for the expression of Malat1. These results indicate that the fibrous matrix adjacent to biomaterials can instigate Malat1 upregulation, subsequently driving osteogenic trans-differentiation in myoblasts and ectopic calcification through its transcriptional regulation of osteogenic genes, including Bmps. Our findings point to a novel therapeutic avenue for mitigating prosthesis-induced pathological calcification, heralding new possibilities in the field of biomaterial-based therapies.

Keywords: Fibrous ECM mimicry; Malat1; Prosthesis-induced pathologic calcification; Trans-differentiation.


Conflict of interest statement

The authors declare that they have no known competing financial interests or personal relationships that could have appeared to influence the work reported in this paper.

Figures

Image 1
Graphical abstract
Fig. 1
Fig. 1
Characterization of PSF in comparison with a control PTFE. (a) Scanning electron microscopy. Magnification; 3000× (PSF inlet, 20000x), Scale bar = 10 μm (b) Degree of orientation analysis. PSF shows a random orientation distribution while PTFE does an even one. (c) Surface roughness. Quantitative analysis showed a notably increased surface roughness and arithmetic average of 3D roughness in PSF. (d) Water contact angle. PSF does not show significant differences in surface hydrophobicity. All data present with averages and standard deviations (n = 3).
Fig. 2
Fig. 2
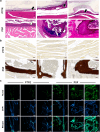
PSF induces ectopic calcification in vivo. (a) Hematoxylin and eosin staining. PSF was implanted into the interal space of vastus medialis and gracilis muscles. After 12 weeks post-transplantation, the mice were sacrified and evaluated for ectopic calcification. Scale bar = 5 μm. (b) Von kossa staining. Scale bar = 5 μm. (c) Immunohistochemistry for Runx2. Green; Runx2. Blue; Nuclei. Scale bar = 20 μm. (d) Soft X-ray and μCT analysis. Scale bar = 5 μm.
Fig. 2
Fig. 2
PSF induces ectopic calcification in vivo. (a) Hematoxylin and eosin staining. PSF was implanted into the interal space of vastus medialis and gracilis muscles. After 12 weeks post-transplantation, the mice were sacrified and evaluated for ectopic calcification. Scale bar = 5 μm. (b) Von kossa staining. Scale bar = 5 μm. (c) Immunohistochemistry for Runx2. Green; Runx2. Blue; Nuclei. Scale bar = 20 μm. (d) Soft X-ray and μCT analysis. Scale bar = 5 μm.
Fig. 3
Fig. 3
PSF induces osteogenic phenotype and activates Bmp signaling in myoblast cells. (a) Alkaline phosphatase staining and activity. The C2C12 myoblasts were cultured on PSF for 1 week. (b) SEM images of C2C12 cells grown on TCD and PSF. Scale bar = 500 μm. (c) Quantification of cell spreading. The cell area was measured from the SEM images. (d) Expression of Bmp2, Bmp7 and Bmp4 transcripts. The RT-qPCRs were performed, and Gapdh was used for normalization. (e) Immunostaining for Bmp2 and Bmp7 proteins in the cells grown on TCD and PSF. (Green: Bmp2, Yellow: Bmp7, Red: actin phalloidin, Blue: DAPI). The C2C12 myoblasts were cultured on TCD and PSF for four days. Statistical data present with averages and standard deviations (n = 3). Scale bar = 20 μm. (f) Mean fluorescence intensity of Bmp2 and Bmp7. * Statistically different (TCD vs. PSF; p < 0.05). # Statistically different (GM vs. OM; p < 0.05). † Statistically different (Non-treated vs. BMP2- treated; p < 0.05).
Fig. 4
Fig. 4
Total RNA sequencing reveals an increase of Malat1 expression in PSF group. (a) PCA analysis of Total RNA-seq result of PSF and TCD groups. (b) Heatmap of significant differential genes of PSF and TCD groups. (c) Volcano plot described differential expressed genes in PSF/TCD. (d) Biological process analysis of DEGs. (e) GSEA analysis of significant biological process; Ossification (f) RT-qPCR validation of expression level of Malat1 and osteogenic marker genes. Data present with averages and standard deviations (n = 3).
Fig. 5
Fig. 5
Bisulfite sequencing results shows a decrease in the CpG methylation level of Malat1 in the PSF group. (a) Visualization of whole-genome bisulfite sequencing (WGBS) data using Integrated Genome Visualizer (IGV). Differentially methylated regions (DMRs) is observed between TCD and PSF. (b) Differentially methylated regions in CpG regions. (c) Significant differential regions in chromosome 19. (d) Enrichment analysis of DMR related genes. (e) The upstream region of Malat1 in PSF shows more demethylated region compared to TCD. (f) The CpG region of Malat1 in PSF shows more demethylated region compared to TCD. Red = TCD/Blue = PSF.
Fig. 6
Fig. 6
PSF increases the nuclear translocation of Yap1 leading to Malat1 expression. (a) Immunofluorescence images described translocation of Yap1 protein into nucleus on PSF group. Scale bar = 10 μm (b) Quantitative analysis of immunofluorescence images of TCD and PSF respectively. (c, d) Chromatin immunoprecipitation (ChIP)-assay and ChIP-qPCR of Malat1/Tcf3 and Malat1/Tead1 binding. Fold enrichment was normalized using input. Translocation of Yap1 is observed in PSF and reverse effect is identified in siMalat1.
Fig. 7
Fig. 7
Malat1 elevates Piezo1 expression and facilitates the nuclear translocation of Yap1 by increased intracellular Ca2+ levels. (a) A time-course expression of Piezo1 in C2C12 myoblasts cultures on PSF. (b) Live cell imaging of intracellular Ca2+ in the cells on PSF (orange, Rhod-2, AM) over 6 h. Scale bar = 500 μm. (c) Quantification of intracellular Ca2+. Image analysis was performed by measuring the fluorescence area. (d-e) Immunofluorescence images of Yap1. The cells were treated with calcineurin inhibitor (cyclosporin A) at concentrations of 1000 ng/ml. Nuclear/Cyto ratio refers to the proportion of cells that have a Yap1-positive nucleus. Scale bar = 10 μm * Statistically different (TCD vs. PSF; p < 0.05). † Statistically different (Non-treated vs. CsA-treated; p < 0.05).
Fig. 8
Fig. 8
Knockdown of Malat1 attenuates PSF-induced osteogenic transdifferentiation of myoblasts through the regulation of microRNAs. (a) ALP staining. The C2C12 cells were cultured for 4 days. (b) Expression of Bmp2 and Bmp7 transcripts determined by RT-qPCRs. (c) Expression of osteogenic marker genes determined by qPCRs. (d) Expression of miRNAs which Malat1 regulate the level of. The miRNA RT-qPCR was performed in the cells cultured for 4 days (n = 3).

Similar articles

References

    1. Francis M.D., Russell R.G., Fleisch H. Diphosphonates inhibit formation of calcium phosphate crystals in vitro and pathological calcification in vivo. Science. 1969;165:1264–1266. doi: 10.1126/science.165.3899.1264. - DOI - PubMed
    1. Anderson H.C. Mechanisms of pathologic calcification. Rheum Dis Clin North Am. 1988;14:303–319. - PubMed
    1. Kostyunin A., et al. Ultrastructural pathology of atherosclerosis, calcific aortic valve disease, and bioprosthetic heart valve degeneration: commonalities and differences. Int. J. Mol. Sci. 2020;21 doi: 10.3390/ijms21207434. - DOI - PMC - PubMed
    1. Wen S., et al. Mechanisms and drug therapies of bioprosthetic heart valve calcification. Front. Pharmacol. 2022;13 doi: 10.3389/fphar.2022.909801. - DOI - PMC - PubMed
    1. Kempf Hervé, Komarova Svetlana, Murshed Monzur. Editorial: ectopic mineralization of tissues: mechanisms, risk factors, diseases, and prevention. Front. Cell Dev. Biol. 2021 Oct;25(9) doi: 10.3389/fcell.2021.759702.eCollection.2021. - DOI - PMC - PubMed

LinkOut - more resources