. 2024 Jul 20;27(8):110544.
doi: 10.1016/j.isci.2024.110544. eCollection 2024 Aug 16.

Proteogenomic characterization of pancreatic neuroendocrine tumors uncovers hypoxia and immune signatures in clinically aggressive subtypes

Affiliations

Proteogenomic characterization of pancreatic neuroendocrine tumors uncovers hypoxia and immune signatures in clinically aggressive subtypes

Atsushi Tanaka et al. iScience. .

Abstract

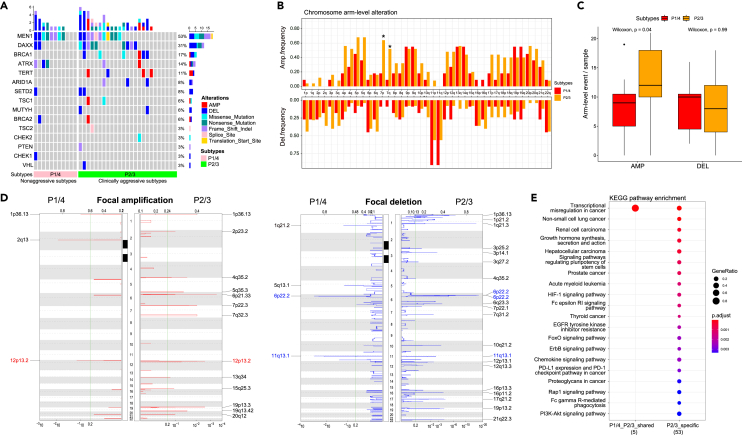
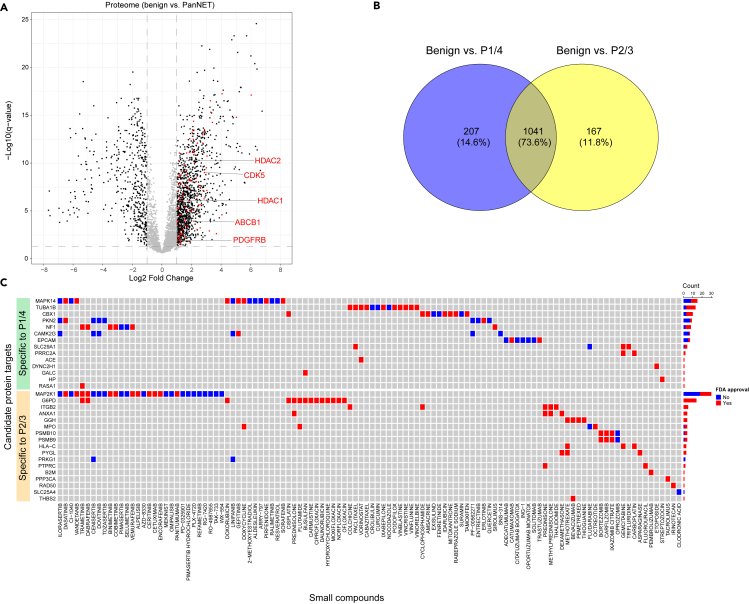
Pancreatic neuroendocrine tumors (PanNETs) represent well-differentiated endocrine neoplasms with variable clinical outcomes. Predicting patient outcomes using the current tumor grading system is challenging. In addition, traditional systemic treatment options for PanNETs, such as somatostatin analogs or cytotoxic chemotherapies, are very limited. To address these issues, we characterized PanNETs using integrated proteogenomics and identified four subtypes. Two proteomic subtypes showed high recurrence rates, suggesting clinical aggressiveness that was missed by current classification. Hypoxia and inflammatory pathways were significantly enriched in the clinically aggressive subtypes. Detailed analyses revealed metabolic adaptation via glycolysis upregulation and oxidative phosphorylation downregulation under hypoxic conditions. Inflammatory signature analysis revealed that immunosuppressive molecules were enriched in immune hot tumors and might be immunotherapy targets. In this study, we characterized clinically aggressive proteomic subtypes of well-differentiated PanNETs and identified candidate therapeutic targets.

Keywords: Cancer; Cancer systems biology; Genomics; Proteomics.


Conflict of interest statement

D.S.K. is now an employee of Paige.AI. M.H.R. is a member of the Scientific Advisory Boards of Azenta Life Sciences and Universal Diagnostics (UDX). None of these companies had any role in the support, design, execution, data analysis, or any other aspect of this study.

Figures

None
Graphical abstract
Figure 1
Figure 1
Proteogenomic profiling with clinical attributes (A) Summary plot of the 37 PanNETs with proteogenomic features and clinical attributes. The top 500 proteins with the highest variance are shown in a heatmap. Gray columns indicate the missing data. Note: recurrence events are only observed in the P2/3 subtypes. (B) Stage III/IV samples are significantly enriched in the P2/3 subtypes. (C) Kaplan-Meier curve analyses of recurrence-free survival (RFS) time in present study. P2/3 subtypes show shorter RFS time than P1/4 subtypes, however, the difference is not statistically significant. Survival analysis plot with all TNM stages and all tumor grades is shown in left-side. Survival analysis plot with all TNM stages and tumor grades 1 or 2 is shown in right-side. (D) Volcano plot of the differential expression analysis results between P2/3 and P1/4 subtypes. Gene names with statistical significance (q < 0.05) and two or more-fold changes are shown. The horizontal dashed line corresponds to q = 0.05. (E) Pathway enrichment analysis with Hallmark gene set signatures between the clinically aggressive and nonaggressive proteome-subtypes (P2/3 vs. P1/4). All the significant results are shown.
Figure 2
Figure 2
Somatic recurrent copy number alteration of PanNETs (A) Integrated SNV and CNA oncoprint of PanNET based on MSK-IMPACT shows frequent alterations in MEN1 and DAXX. Altered genes are mainly involved in DNA repair, chromatin remodeling, telomere maintenance, and PI3K/mTOR signaling. (B) Frequency plot of chromosomal arm-level copy number alteration. ∗ indicates statistical differences between the P1/4 and P2/3 subtypes. Only the 7p and 7q events show significant differences in frequency between P1/4 and P2/3. (C) The arm-level event count per patient shows a significant increase in amplification events in the P2/3 subtypes. Although the arm-level event count of deletion does not show a significant difference, the arm-level event of amplification shows a significantly higher event rate in P2/3 than in P1/4. (D) Recurrent somatic focal peak analysis result is shown. Chromosomal loci colored in red or blue are shared between the P1/4 and P2/3 subtypes. (E) KEGG pathway enrichment analysis of cancer-related genes involved in focal peak events. Many oncogenic pathways such as HIF1 signaling are enriched in the clinically aggressive subtypes (P2/3).
Figure 3
Figure 3
Proteomic characterization of hypoxia signature in PanNETs (A) Pathway enrichment analysis with Hallmark signatures between hypoxia-low and hypoxia-high groups based on ssGSEA Hallmark_Hypoxia score (divided by median value). All statistically significant results are presented. As expected, pathways known to be closely related to hypoxia signature, such as EMT or glycolysis, are enriched in the hypoxia-high group. (B) Boxplot of hypoxia scores between proteome-based subtypes. The P2/3 subtypes have higher hypoxia scores than the P1/4 subtypes, as expected from pathway enrichment analysis between the P2/3 and P1/4 subtypes. The dashed horizontal line represents the mean hypoxia score across this cohort. (C) Heatmap of hypoxia-related pathway scores and protein abundances. The samples are ordered according to their hypoxia scores. Spearman coefficients with hypoxia scores are shown on the right-hand side of the heatmap. Hypoxia-related molecules and pathways, such as HIF1α or angiogenesis score, are positively correlated with hypoxia score. EMT-related signatures also show concordant correlations with hypoxia score. As representative EMT markers, E-cadherin (coded by CDH1) decreases, and vimentin (coded by VIM) increases in EMT, resulting in negative and positive correlations with hypoxia score. Furthermore, glycolysis is upregulated in hypoxia-high status, with high coefficients. ∗ indicates statistical significance. (D) Boxplots of E-cadherin and Vimentin protein expression in the hypoxia low and hypoxia high groups (quantified by mass spectrometry). Consistent with the hypoxic group status, E-cadherin is significantly downregulated in hypoxia-high group. Vimentin is significantly upregulated in the hypoxia-high group. (E) Boxplots of the protein expression of EMT-inducing transcription factors (quantified by IHC). SNAI and TWIST are significantly upregulated in the hypoxia-high group. (F) Boxplots of matrix metalloprotease protein expression in our proteome dataset (quantified by mass spectrometry). MMP11 expression is significantly upregulated in the hypoxia high group. (G) TGF-β signaling positively correlates with the EMT signature. (H) Hypoxia signature is positively correlated with mTORC1 signaling. (I) Phosphorylated Akt and mTOR expression levels (quantified by IHC) are significantly higher in the hypoxia high group than in the hypoxia low group. (J) GSEA plot of KEGG glycolysis pathway and KEGG oxidative phosphorylation pathway. KEGG, which is a gene set different from the Hallmark gene set, shows again metabolic adaptation. (K) Fold changes of proteins in the glycolysis pathway, TCA cycle, and oxidative phosphorylation are shown (quantified by mass spectrometry).
Figure 4
Figure 4
Integrated immune signature analysis of PanNETs at proteome level (A) Immune signature profiling of DNA, proteins, and pathway alterations. Gray columns indicate the missing data. Although genomic events do not have a clear correlation with immune score, immune cell infiltration (CD3 count), INFγ signaling, and antigen presenting system are significantly correlated with immune score. ∗ indicates statistical significance. (B) PanNET P2/3 subtypes show significantly higher immune scores than P1/4 subtypes. (C) GSEA between immune cold and hot groups shows significant enrichment of antigen processing-related pathways in immune hot tumors. (D) Among MHC class I molecules on the cell surface, B2M shows a significant positive correlation with the immune score. HLA-A and HLA-C have a weak positive correlation with the immune score, but not significant. Proteins were quantified by mass spectrometry. (E) Fold change bar chart of the proteasome components (quantified by mass spectrometry). Most components are upregulated in immune hot tumors compared to immune cold tumors. (F) IRF1 expression (quantified by IHC) is significantly higher in immune hot tumors than immune cold tumors. (G) Correlation plot of IRF1, MHC class I, and proteasomecomponents. ∗, p < 0.05; ∗∗, p < 0.01; p < 0.001. (H) The PD-L1 positivity rate (quantified by IHC) is higher in immune hot tumors than in immune cold tumors, but the difference is not statistically significant. (I) IDO1 expression (quantified by IHC) is higher in immune hot tumors than in immune cold tumors, but the difference is not statistically significant. (J) The number of FOXP3 positive cells (quantified by IHC), which are immune suppressors, is significantly higher in immune hot tumors than in immune cold tumors. (K) CD68 positive cells (quantified by IHC) are enriched in immune hot tumors with close statistical significance.
Figure 5
Figure 5
Possible drug targets for PanNET treatment (A) Volcano plot of differential expression between PanNETs and normal pancreatic tissue. Black dots are differentially expressed proteins with statistical significance (FDR <0.05) and > 2-fold change. Red dots represent proteins with inhibitory drugs in the drug-gene interaction database. Labeled proteins (in red) are shown in this plot, highlighting that this analysis detects known therapeutic candidates. (B) Venn diagram of differentially expressed proteins (benign vs. P1/4 and benign vs. P2/3). Only proteins with FDR <0.05 and >2-fold change are counted. (C) Possible therapeutic drug candidates targeting subtype-specific proteins with fold change increase >2.

References

    1. Yao J.C., Hassan M., Phan A., Dagohoy C., Leary C., Mares J.E., Abdalla E.K., Fleming J.B., Vauthey J.N., Rashid A., Evans D.B. One hundred years after "carcinoid": epidemiology of and prognostic factors for neuroendocrine tumors in 35,825 cases in the United States. J. Clin. Oncol. 2008;26:3063–3072. doi: 10.1200/jco.2007.15.4377. - DOI - PubMed
    1. Korse C.M., Taal B.G., van Velthuysen M.L.F., Visser O. Incidence and survival of neuroendocrine tumours in the Netherlands according to histological grade: experience of two decades of cancer registry. Eur. J. Cancer. 2013;49:1975–1983. doi: 10.1016/j.ejca.2012.12.022. - DOI - PubMed
    1. Dasari A., Shen C., Halperin D., Zhao B., Zhou S., Xu Y., Shih T., Yao J.C. Trends in the Incidence, Prevalence, and Survival Outcomes in Patients With Neuroendocrine Tumors in the United States. JAMA Oncol. 2017;3:1335–1342. doi: 10.1001/jamaoncol.2017.0589. - DOI - PMC - PubMed
    1. Digestive System Tumours . 5th Edition. 2019. WHO Classification of Tumours.
    1. Yang M., Zeng L., Ke N.W., Tan C.L., Tian B.L., Liu X.B., Xiang B., Zhang Y. World Health Organization grading classification for pancreatic neuroendocrine neoplasms: a comprehensive analysis from a large Chinese institution. BMC Cancer. 2020;20:906. doi: 10.1186/s12885-020-07356-5. - DOI - PMC - PubMed

LinkOut - more resources