. 2024 Jul 31:17:145-153.
doi: 10.1016/j.ibneur.2024.07.007. eCollection 2024 Dec.

Bipolar disorder: Construction and analysis of a joint diagnostic model using random forest and feedforward neural networks

Affiliations

Bipolar disorder: Construction and analysis of a joint diagnostic model using random forest and feedforward neural networks

Ping Sun et al. IBRO Neurosci Rep. .

Abstract

Background: To construct a diagnostic model for Bipolar Disorder (BD) depressive phase using peripheral tissue RNA data from patients and combining Random Forest with Feedforward Neural Network methods.

Methods: Datasets GSE23848, GSE39653, and GSE69486 were selected, and differential gene expression analysis was conducted using the limma package in R. Key genes from the differentially expressed genes were identified using the Random Forest method. These key genes' expression levels in each sample were used to train a Feedforward Neural Network model. Techniques like L1 regularization, early stopping, and dropout layers were employed to prevent model overfitting. Model performance was then validated, followed by GO, KEGG, and protein-protein interaction network analyses.

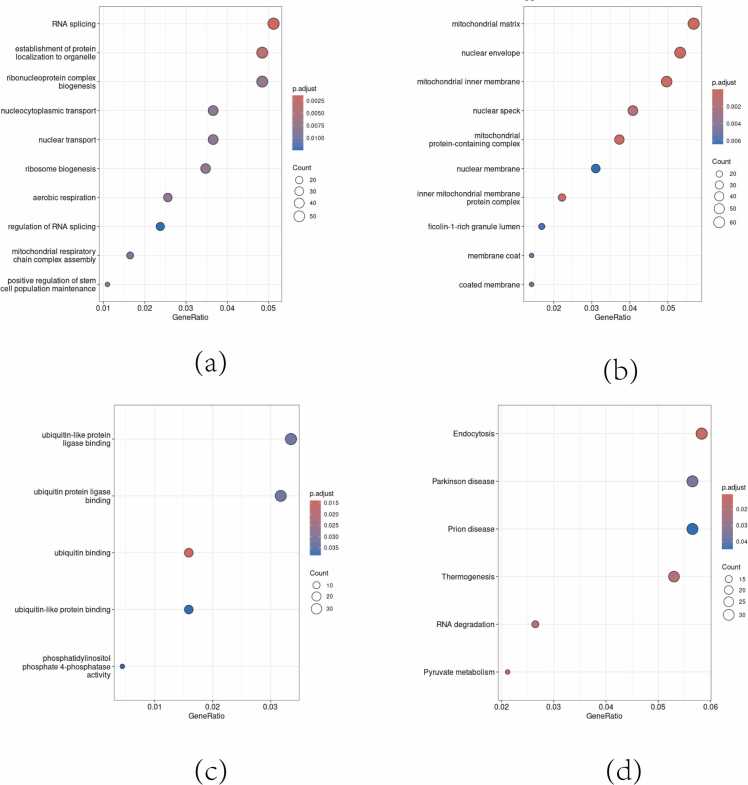
Results: The final model was a Feedforward Neural Network with two hidden layers and two dropout layers, comprising 2345 trainable parameters. Model performance on the validation set, assessed through 1000 bootstrap resampling iterations, demonstrated a specificity of 0.769 (95 % CI 0.571-1.000), sensitivity of 0.818 (95 % CI 0.533-1.000), AUC value of 0.832 (95 % CI 0.642-0.979), and accuracy of 0.792 (95 % CI 0.625-0.958). Enrichment analysis of key genes indicated no significant enrichment in any known pathways.

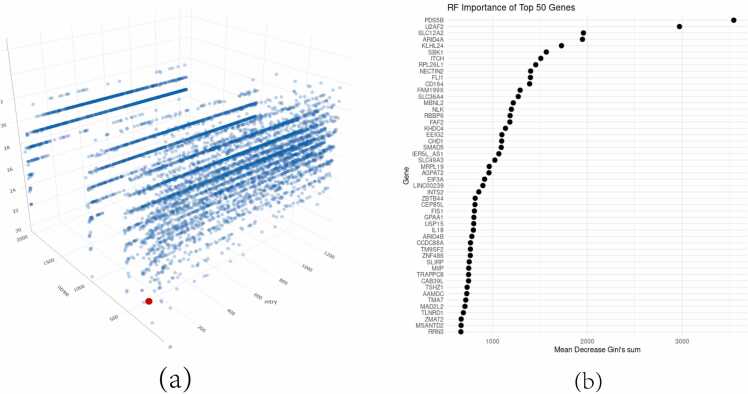
Conclusion: Key genes with biological significance were identified based on the decrease in Gini coefficient within the Random Forest model. The combined use of Random Forest and Feedforward Neural Network to establish a diagnostic model showed good classification performance in Bipolar Disorder.

Keywords: Bipolar disorder; Diagnostic models; Machine learning; Neural networks.


Conflict of interest statement

The authors declare that they have no competing interests

Figures

Fig. 1
Fig. 1
"Post-Processing Data Visualization". (a)(b)(c)Post-background correction and normalization expression levels for datasets GSE23848, GSE39653, and GES69486, respectively.(d)(e)(f): PCA plots following background correction and normalization for the same datasets.(h)(i)(g): Volcano plots of differentially expressed genes identified by RRA for each of the three datasets.
Figure 2
Figure 2
"GO and KEGG Enrichment Analysis" (a): GO enrichment in Biological Process (BP),(b): GO enrichment in Cellular Component (CC), (c): GO enrichment in Molecular Function (MF), (d): KEGG pathway enrichment results - bubble size for number of genes, color depth for enrichment significance.
Figure 3
Figure 3
"Random Forest Optimization and Key Features". (a): The 3D scatter plot represents the results of a grid search optimization for the random forest parameters, plotting 'mtry' on the X-axis, 'ntree' on the Y-axis, and the average error rate on the Z-axis. The red point denotes the selected optimal parameters that balance model complexity with error rate. (b): Top 50 key features selected based on the decrease in Gini coefficient, depicted in a relevant format (like a bar chart or ranked list).
Fig. 4
Fig. 4
"Key Gene Expression Heatmaps". (a): Cluster heatmap showing the top 50 genes selected by the Random Forest algorithm in dataset GSE23848.(b): Cluster heatmap for the top 50 genes in dataset GSE39653 as identified by the Random Forest method.(c): Cluster heatmap depicting the top 50 genes from dataset GES69486, selected using Random Forest analysis.
Fig. 5
Fig. 5
"Neural Network Training Metrics". Loss and Validation Loss (Top Graph): The first graph shows the loss on the training dataset (blue line) and the validation dataset (green line) as the model trains over epochs. Initially, both training and validation loss decrease, indicating that the model is learning. However, the validation loss stabilizes after a certain number of epochs, which might suggest the point of convergence.Accuracy and Validation Accuracy (Middle Graph): The second graph tracks the accuracy on the training set (blue line) and the validation set (green line). Both accuracies improve rapidly in the initial epochs and then plateau, with training accuracy remaining consistently higher than validation accuracy. The spikes in validation accuracy indicate moments of high generalization performance.Learning Rate (Bottom Graph): The third graph illustrates the learning rate (lr) of the model over epochs. It shows a step-wise decay in the learning rate, which is a common technique to help the model converge by taking smaller steps in the optimization landscape as training progresses.
Fig. 6
Fig. 6
"PPI Network Map". A network map illustrating the protein-protein interactions of the 50 key genes.

Similar articles

Cited by

References

    1. Akbarian S., Liu C., Knowles J.A., et al. The PsychENCODE project. Nat. Neurosci. 2015;18(12):1707–1712. doi: 10.1038/nn.4156. - DOI - PMC - PubMed
    1. Akula N., Barb J., Jiang X., et al. RNA-sequencing of the brain transcriptome implicates dysregulation of neuroplasticity, circadian rhythms and GTPase binding in bipolar disorder. Mol. Psychiatry. 2014;19(11):1179–1185. doi: 10.1038/mp.2013.170. - DOI - PMC - PubMed
    1. Barnes M., Freudenberg J., Thompson S., et al. Experimental comparison and cross-validation of the Affymetrix and Illumina gene expression analysis platforms. Nucleic Acids Res. 2005;33(18):5914–5923. doi: 10.1093/nar/gki890. - DOI - PMC - PubMed
    1. Boulesteix A.L., Janitza S., Kruppa J., et al. Overview of random forest methodology and practical guidance with emphasis on computational biology and bioinformatics. WIREs Data Min. Knowl. Discov. 2012;2(6):493–507. doi: 10.1002/widm.1072. - DOI
    1. Breiman L. Random forests[J] Mach. Learn. 2001;45:5–32.

LinkOut - more resources