. 2024 Aug 14:15:1428709.
doi: 10.3389/fphys.2024.1428709. eCollection 2024.

The arrhythmic substrate of hypertrophic cardiomyopathy using ECG imaging

Affiliations

The arrhythmic substrate of hypertrophic cardiomyopathy using ECG imaging

Ji-Jian Chow et al. Front Physiol. .

Abstract

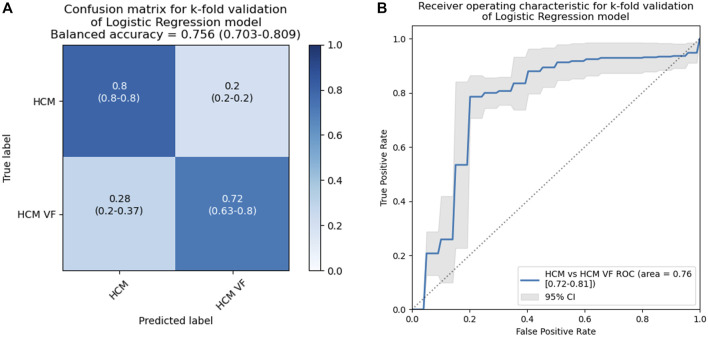
Introduction: Patients with hypertrophic cardiomyopathy (HCM) are at risk for lethal ventricular arrhythmia, but the electrophysiological substrate behind this is not well-understood. We used non-invasive electrocardiographic imaging to characterize patients with HCM, including cardiac arrest survivors. Methods: HCM patients surviving ventricular fibrillation or hemodynamically unstable ventricular tachycardia (n = 17) were compared to HCM patients without a personal history of potentially lethal arrhythmia (n = 20) and a pooled control group with structurally normal hearts. Subjects underwent exercise testing by non-invasive electrocardiographic imaging to estimate epicardial electrophysiology. Results: Visual inspection of reconstructed epicardial HCM maps revealed isolated patches of late activation time (AT), prolonged activation-recovery intervals (ARIs), as well as reversal of apico-basal trends in T-wave inversion and ARI compared to controls (p < 0.005 for all). AT and ARI were compared between groups. The pooled HCM group had longer mean AT (60.1 ms vs. 52.2 ms, p < 0.001), activation dispersion (55.2 ms vs. 48.6 ms, p = 0.026), and mean ARI (227 ms vs. 217 ms, p = 0.016) than structurally normal heart controls. HCM ventricular arrhythmia survivors could be differentiated from HCM patients without a personal history of life-threatening arrhythmia by longer mean AT (63.2 ms vs. 57.4 ms, p = 0.007), steeper activation gradients (0.45 ms/mm vs. 0.36 ms/mm, p = 0.011), and longer mean ARI (234.0 ms vs. 221.4 ms, p = 0.026). A logistic regression model including whole heart mean activation time and activation recovery interval could identify ventricular arrhythmia survivors from the HCM cohort, producing a C statistic of 0.76 (95% confidence interval 0.72-0.81), with an optimal sensitivity of 78.6% and a specificity of 79.8%. Discussion: The HCM epicardial electrotype is characterized by delayed, dispersed conduction and prolonged, dispersed activation-recovery intervals. Combination of electrophysiologic measures with logistic regression can improve differentiation over single variables. Future studies could test such models prospectively for risk stratification of sudden death due to HCM.

Keywords: electrocardiographic imaging; hypertrophic cardiomyopathy; implantable defibrillator; risk stratification; sudden death.


Conflict of interest statement

Medtronic has not influenced or sponsored any of the research here but has provided speaker fees to PK for a topic unrelated to this work. Imperial Innovations holds the patent for the intellectual property of the Ventricular Conduction Stability algorithm on behalf of the authors MS-S, KL, FN, AV, DF, and PK. The remaining authors declare that the research was conducted in the absence of any commercial or financial relationship that could be construed as a potential conflict of interest. The author(s) declared that they were an editorial board member of Frontiers, at the time of submission. This had no impact on the peer review process and the final decision.

Figures

FIGURE 1
FIGURE 1
Activation–repolarization mapping process. (A) The 252-electrode sensor vest is applied to the patient undergoing maximal Bruce protocol exercise. Recordings are made during 10 min of supine recovery, which is followed by non-contrast CT scan of the chest (B). The CT scan is segmented ((C), left) into a 3D mesh ((C), right). A time strip containing 10 cardiac cycles from the recording is selected for analysis, and body surface signals from the vest too noisy for analysis are identified ((D), left) and removed from the vest recording ((D), right). Epicardial electrograms are reconstructed and extracted to our custom software. In this mapping software, reconstructed electrograms (cf. the body surface signals from step (D) are filtered for baseline wander ((E), left). The user selects a template QRS-T complex, and the software uses autocorrelation to search for the most similar 10 regions of interest (E, right). These 10 matched regions of interest containing the QRS complexes are signal averaged to a synthetic EGM per epicardial location (F). A pretrained neural network identifies the bounds of the QRS complex and the T wave for further processing ((G), left). It does this by working out the probability that a given time point is within a P wave, QRS complex, T wave, or the baseline based on its value and the values of its neighbors ((G), right). EGMs with low amplitude relative to QRS or T waves with three or more deflections are rejected (indicative of poor interpretability, (H). Following this, local activation and repolarization times can be calculated (I). Electrocardiographic imaging, ECGi; computerized tomography, CT; three-dimensional, 3D; electrogram, EGM; convolutional neural network, CNN.
FIGURE 2
FIGURE 2
Comparison of whole heart activation and repolarization metrics immediately after peak exercise and in end recovery between a pooled hypertrophic cardiomyopathy cohort (HCM + HCM VF groups) and a pooled selection of structurally normal heart controls. Local activation time (LAT) was defined as the onset of the first epicardial QRS complex to the steepest negative slope of the electrogram–QRS complex. Local repolarization time (LRT) was defined as the onset of the first epicardial QRS complex to the steepest positive slope of the electrogram-T wave. Activation recovery interval (ARI) is the difference between LAT and LRT. Mean time is the average of all LAT/ARI across the heart. Dispersion is the central 95% range of LAT/ARI across the heart. Gradient is the whole heart mean rate of range in LAT/ARI over a 5 mm search distance around each epicardial location. An asterisk (*) denotes p-value < 0.05.
FIGURE 3
FIGURE 3
Comparison of non-invasive epicardial maps between a patient with hypertrophic cardiomyopathy and an asymptomatic, unaffected Brugada syndrome counterpart. Scales are matched for activation and repolarization separately to aid comparison. Examples are selected to illustrate the differences seen in the overall cohort. In activation, the hypertrophic cardiomyopathy heart (left panel) has delayed conduction and repolarization compared to the normal heart (right panel). Apical electrograms are displayed for both hearts, with the HCM heart exhibiting T-wave inversion. Graphs are voltage/time, where zero time is the global QRS start. Right ventricle, RV; left ventricle, LV; left anterior descending artery, LAD; local activation time, LAT; local repolarization time, LRT; activation recovery interval, ARI.
FIGURE 4
FIGURE 4
Common patterns seen in electrocardiographic imaging maps of hypertrophic cardiomyopathy patients contrasted with a structurally normal heart. Representative electrograms are linked to their location on the epicardial shell by an arrow. Graphs are voltage/time, where zero time is the global QRS start. Hypertrophic cardiomyopathy, HCM; change in voltage over time, dV/dt; local activation time, LAT; local repolarization time, LRT; activation recovery interval, ARI.
FIGURE 5
FIGURE 5
Comparison of whole heart activation and repolarization metrics immediately after peak exercise and in end recovery between hypertrophic cardiomyopathy (HCM) patients without a personal arrhythmic history and VF or hemodynamically unstable VT survivors (HCM VF). Local activation time (LAT) was defined as the onset of the first epicardial–QRS complex to the steepest negative slope of the electrogram–QRS complex. Local repolarization time (LRT) was defined as the onset of the first epicardial–QRS complex to the steepest positive slope of the electrogram-T wave. Activation recovery interval (ARI) is the difference between LAT and LRT. Mean time is the average of all LAT/ARI across the heart. Dispersion is the central 95% range of LAT/ARI across the heart. Gradient is the whole heart mean rate of range in LAT/ARI over a 5 mm search distance around each epicardial location. An asterisk (*) denotes a p-value < 0.05.
FIGURE 6
FIGURE 6
Probability distributions for HCM VF or unstable VT survivors as well as HCM patients without a personal history of life-threatening arrhythmia, produced by a 2-variable logistic model of mean activation time and mean activation recovery interval at rest. Higher probability scores refer to the chance that the patient in question falls in the HCM VF group. The dotted line represents a probability of 0.5. Correct classification was defined as p > 0.5 for HCM VF and p < 0.5 for HCM, although this threshold can be defined differently by the clinician. Hypertrophic cardiomyopathy, HCM; ventricular fibrillation, VF; ventricular tachycardia, VT.
FIGURE 7
FIGURE 7
Results for a k-fold cross-validation of 2-variable logistic models including mean activation times and ARI at rest in patients with HCM without a personal history of life-threatening arrhythmia and HCM VF or hemodynamically unstable VT survivors. This analysis simulates unseen data to provide a more reliable estimate of how a model with the same input variables will generalize. The classification threshold was set to p = 0.5, and the dataset was split into five folds. HCM, hypertrophic cardiomyopathy; VF, ventricular fibrillation; VT, ventricular tachycardia.

References

    1. Barletta G., Lazzeri C., Franchi F., Del Bene R., Michelucci A. (2004). Hypertrophic cardiomyopathy: electrical abnormalities detected by the extended-length ECG and their relation to syncope. Int. J. Cardiol. 97 (1), 43–48. 10.1016/j.ijcard.2003.07.035 - DOI - PubMed
    1. Chowdhury M. Z. I., Turin T. C. (2020). Variable selection strategies and its importance in clinical prediction modelling. Fam. Med. Community Health 8 (1), e000262. 10.1136/fmch-2019-000262 - DOI - PMC - PubMed
    1. Cluitmans M. J. M., Bonizzi P., Karel J. M. H., Das M., Kietselaer BLJH, de Jong M. M. J., et al. (2017). In vivo validation of electrocardiographic imaging. JACC Clin. Electrophysiol. 3 (3), 232–242. 10.1016/j.jacep.2016.11.012 - DOI - PubMed
    1. Duchateau J., Sacher F., Pambrun T., Derval N., Chamorro-Servent J., Denis A., et al. (2019). Performance and limitations of noninvasive cardiac activation mapping. Heart rhythm official J. Heart Rhythm Soc. 16 (3), 435–442. 10.1016/j.hrthm.2018.10.010 - DOI - PubMed
    1. Finocchiaro G., Sheikh N., Leone O., Westaby J., Mazzarotto F., Pantazis A., et al. (2021). Arrhythmogenic potential of myocardial disarray in hypertrophic cardiomyopathy: genetic basis, functional consequences and relation to sudden cardiac death. EP Eur. 23 (7), 985–995. 10.1093/europace/euaa348 - DOI - PubMed

LinkOut - more resources