. 2024 Oct 15;150(16):1248-1267.
doi: 10.1161/CIRCULATIONAHA.123.067479. Epub 2024 Aug 29.

Transient Inhibition of Translation Improves Cardiac Function After Ischemia/Reperfusion by Attenuating the Inflammatory Response

Affiliations

Transient Inhibition of Translation Improves Cardiac Function After Ischemia/Reperfusion by Attenuating the Inflammatory Response

Christoph Hofmann et al. Circulation. .

Abstract

Background: The myocardium adapts to ischemia/reperfusion (I/R) by changes in gene expression, determining the cardiac response to reperfusion. mRNA translation is a key component of gene expression. It is largely unknown how regulation of mRNA translation contributes to cardiac gene expression and inflammation in response to reperfusion and whether it can be targeted to mitigate I/R injury.

Methods: To examine translation and its impact on gene expression in response to I/R, we measured protein synthesis after reperfusion in vitro and in vivo. Underlying mechanisms of translational control were examined by pharmacological and genetic targeting of translation initiation in mice. Cell type-specific ribosome profiling was performed in mice that had been subjected to I/R to determine the impact of mRNA translation on the regulation of gene expression in cardiomyocytes. Translational regulation of inflammation was studied by quantification of immune cell infiltration, inflammatory gene expression, and cardiac function after short-term inhibition of translation initiation.

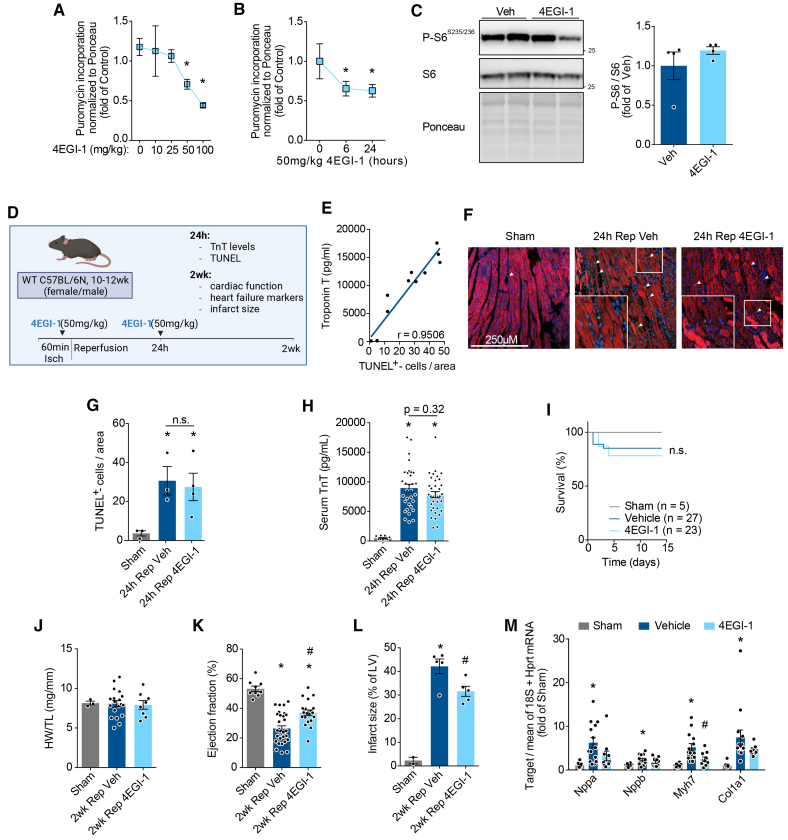
Results: Reperfusion induced a rapid recovery of translational activity that exceeds baseline levels in the infarct and border zone and is mediated by translation initiation through the mTORC1 (mechanistic target of rapamycin complex 1)-4EBP1 (eIF4E-binding protein 1)-eIF (eukaryotic initiation factor) 4F axis. Cardiomyocyte-specific ribosome profiling identified that I/R increased translation of mRNA networks associated with cardiac inflammation and cell infiltration. Short-term inhibition of the mTORC1-4EBP1-eIF4F axis decreased the expression of proinflammatory cytokines such as Ccl2 (C-C motif chemokine ligand 2) of border zone cardiomyocytes, thereby attenuating Ly6Chi monocyte infiltration and myocardial inflammation. In addition, we identified a systemic immunosuppressive effect of eIF4F translation inhibitors on circulating monocytes, directly inhibiting monocyte infiltration. Short-term pharmacological inhibition of eIF4F complex formation by 4EGI-1 or rapamycin attenuated translation, reduced infarct size, and improved cardiac function after myocardial infarction.

Conclusions: Global protein synthesis is inhibited during ischemia and shortly after reperfusion, followed by a recovery of protein synthesis that exceeds baseline levels in the border and infarct zones. Activation of mRNA translation after reperfusion is driven by mTORC1/eIF4F-mediated regulation of initiation and mediates an mRNA network that controls inflammation and monocyte infiltration to the myocardium. Transient inhibition of the mTORC1-/eIF4F axis inhibits translation and attenuates Ly6Chi monocyte infiltration by inhibiting a proinflammatory response at the site of injury and of circulating monocytes.

Keywords: TOR serine-threonine kinases; chemokine CCL2; eukaryotic initiation factor-4F; inflammation; myocardial infarction; peptide chain initiation, translational; reperfusion injury.


Conflict of interest statement

None.

Figures

Figure 1.
Figure 1.
Translational activation of the infarct and border zone after ischemia/reperfusion. A through C, Serum TnT (troponin T) levels, n=5–9 (A), puromycin incorporation measured by immunoblot, n=5–9 (B), and Pearson correlation coefficient of serum TnT and cardiac puromycin incorporation (C) of left ventricular lysates from mice 2 days after sham or I/R surgery. D, OP-puromycin immunostaining of the infarct region and border zone of mice 2 days after I/R surgery and of the remote area of sham mice. E through G, Diagram of the experimental setup (E) and puromycin incorporation into the sham, infarct, border zone, and remote area of mouse hearts 30 minutes (F) or 2 days (G) after reperfusion or sham surgery. *P<0.05 from sham. For statistical analysis, an unpaired 2-tailed t test was used for A and B, and 1-way ANOVA with Tukey post hoc analysis was used for F and G. Pearson correlation with 2-tailed P value was computed with GraphPad Prism 7.0 for C. P<0.05 was defined as significant difference. Error bars show SEM. E and H made in BioRender, biorender.com. Bord indicates border zone; Inf, infarct area; Puro, puromycin; Rem, remote area; and Rep, reperfusion.
Figure 2.
Figure 2.
Activation of signaling pathways controlling eIF4F-dependent translation initiation after reperfusion. A, Diagram of major signaling pathways proposed to regulate eIF4F-dependent translation initiation. B, Quantification of eIF4F complex assembly by pull-down of mRNA cap-binding proteins through 7-methylguanosin (m7GTP)–coupled agarose beads after simulated ischemia or ischemia (6 hours) followed by reperfusion in NRCMs, n=2 or 3. C, Immunoblots and quantifications of proposed eIF4F-regulatory pathways of NRCMs after ischemia (3 hours) followed by increasing times of reperfusion, n=2–8. D, Representative immunoblot and quantification of S6S235/236 phosphorylation of left ventricular lysates 2 or 24 hours after I/R surgery in mice, n=7 or 8. E, Representative phospho-S6S235/236 immunostainings of the infarct region and border zone 2 days after sham or I/R surgery in mice. *P<0.05 from control or sham. #P<0.05 from 3 hours ischemia. For statistical analysis, 1-way ANOVA with Tukey post hoc analysis was used for B through D. P<0.05 was defined as significant difference. Error bars show SEM. A made in BioRender, biorender.com. Ctr indicates control; Isch, ischemia; and Rep, reperfusion.
Figure 3.
Figure 3.
Cardiomyocyte-specific 4EBP1 overexpression inhibits eIF4F complex formation and translational activation of the border zone after reperfusion. A through C, Representative immunoblot and quantification of 4EBP1, n=6 (A), eIF4F complex assembly, n=5 (B), and puromycin incorporation, n=6 (C) after AdCtr or Ad4EBP1 treatment and sI/R (24 hours Rep) in NRVMs. Adenovirus treatment was initiated 24 hours before induction of ischemia. Wild-type (WT) 4EBP1 and dimer formation after overexpression as described previously indicated by arrows. D, Diagram of the experimental strategy used for F through I. E, Representative 4EBP1 immunoblot of left ventricular lysates 2 weeks after AAV9-Ctr or AAV9-4EBP1 intravenous injection. F, Serum TnT (troponin T) levels 24 hours after I/R surgery in AAV9-Ctr and AAV9-4EBP1–treated mice, n=7–11. G through I, Representative immunoblot and quantification of puromycin incorporation into the infarct (G), border zone (H), or remote area (I) 2 days after reperfusion in AAV9-Ctr and AAV9-4EBP1–treated mice, n=7–11. *P<0.05 from 24 hours Rep AdCtr or 2 days Rep AAV9-Ctr. For statistical analysis, an unpaired 2-tailed t test was used. P<0.05 was defined as significant difference. Error bars show SEM. D made in BioRender, biorender.com. Ctr indicates control; Isch, ischemia; Puro, puromycin; and Rep, reperfusion.
Figure 4.
Figure 4.
Short-term inhibition of eIF4F-dependent translation during reperfusion improves cardiac function. A and B, Quantification of myocardial puromycin incorporation in vivo after 6 hours of 4EGI-1 treatment with different concentrations, n=6 (0, 2, 5, and 50 mg/kg); n=2 (10 mg/kg and 100 mg/kg; A), or at different time points after 50 mg/kg 4EGI-1 treatment, n=5 (control), n=4 (6 hours), n=3 (24 hours; B) as assessed by immunoblot. Puromycin was intraperitoneally injected 30 minutes before animals were euthanized. C, S6S235/236 phosphorylation of left ventricular lysates of vehicle or 50 mg/kg of 4EGI-1–treated mice 2 days after I/R surgery assessed by immunoblot, n=4. D, Diagram of the experimental strategy used for E through M. E, Pearson’s correlation coefficient of serum TnT (troponin T) and TUNEL+ cells of immunostainings from mice 24 hours after sham or I/R surgery. F and G, Representative immunostaining (F) and quantification of TUNEL+ cells per view by immunofluorescence, n=3 or 4 (G), in sham or I/R surgery operated mice treated with vehicle or 50 mg/kg 4EGI-1. H, Serum TnT levels at 24 hours after I/R surgery in female (n=2–13) and male mice (n=7–25). I, Two-week survival of sham or I/R surgery–operated mice treated with vehicle or 50 mg/kg of 4EGI-1 corresponding to mice used for J through M, n=5–27. J through M, Heart weight (HW) to tibia length (TL) ratio (J), left ventricular ejection fraction of female (n=2–13) and male mice (n=7–19; K), infarct size (n=2–5 male mice; L), and left ventricular expression of Nppa, Nppb, Myh7, and Col1a1 (n=4–6 female mice and 8–14 male mice; M) 2 weeks after sham or I/R surgery–operated mice treated with vehicle or 50 mg/kg of 4EGI-1. *P<0.05 from control or sham. #P<0.05 from 2 weeks Rep Veh. For statistical analysis, 1-way ANOVA with Tukey post hoc analysis was used for A, B, G, H, and J through M. An unpaired 2-tailed t test was used for C. The log-rank test was used to test for differences between survival curves using GraphPad Prism 7.0 for I. P<0.05 was defined as significant difference. Error bars show SEM. D made in BioRender, biorender.com. Rep indicates reperfusion; TUNEL, terminal deoxynucleotidyl transferase dUTP nick end labeling; and Veh, vehicle.
Figure 5.
Figure 5.
Cell type–specific Ribo-Seq identifies the translational response of cardiomyocytes to reperfusion. A, Venn diagram of gene products detected in the transcriptome, translatome, and proteome of left ventricular lysates 2 days after I/R surgery in this study. B and C, Gene-based scatterplot showing the correlation between RNA-seq (blue, B) and Ribo-Seq (red, C) expression levels and protein abundance by mass spectrometry. Correlation coefficients are Pearson r values. D, Scatterplot of Ribo-Seq vs RNA-seq in sham- and I/R-operated mice 2 days after surgery. Transcripts were considered significant when false discovery rate <0.01. Gray dots indicate no significant change. Significant change at translational level is shown in red, at transcriptional level in blue, and regulation at both translational and transcriptional levels in green. n≥3 for each time point. E, Enrichment of GO terms for translationally up- and downregulated transcripts in cardiomyocytes 2 days after reperfusion. The 8 most significant GO terms per group are displayed. F, Unbiased clustering analysis of RNA-seq and Ribo-Seq of differently expressed genes 2 days after I/R surgery. Different colors indicate different clusters. Enriched GO terms containing >5 significantly regulated genes/transcripts are shown on the right for each cluster. G, Cumulative fraction of all detected transcripts and detected cardiac mTOR-dependent mRNAs relative to their fold change of RNA-seq (top) or Ribo-Seq (bottom). Cardiac mTOR-dependent mRNAs were defined as genes with a heart-specific terminal oligopyrimidine (TOP) score ≥2 from Philippe et al that were expressed in the RNA-seq and Ribo-Seq datasets of this study. RNA-seq Sham n=5, RNA-seq Rep n=3, Ribo-Seq Sham n=5, Ribo-Seq Rep n=3, mass spectrometry Sham=2, mass spectrometry Rep n=3. Detailed information on statistical analysis can be found in the Supplemental Methods. IR indicates ischemia/reperfusion; Rep, reperfusion; and RNA-seq, RNA sequencing.
Figure 6.
Figure 6.
Inhibition of mTORC1-4EBP1-eIF4F–dependent translation during reperfusion attenuates cardiac Ccl2 expression and proinflammatory Ly6Chigh monocyte infiltration. A through D, Flow-cytometry based enumeration of leukocytes (A), neutrophiles (B), Ly6Chigh monocytes (C), and Ly6Clo/F40+ macrophages (D) per milligram of heart tissue 2 days after sham or I/R surgery in animals treated with vehicle, 2 and 6 mg/kg of rapamycin, or 50 mg/kg of 4EGI-1, n=3–8. E, mRNA levels of selected inflammatory genes of left ventricular lysates 2 days after sham or I/R surgery in animals treated with vehicle, 2 and 6 mg/kg of rapamycin, or 50 mg/kg of 4EGI-1 measured by RT-qPCR, n=6–9. F, Scatter plot of Ribo-Seq vs RNA-seq in sham- and I/R-operated mice 2 days after surgery highlighting Ccl2 expression (red). G and H, RNA-seq and Ribo-Seq expression data of Ccl2 in sham and I/R-operated mice, n=3–5. I and J, Ccl2 mRNA levels, measured by RT-qPCR n=6–9 (I) and Ccl2 protein levels, immunoblot, n=2–4 (J) of left ventricular lysates 2 days after sham or I/R surgery in animals treated with vehicle, 2 and 6 mg/kg rapamycin, or 50 mg/kg 4EGI-1. K, Representative Ccl2 (pink) and troponin T (green) immunostaining and respective quantifications of the border zone of mice 24 hours after sham or I/R surgery that were treated with vehicle or 50 mg/kg 4EGI-1, n=4; approximately 600 cells were counted per animal. High magnifications show a perinuclear vesicular staining pattern for Ccl2. L through N, Fluorescence-activated cell sorting (FACS) quantification of Ccl2-positive Ly6Chi monocytes (L), representative Ccl2 monocyte histogram (M), and quantification of median Ccl2 intensity of Ccl2-positive Ly6Chi monocytes (N) of vehicle or 4EGI-1–treated mice 48 hours after I/R surgery. *P<0.05 from sham. #P<0.05 from 2 days Rep Veh. ×P<0.05 from 2 days Rep Rapa. For statistical analysis, 1-way ANOVA with Tukey post hoc analysis was used for A through E and I through K. An unpaired 2-tailed t test was used for G, H, L, and N. P<0.05 was defined as significant difference. Error bars show SEM. CPM indicates count per million; Rep, reperfusion; RNA-seq, RNA sequencing; and Veh, vehicle.
Figure 7.
Figure 7.
eIF4F-dependent expression of the chemokine Ccl2 in border zone cardiomyocytes. A, Uniform manifold approximation and projection (UMAP) map indicating the expression of Ccl2 in different identified cardiac cell populations. Data are shown as normalized transcript counts on a color-coded linear scale. Different cell populations are highlighted by colored circles. B through F, Violin plots showing the mRNA expression of Ccl2 in all cells (B), cardiomyocytes (C), fibroblasts (D), endothelial cells (E), and immune cells (F) in sham mice or after increasing time points after reperfusion. According to Seurat LogNormalize, gene expression measurements for each cell are normalized to total expression, multiplied by a scaling factor of 10 000, and log-transformed. G, Annotation of mouse heart regions after myocardial infarction (MI) through short-read clustering. UMAP representation of regions (top) and expression of Ccl2 in the respective regions (bottom). H through J, Dot plot showing the expression of Ccl2 across all inferred cells (H), across the infarct, border zone, and remote area for all cells (I), and across the infarct, border zone, and remote area only for cardiomyocytes (J). K, Ccl2 media levels of ARCMs after sI/R (1 hour ischemia and increasing times of reperfusion). L, Ccl2 media levels of ARCMs treated with vehicle or 100 µM 4EGI-1 after sI/R (1 hour ischemia and 6 hours reperfusion). Treatment was initiated with reperfusion. M, Representative immunoblot of input and human influenza hemagglutinin (HA)–Rpl22 immunoprecipitation of border zone lysates 2 days after sham or I/R surgery in animals treated with AAV9-Ctr or AAV9-4EBP1, confirming successful precipitation and 4EBP1 overexpression in cardiomyocytes. N, Ccl2 mRNA levels of cardiac border zone lysates 2 (left) and quantification of Rpl22-associated Ccl2 mRNA levels—indicative of active translation of Ccl2 transcripts—of border zone lysates (right) 2 days after sham or I/R surgery in animals treated with AAV9-Ctr or AAV9-4EBP1. O, Quantification of polysome-associated Ccl2 mRNA transcript levels normalized to polysome-associated Hprt transcript levels. All polysome-associated mRNA levels were normalized to their respective input (cell lysate) mRNA levels. n=4. P, Serum Ccl2 levels 2 days after reperfusion after cardiomyocyte-specific 4EBP1 overexpression in AAV9-Ctr or AAV9-4EBP1–treated mice. *P<0.05 from sham. #P<0.05 from 2 days Rep AAV9-Ctr. A through F, Generated from publicly available mouse single-cell transcriptomics data published by Molenaar et al. G through J, Generated from publicly available full-length spatial transcriptomics data published by Boileau et al. For statistical analysis, 1-way ANOVA with Tukey post hoc analysis was used for K, N, and P. P<0.05 was defined as significant difference. An unpaired 2-tailed t test was used for L and O. Error bars show SEM. Detailed information on the statistical analysis of scRNA-seq and full-length spatial transcriptomics data can be found in the Supplemental Methods. ARCM indicates adult rat cardiomyocyte; Ctr, control; IP, immunoprecipitation; Rep, reperfusion; and Veh, vehicle.
Figure 8.
Figure 8.
A direct immunosuppressive effect of eIF4F inhibition on circulating monocytes. A and B, Diagram (A) and quantification (B) of Ccl2 from perfusion media after ex vivo cardiac I/R surgery. C through E, Line graphs and respective visualization of end point measurements as bar/dot plot of heart rate (HR; C), and total (D) and relative (E) evolution of left ventricular developed pressure (LVDevP) of ex vivo I/R-operated hearts perfused with media containing vehicle (DMSO), 10 μM 4EGI-1, or 25 μM 4EGI-1. F, Diagram of experimental strategy to investigate the direct effect of rapamycin or 4EGI-1 on circulating CD11b+ cells and its impact on immune cell infiltration to the heart. G through I, Quantification of transplanted CD45.1 donor leukocyte (G), monocyte (H), and neutrophil (I) infiltration to the reperfused heart of CD45.2 recipient mice 2 days after I/R surgery by flow cytometry–based enumeration. Fluorescence-activated cell sorting (FACS) analysis was performed of left anterior wall lysates of CD45.2 recipient mice to enrich for infiltrated immune cells. Isolated cells of all donor mice were pooled and equally divided across each treatment group. One donor mouse was used per 2 recipient mice. Approximately 300 000 isolated living cells were injected to each recipient mouse. Isolated cells were ex vivo pretreated with 100 nM rapamycin, 100 µM 4EGI-1, or DMSO as a vehicle for 3 hours at room temperature. *P<0.05 from Veh or 2 days Rep Veh. For statistical analysis, 1-way ANOVA with Tukey post hoc analysis was used for B through E and G through I. A and F made in BioRender, biorender.com. Rep indicates reperfusion; and Veh, vehicle.

References

    1. Tsao CW, Aday AW, Almarzooq ZI, Alonso A, Beaton AZ, Bittencourt MS, Boehme AK, Buxton AE, Carson AP, Commodore-Mensah Y, et al. . Heart disease and stroke statistics—2022 update: a report from the American Heart Association. Circulation. 2022;145:e153–e639. doi: 10.1161/CIR.0000000000001052 - PubMed
    1. Ibanez B, James S, Agewall S, Antunes MJ, Bucciarelli-Ducci C, Bueno H, Caforio ALP, Crea F, Goudevenos JA, Halvorsen S, et al. ; ESC Scientific Document Group. 2017 ESC guidelines for the management of acute myocardial infarction in patients presenting with ST-segment elevation: the Task Force for the Management of Acute Myocardial Infarction in Patients Presenting with ST-Segment Elevation of the European Society of Cardiology (ESC). Eur Heart J. 2018;39:119–177. doi: 10.1093/eurheartj/ehx393 - PubMed
    1. Heusch G. Myocardial ischaemia–reperfusion injury and cardioprotection in perspective. Nat Rev Cardiol. 2020;17:773–789. doi: 10.1038/s41569-020-0403-y - PubMed
    1. Algoet M, Janssens S, Himmelreich U, Gsell W, Pusovnik M, Van den Eynde J, Oosterlinck W. Myocardial ischemia-reperfusion injury and the influence of inflammation. Trends Cardiovasc Med. 2023;33:357–366. doi: 10.1016/j.tcm.2022.02.005 - PubMed
    1. Schwanhäusser B, Busse D, Li N, Dittmar G, Schuchhardt J, Wolf J, Chen W, Selbach M. Global quantification of mammalian gene expression control. Nature. 2011;473:337–342. doi: 10.1038/nature10098 - PubMed

MeSH terms