. 2024 Oct;11(40):e2405432.
doi: 10.1002/advs.202405432. Epub 2024 Aug 29.

A Novel Antigen Design Strategy to Isolate Single-Domain Antibodies that Target Human Nav1.7 and Reduce Pain in Animal Models

Affiliations

A Novel Antigen Design Strategy to Isolate Single-Domain Antibodies that Target Human Nav1.7 and Reduce Pain in Animal Models

Marzia Martina et al. Adv Sci (Weinh). 2024 Oct.

Abstract

Genetic studies have identified the voltage-gated sodium channel 1.7 (Nav1.7) as pain target. Due to the ineffectiveness of small molecules and monoclonal antibodies as therapeutics for pain, single-domain antibodies (VHHs) are developed against the human Nav1.7 (hNav1.7) using a novel antigen presentation strategy. A 70 amino-acid peptide from the hNav1.7 protein is identified as a target antigen. A recombinant version of this peptide is grafted into the complementarity determining region 3 (CDR3) loop of an inert VHH in order to maintain the native 3D conformation of the peptide. This antigen is used to isolate one VHH able to i) bind hNav1.7, ii) slow the deactivation of hNav1.7, iii) reduce the ability of eliciting action potentials in nociceptors, and iv) reverse hyperalgesia in in vivo rat and mouse models. This VHH exhibits the potential to be developed as a therapeutic capable of suppressing pain. This novel antigen presentation strategy can be applied to develop biologics against other difficult targets such as ion channels, transporters and GPCRs.

Keywords: VHH; automated patch‐clamp system; epitope; mouse OD1 model; pain; rat Hargreaves model; surface plasmon resonance.


Conflict of interest statement

The authors declare no conflict of interest.

Figures
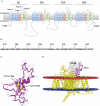
Figure 1
Figure 1
Location, sequence and structure of selected epitope on human Nav1.7 channel. A) Schematic representation of channel structure. B) Amino‐acid sequence of extracellular Loop 3 of domain DI (DIE3) with selected epitope in bold (Uniprot ID Q15858). C) Modeled 3D structure of DIE3 loop including two disulfide bonds (labeled). D) 3D‐location of DIE3 loop (purple) relative to cell membrane (red/blue planes) shown on the cryo‐EM structure (PDB ID 5XSY) of the homologous electric eel Nav1.4 channel alpha subunit (yellow) complexed with β1 subunit (gray surface).
Figure 2
Figure 2
Immunogen design by DIE3 loop grafting into nanobody framework. A) 3D molecular model of human Nav1.7 DIE3 loop. The flexible termini located outside the indicated positions were removed for grafting. The distance between the new loop termini is indicated. B) 3D molecular model of the VHH FC5 nanobody with the hypervariable CDR3 loop highlighted in black. The inner region of the CDR3 loop between indicated positions was removed for grafting. The distance between the receiving anchors on the FC5 nanobody matches the distance between the selected termini of the DIE3IR loop graft. C) 3D molecular model of the designed immunogen including 70 amino‐acid residues of the DIE3IR (purple) grafted on the FC5 nanobody framework (gray). Seven amino‐acid residues from the original CDR3 of FC5 were retained (black), 3 on the N‐terminal side and 4 on the C‐terminal side of the grafted DIE3IR peptide. D) Amino‐acid sequence of the recombinant designed immunogen construct with the signal peptide in brackets and the DIE3 sequence highlighted in bold.
Figure 3
Figure 3
Effect of the application of VHH DI‐D on the kinetics of the Nav1.7 currents recorded using SyncroPatch 384PE in HEK293 cells overexpressing hNav1.7 channels. Families of Nav1.7 currents recorded in voltage‐clamp using SyncroPatch 384PE in control A) and in presence of 2 µm VHH DI‐D B). C) Current–voltage (I–V) relationships showing peak current amplitude in control (full square; n = 278) and in the presence of VHH DI‐D (empty circles; n = 268). D) Activation and fast inactivation traces. E) Steady state slow inactivation. F) Voltage dependence of the deactivation currents decay. The inset displays an example of deactivation tail currents with superimposed voltage‐clamp protocol. G) Voltage dependence of time to peak. H) Voltage dependence of inactivation time constant. Statistics shown as mean ± SEM.
Figure 4
Figure 4
Effect of VHH DI‐D and DI‐D/FC5‐DIE3IR competition in the OD1‐induced mouse model of Nav1.7‐mediated pain. A) Intraplantar administration of VHH DI‐D (3.07, 4.61, and 6.15 nmol) reversed spontaneous pain behaviors in mice evoked by OD1 in a concentration‐dependent manner. OD1 was injected 60 min after VHH DI‐D administration and pain behaviors, as evidenced by licking, flinching, lifting and shaking of the injected hind paw (quantified in 5 min intervals). B) Total cumulative positive nociceptive behaviors during the 20 min study in the presence of saline or increasing concentrations of VHH DI‐D in the OD1 model. C) Competition study using FC5‐DIE3IR, the recombinant protein used as an immunogen for the generation of the Nav1.7 single domain antibodies. DI‐D / FC5‐DIE3IR were pre‐mixed 30 min prior to injection. OD1 was injected 60 min after saline, VHH DI‐D, DI‐D/FC5‐DIE3IR or A20.1 (negative control) administration and pain behaviors were quantified in 5 min intervals. D) Total cumulative positive nociceptive behaviors during the 20 min study in the presence of saline, VHH DI‐D, DI‐D/FC5‐DIE3IR or A20.1 in the OD1 model. Data are shown as mean ± SEM of 4 – 6 mice per group. *p < 0.05 versus saline + OD1.
Figure 5
Figure 5
Effect of VHH DI‐D administered by intraplantar, intrathecal and, intraplantar and intrathecal routes in the OD1‐induced mouse model of Nav1.7‐mediated pain. A) Effect of intraplantar administration of saline, VHH DI‐D (4.61 nmol) or PF05089771 (5 nmol) on spontaneous pain behaviors in mice evoked by OD1. OD1 was injected 30 min after test compound administration and pain behaviors, as evidenced by licking, flinching, lifting, and shaking of the injected hind paw were quantified in 5 min intervals. B) Total cumulative positive nociceptive behaviors during the 20 min study in the presence of saline, VHH DI‐D (4.61 nmol) or PF05089771 (5 nmol) in the OD1 model. C) Effect of intrathecal administration of VHH A20.1, VHH DI‐D (0.615 nmol) or PF05089771 (3.075 nmol) on spontaneous pain behaviors in mice evoked by OD1. OD1 was injected 30 min after test compound administration and pain behaviors were quantified in 5 min intervals. D) Total cumulative positive nociceptive behaviors during the 20 min study in the presence of VHH A20.1, VHH DI‐D (4.61 nmol) or PF05089771 (5 nmol) in the OD1 model. E) Effect of intraplantar (ipl) and intrathecal (it) co‐administration of VHH A20.1 or VHH DI‐D (ipl, 4.6 nmol; it, 0.615 nmol,) and comparison with VHH DI‐D administered by intraplantar route only on spontaneous pain behaviors in mice evoked by OD1. OD1 was injected 30 min after test compound administration and pain behaviors were quantified in 5 min intervals. F) Total cumulative positive nociceptive behaviors during the 20 min study of VHH A20.1 and VHH DI‐D co‐injected by intraplantar and intrathecal route and comparison with VHH DI‐D injected by intraplantar route only in the OD1 model. Data are shown as mean ± SEM of 4–6 mice per group. *p < 0.05 versus saline + OD1 or saline + A20.1 + OD1.
Figure 6
Figure 6
HDX‐MS protection highlights VHH DI‐D epitope within DIE3IR. A) Projection of HDX findings on a homology model of the FC5‐DIE3IR immunogen based a known DIE3 loop structure (PDB ID 6J8G). Regions where a significant change in HDX (> 2 SD cut‐off, p‐value 0.05) was measured upon binding of VHH DI‐D across at least two overlapping peptides are shown in blue, non‐significant changes are shown in green and grey for the DIE3IR loop and FC5 scaffold domains, respectively. Residues with missing sequence coverage are shown in white. Disulfide bonds are shown as yellow sticks. B) Overall view of HDX overlayed on channel architecture based on a recent cryo‐EM structure of the human hNav1.7 channel (PDB 7W9K).[ 28 ] Structural regions are highlighted, including the α‐subunit (grey), β1 subunit (magenta), and the DIE3IR loop (green) with its HDX‐mapped VHH DI‐D epitope (blue). Key interacting residues between a and b subunits of the hNav1.7 channel are shown as sticks.
Figure 7
Figure 7
In vivo biodistribution of VHH A20‐CF770 or VHH DI‐D‐CF770 intravenously injected (0.4 mg kg−1) in naïve mice. A) In vivo dorsal (left) and ventral (right) images of the whole mouse body at various time points (10 min, 30 min 1 h, 2 h, 4 h, 6 h and 24 h) after intravenous injection of VHH A20.1‐CF770. B) In vivo dorsal (left) and ventral (right) images of the whole mouse body at various time points (10 min, 30 min 1 h, 2 h, 4 h, 6 h and 24 h) after intravenous injection of VHH DI‐D‐CF770. C–H) Ex vivo tissue biodistribution of VHH A20.1‐CF770 and VHH DI‐D‐CF770 intravenously injected (0.4 mg kg−1) in naïve mice. (C, D) Bar graph illustrating the total radiant efficiency in various organs (brain, heart, lung, liver, spleen kidney) ex vivo at 6 h (C) and 24 h (D) after intravenous injection of VHH A20.1‐CF770 or VHH DI‐D‐CF770, followed by saline perfusion and animal sacrifice. Representative ex vivo optical images of various organs (brain, heart, lung, liver, spleen, kidney) at 6 h (C1, C2) and 24 h (D1, D2) after intravenous injection of VHH A20.1‐CF770 or VHH DI‐D‐CF770, followed by saline perfusion and animal sacrifice. (E, F) Bar graph illustrating the total radiant efficiency in more difficult to access organs (spine, thyroid, skeletal muscle, testes) ex vivo at 6 h (E) and 24 h (F) after intravenous injection of VHH A20.1‐CF770 or VHH DI‐D‐CF770, followed by saline perfusion and animal sacrifice. Representative ex vivo optical images of various organs (spine, thyroid, skeletal muscle, testes) at 6 h (E1, E2) and 24 h (F1, F2) after intravenous injection of VHH A20.1‐CF770 or VHH DI‐D‐CF770, followed by saline perfusion and animal sacrifice. (G, H) Bar graph illustrating the total radiant efficiency in various lymph nodes ex vivo at 6 h (G) and 24 h (H) after intravenous injection of VHH A20.1‐CF770 or VHH DI‐D‐CF770, followed by saline perfusion and animal sacrifice. Representative ex vivo optical images of various lymph nodes at 6 h (G1, G2) or 24 h (H1, H2) after intravenous injection of VHH A20.1‐CF770 or VHH DI‐D‐CF770, followed by saline perfusion and animal sacrifice. Abbreviations: Brain (B), Heart (H), Lung (L), Liver (Lv), Spleen (S), Kidney (K), Mandibular (M), Axial/Brachial (A/B), Inguinal (I), Mesenteric (Ms), Popliteal (P), Spine (Sp), Thyroid (T), Skeletal Muscle (Mus), Testes (Tes). Data is presented as mean ± SEM, n = 3 mice per group and time point.
Figure 8
Figure 8
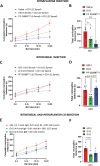
Efficacy of VHH DI‐D in pain models. A,B) VHH DI‐D‐induced reversal of thermal hyperalgesia in the Hargreaves model of inflammatory pain in rats. (A) Latency paw withdrawal of inflamed paw to a thermal stimulus was measured pre CFA injection, 24 h post CFA injection, and 0 (48 h post CFA injection), 1, 2, and 4 h after intraplantar injection of saline (50 µL), VHH DI‐D (50 and 100 µg, 3.07 nmol and 6.15 nmol, respectively in a volume of 50 µL), the negative control VHH A20.1 (50 and 100 µg, 3.19 nmol and 6.38 nmol, respectively in a volume of 50 µL) and the selective blocker for hNav1.7 channels, TC‐N1752 (100 µg, 193.9 nmol in a volume of 50 µL). (B) Area under the curve (AUC) of the paw withdrawal latency from each group expressed as a percentage of maximal possible effect (%MPE) over time (h). Data are shown as mean ± SEM of 4–11 rats per group. C,D) Time course of the antinociceptive effect of VHH DI‐D in the formalin test in mice. (C) VHH DI‐D (0.615 nmol, in a volume of 5 µL), VHH A20.1 (0.615 nmol, in a volume of 5 µL), the positive control PF 05089771 (0.61 nmol, in a volume of 5 µL) or saline were injected by intrathecal route 30 min prior to formalin (2.5%) intraplantar injection. (D) Bar graph showing the area under the curve (AUC) of the positive behaviors observed from 10 to 60 min post formalin injection. Data are shown as mean ± SEM of 5–6 mice per group. E) Effect VHH DI‐D on mechanical allodynia induced by the spared nerve injury (SNI) model in rats. Time‐course of paw withdrawal threshold was measured by von Frey hair stimulation at 1, 2, 4, and 24 h after intrathecal injection of VHH DI‐D (0.615 nmol, in a volume of 5 µL) or the negative control VHH A20.1 (0.615 nmol, in a volume of 5 µL). Data are shown as mean ± SEM of 3–4 rats per group. *p < 0.05 versus VHH A20.1.
Figure 9
Figure 9
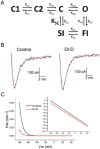
Kinetic model and simulation of Nav1.7 currents. A) Kinetic model of Nav1.7 channel. The kinetic scheme consists of three closed states (C1, C2, and C), one open state (O), one fast inactivated state (FI) and one slow inactivated state (SI). B) Nav1.7 current curves. The solid lines represent the Nav1.7 currents recorded in patch clamp in control and in presence of DI‐D following a voltage step at −30 mV from a Vm of −120 mV. The red dashed lines represent the currents simulated according to the kinetic scheme in A. C) Voltage dependence of the rate constant KSC of the transition from the SI to the C. KSC values were calculated after the micro‐reversibility relationship within the C – O – FI – SI loop. The semi‐log plot in the inset shows that in the range of voltages between −80 and +40 mV, the transition KSC is slower in presence of VHH DI‐D.
Figure 10
Figure 10
Effect of VHH DI‐D on the ability of DRG neurons to elicit action potentials A,B) and on the deactivation kinetics of DRG Nav current C,D). (A) Action potentials (APs) were evoked from small (<20 µm in diameter) DRG neurons by injecting currents from Vmrest in control (left) and in presence of VHH DI‐D 2 µm (right). (B) Histograms of values for Vmrest (Control, −53.4 ± 1.41 mV; VHH DI‐D −52.7 ± 2.04 mV; n = 8, p = 0.3), AP amplitude (Control 85.82 ± 3.38 mV; VHH DI‐D 77.14 ± 3.47 mV, n = 8; p = 0.0018), AP threshold (Control, −32.56 ± 0.93 mV; VHH DI‐D, −30.2 ± 1.34 mV, n = 8; p = 0.003) and AP overshoot (Control, 53.35 ± 2.56 mV; VHH DI‐D 46.77 ± 3.47 mV; n = 8; p = 0.004) in control (white) and in presence of VHH DI‐D. n.s.: not significant. *Significant. (C) Example of deactivation tail currents with superimposed voltage‐clamp protocol. (D) Voltage dependence of the deactivation currents decay.

References

    1. Catterall W. A., Goldin A. L., Waxman S. G., Pharmacol. Rev. 2005, 57, 397. - PubMed
    1. Savio‐Galimberti E., Gollob M. H., Darbar D., Front. Pharmacol. 2012, 3, 124. - PMC - PubMed
    1. Bennett D. L., Clark A. J., Huang J., Waxman S. G., Dib‐Hajj S. D., Physiol. Rev. 2019, 99, 1079. - PubMed
    1. Dib‐Hajj S. D., Waxman S. G., Annu. Rev. Neurosci. 2019, 42, 87. - PubMed
    1. Dib‐Hajj S. D., Yang Y., Black J. A., Waxman S. G., Nat. Rev. Neurosci. 2013, 14, 49. - PubMed

MeSH terms

LinkOut - more resources