. 2024 Oct;11(40):e2405421.
doi: 10.1002/advs.202405421. Epub 2024 Aug 29.

Hypoxic Upregulation of IER2 Increases Paracrine GMFG Signaling of Endoplasmic Reticulum Stress-CAF to Promote Chordoma Progression via Targeting ITGB1

Affiliations

Hypoxic Upregulation of IER2 Increases Paracrine GMFG Signaling of Endoplasmic Reticulum Stress-CAF to Promote Chordoma Progression via Targeting ITGB1

Tao-Lan Zhang et al. Adv Sci (Weinh). 2024 Oct.

Abstract

Currently, the oncogenic mechanism of endoplasmic reticulum stress-CAF (ERS-CAF) subpopulation in chordoma remains unknown. Here, single-cell RNA sequencing, spatial transcriptomics, GeoMx Digital Spatial Profiler, data-independent acquisition proteomics, bulk RNA-seq, and multiplexed quantitative immunofluorescence are used to unveil the precise molecular mechanism of how ERS-CAF affected chordoma progression. Results show that hypoxic microenvironment reprograms CAFs into ERS-CAF subtype. Mechanistically, this occurrs via hypoxia-mediated transcriptional upregulation of IER2. Overexpression of IER2 in CAFs promotes chordoma progression, which can be impeded by IER2 knockdown or use of ERS inhibitors. IER2 also induces expression of ERS-CAF marker genes and results in production of a pro-tumorigenic paracrine GMFG signaling, which exert its biological function via directly binding to ITGB1 on tumor cells. ITGB1 inhibition attenuates tumor malignant progression, which can be partially reversed by exogenous GMFG intervention. Further analyses reveal a positive correlation between ITGB1high tumor cell counts and SPP1+ macrophage density, as well as the spatial proximity of these two cell types. Clinically, a significant correlation of high IER2/ITGB1 expression with tumor aggressive phenotype and poor patient survival is observed. Collectively, the findings suggest that ERS-CAF regulates SPP1+ macrophage to aggravate chordoma progression via the IER2/GMFG/ITGB1 axis, which may be targeted therapeutically in future.

Keywords: IER2/GMFG/ITGB1 axis; cancer‐associated fibroblasts; chordoma progression; endoplasmic reticulum stress; hypoxia; paracrine.


Conflict of interest statement

The authors declare no conflict of interest.

Figures

Figure 1
Figure 1
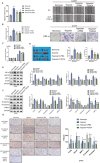
Hypoxic microenvironment promoted ERS response in CAFs of chordoma tissues. A) Representative image of normal fibroblasts (NFs) isolated from normal tissues adjacent to the tumors and cancer‐associated fibroblasts (CAFs) isolated from chordoma tissue; Immunofluorescence staining of α‐SMA and vimentin protein, confirming successful isolation of chordoma CAFs. B) Western blot and qRT‐PCR revealed the expression of hypoxia inducible factor‐1α (HIF‐1α) was significantly upregulated in CAFs under 1% hypoxia condition. C) Flow cytometry revealed the expression levels reactive oxygen species (ROS) was increased in CAF under hypoxic condition. D) Flow cytometry revealed the expression levels of superoxide dismutase (SOD) and catalase (CAT) were reduced, while the expression levels of malondialdehyde (MDA) was increased in CAF under hypoxic condition. E) Western blot and qRT‐PCR revealed ERS related genes (IRE1α, GRP78, XBP‐1, and CHOP) expression was increased in CAF under hypoxic condition.
Figure 2
Figure 2
ERS‐CAF promoted the malignant progression of chordoma. A) Wound healing assay shows enhanced migration ability of U‐CH1 chordoma cells co‐cultured with endoplasmic reticulum stress‐related CAF (ERS‐CAF), while blocking ERS response of CAF with 4‐phenylbutyric acid (4‐PBA) and tauroursodeoxycholic acid (TUDCA) reversed the above phenomenon. B) Transwell assay reveals increased invasion ability of U‐CH1 chordoma cells co‐cultured with ERS‐CAF, while blocking ERS response of CAF with 4‐PBA and TUDCA reversed the above phenomenon. C) Cell Counting Kit‐8 (CCK8) assay demonstrates enhanced proliferation activity of U‐CH1 chordoma cells co‐cultured with ERS‐CAF, while blocking ERS response of CAF with 4‐PBA and TUDCA reversed the above phenomenon. D) Macroscopic image of subcutaneous tumor formation in mice, indicating increased tumor weight and volume after co‐transplantation with U‐CH1 chordoma cells and ERS‐CAF, while blocking ERS response of CAF with 4‐PBA and TUDCA reversed the above phenomenon. E) Western blot (WB) and qRT‐PCR revealed ERS related genes expression was increased in subcutaneous tumor samples after co‐transplantation with U‐CH1 chordoma cells and ERS‐CAF, while blocking ERS response of CAF with 4‐PBA and TUDCA reversed the above phenomenon. F) WB and qRT‐PCR revealed EMT related proteins (including PCNA, TGF‐B1, N‐cadherin, and MMP‐2) expression were increased in subcutaneous tumor samples after co‐transplantation with U‐CH1 chordoma cells and ERS‐CAF, while blocking ERS response of CAF with 4‐PBA and TUDCA reversed the above phenomenon. G) Immunohistochemical analysis of tumor samples showed high expression of EMT‐related genes after co‐transplantation with U‐CH1 chordoma cells and ERS‐CAF, while blocking ERS response of CAF with 4‐PBA and TUDCA reversed the above phenomenon.
Figure 3
Figure 3
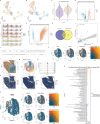
IER2 was associated with the hypoxic microenvironment in chordoma. A) UMAP projection of 15 fibroblast clusters across all samples. B) UMAP plot of normal fibroblasts, control CAFs, and hypoxic CAFs. C) Hypoxic CAFs had higher GSVA‐HALLMARK‐Hypoxia scores than control CAFs. D)Volcano plots for DEGs in hypoxic CAFs and control CAFs. E) GO enrichment analysis of up‐DEGs in hypoxic CAFs. F) Violin plot showing the expression levels of ERS‐CAF related DEGs for each fibroblast subpopulation. G) Volcano plots for DEGs in HALLMARK‐Hypoxia in bulk RNA‐seq data. H) DEGs upregulated in hypoxic CAFs from the scRNA‐seq data were intersected with DEGs from tumors with high hypoxic signature scores from the Bulk RNA‐seq data, identifying 28 overexpressed DEGs in CAFs induced by hypoxic conditions. I) Correlation between IER2 and HIF1A expression of Bulk RNA‐seq data. J) Using the eukaryotic promoter database prediction, a HIF1A high‐binding site was obtained at 85 bp upstream of the IER2 promoter. K) Spatial transcriptome (ST) data demonstrate strong spatial co‐expression between IER2 and HIF1A with significant spatial co‐expression coefficient. Color ranges blue (low) to yellow (high) represents correlation score. L) ST representation of chordoma tissue. M) After Seurat dimensionality reduction clustering analysis, 12 spatial clusters were obtained. N) Violin plot showing the expression levels of ERS‐CAF‐related DEGs in spatial cluster 5, indicating that spatial cluster 5 represents ERS‐CAF. O) Correlation between the spatial positions of IER2 and ERS‐CAF marker genes such as HSPA1A and DNAJB1. P) ST data showed strong spatial co‐expression between IER2 and ERS‐CAF marker genes such as HSPA1A and DNAJB1, with significant spatial co‐expression coefficients. Color ranges blue (low) to yellow (high) represent correlation score.
Figure 4
Figure 4
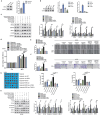
IER2 mediated CAF phenotypic transition to ERS subtype and promotes chordoma progression. A) WB and qPCR detection showed that IER2 was significantly overexpressed in chordoma CAF after hypoxia treatment. B) Establishment of IER2 knockdown and overexpression CAF cell lines. C) WB and qRT‐PCR showed that IER2 overexpression enhanced the ERS effect of CAF under hypoxic conditions, and IER2 knockdown or anti‐ERS blocker intervention could reverse this phenomenon. D) CCK8 assay demonstrates enhanced proliferation activity of U‐CH1 chordoma cells co‐cultured with CAFs having IER2 overexpression, while genetic knockdown of IER2 in CAF and administering with anti‐ERS agents reversed the above phenomenon. E) Wound healing assay shows enhanced migration ability of U‐CH1 chordoma cells co‐cultured with CAFs having IER2 overexpression, while genetic knockdown of IER2 in CAF and administering with anti‐ERS agents reversed the above phenomenon. F) Transwell assay reveals increased invasion ability of U‐CH1 chordoma cells co‐cultured with CAFs having IER2 overexpression, while genetic knockdown of IER2 in CAF and administering with anti‐ERS agents reversed the above phenomenon. G) Macroscopic image of subcutaneous tumor formation in mice, indicating increased tumor weight and volume after co‐transplantation with U‐CH1 chordoma cells and CAFs having IER2 overexpression, while genetic knockdown of IER2 in CAF and administering with anti‐ERS agents reversed the above phenomenon. H) WB and qRT‐PCR revealed EMT related proteins expression were increased in subcutaneous tumor samples after co‐transplantation with U‐CH1 chordoma cells and CAFs having IER2 overexpression, while genetic knockdown of IER2 in CAF and administering with anti‐ERS agents reversed the above phenomenon.
Figure 5
Figure 5
ERS‐CAF mediates the paracrine secretion of GMFG targeting ITGB1. A) Heatmap of DEGs for mRNA expression profiles of chordoma cells before (control) and after incubation with exogenous GMFG (GMFG‐treated). B) GeoMx Digital Spatial Profiler (DSP) transcriptome sequencing of 10 regions of interest (ROIs) with high (n = 5) and low (n = 5) expression of stromal IER2. C) ITGB1 is the only target gene common to the up‐regulated genes in both cell line mRNA sequencing and DSP sequencing. D) ITGB1 was significantly up‐regulated in the GMFG‐treated group. E) ITGB1 was significantly increased in ROIs with high expression of stromal IER2, and the expression of IER2 in ROIs was significantly positively correlated with the expression of ITGB1. F) WB and qRT‐PCR demonstrated that exogenous GMFG treatment significantly induced ITGB1 expression in tumor cells. G) Molecular docking demonstrated the existence of binding sites for ITGB1 and GMFG. H) GST pull‐down assay confirmed the existence of a targeted binding site between GMFG and ITGB1. I) Bulk RNA‐seq data demonstrate a significant positive correlation between GMFG and ITGB1 expression.
Figure 6
Figure 6
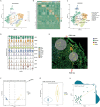
GMFG/ITGB1 axis might regulate the biological behavior of chordoma by mediating immunosuppression in the tumor microenvironment. A) UMAP projection of 11 macrophages clusters across all samples. B) Heatmap of top 10 DEGs per cluster for 11 macrophages clusters. C) UMAP projection of macrophage clusters named after specific marker genes in all samples. D) Violin plot showing the expression levels of 11 macrophages clusters, SPP1 displayed specifically high expression in tumor‐associated macrophage subcluster 0 and subcluster 5. E) GeoMx DSP transcriptome sequencing of 42 ROIs with high (n = 37) and low (n = 5) expression of tumoral ITGB1 expression. F) Volcano plots for DEGs in tumoral ITGB1 high expression ROIs and low expression ROIs. G) SPP1 was significantly upregulated in ROIs with high tumor ITGB1 expression. H) DSP data analysis showed that the expression of SPP1 and ITGB was significantly positively correlated.

References

    1. Stacchiotti S., Sommer J., Lancet Oncol. 2015, 16, e71. - PubMed
    1. Walcott B. P., Nahed B. V., Mohyeldin A., Coumans J.‐V., Kahle K. T., Ferreira M. J., Lancet Oncol. 2012, 13, e69. - PubMed
    1. Colia V., Stacchiotti S., Eur. J. Cancer 2017, 83, 220. - PubMed
    1. Meng T., Yin H., Li B., Li Z., Xu W., Zhou W., Cheng M., Wang J., Zhou L., Yang X., Liu T., Yan W., Song D., Xiao J., Neuro Oncol 2015, 17, 725. - PMC - PubMed
    1. Seeling C., Lechel A., Svinarenko M., Möller P., Barth T. F. E., Mellert K., J. Exp. Clin. Cancer Res. 2021, 40, 244. - PMC - PubMed

LinkOut - more resources