. 2024 Oct 16;15(10):e0179824.
doi: 10.1128/mbio.01798-24. Epub 2024 Aug 29.

High-throughput transposon mutagenesis in the family Enterobacteriaceae reveals core essential genes and rapid turnover of essentiality

Affiliations

High-throughput transposon mutagenesis in the family Enterobacteriaceae reveals core essential genes and rapid turnover of essentiality

Fatemeh A Ghomi et al. mBio. .

Abstract

The Enterobacteriaceae are a scientifically and medically important clade of bacteria, containing the model organism Escherichia coli, as well as major human pathogens including Salmonella enterica and Klebsiella pneumoniae. Essential gene sets have been determined for several members of the Enterobacteriaceae, with the Keio E. coli single-gene deletion library often regarded as a gold standard. However, it remains unclear how gene essentiality varies between related strains and species. To investigate this, we have assembled a collection of 13 sequenced high-density transposon mutant libraries from five genera within the Enterobacteriaceae. We first assess several gene essentiality prediction approaches, investigate the effects of transposon density on essentiality prediction, and identify biases in transposon insertion sequencing data. Based on these investigations, we develop a new classifier for gene essentiality. Using this new classifier, we define a core essential genome in the Enterobacteriaceae of 201 universally essential genes. Despite the presence of a large cohort of variably essential genes, we find an absence of evidence for genus-specific essential genes. A clear example of this sporadic essentiality is given by the set of genes regulating the σE extracytoplasmic stress response, which appears to have independently acquired essentiality multiple times in the Enterobacteriaceae. Finally, we compare our essential gene sets to the natural experiment of gene loss in obligate insect endosymbionts that have emerged from within the Enterobacteriaceae. This isolates a remarkably small set of genes absolutely required for survival and identifies several instances of essential stress responses masked by redundancy in free-living bacteria.IMPORTANCEThe essential genome, that is the set of genes absolutely required to sustain life, is a core concept in genetics. Essential genes in bacteria serve as drug targets, put constraints on the engineering of biological chassis for technological or industrial purposes, and are key to constructing synthetic life. Despite decades of study, relatively little is known about how gene essentiality varies across related bacteria. In this study, we have collected gene essentiality data for 13 bacteria related to the model organism Escherichia coli, including several human pathogens, and investigated the conservation of essentiality. We find that approximately a third of the genes essential in any particular strain are non-essential in another related strain. Surprisingly, we do not find evidence for essential genes unique to specific genera; rather it appears a substantial fraction of the essential genome rapidly gains or loses essentiality during evolution. This suggests that essentiality is not an immutable characteristic but depends crucially on the genomic context. We illustrate this through a comparison of our essential genes in free-living bacteria to genes conserved in 34 insect endosymbionts with naturally reduced genomes, finding several cases where genes generally regarded as being important for specific stress responses appear to have become essential in endosymbionts due to a loss of functional redundancy in the genome.

Keywords: Citrobacter; Enterobacteriaceae; Escherichia coli; Klebsiella; Salmonella; gene essentiality; transposon mutagenesis.


Conflict of interest statement

The authors declare no conflict of interest.

Figures

Fig 1
Fig 1
Overview of a collection of TraDIS libraries for five genera within the Enterobacteriaceae. (A) Overview of TraDIS experiments performed to identify essential genes. A random Tn5 library is generated and selected on solid antibiotic medium, before being sequenced using transposon-specific primers. Essential genes are identified by depletion of identified insertion sites (see text and methods for details). (B) An estimated tree showing phylogenetic relationships between the strains used in this study. The tree was constructed using RAxML (28) on a concatenated set of single-copy core genes (29) (see Methods). The TraDIS libraries first reported here are in bold font. (C) Genome alignment for all the genomes in this study compared to E. coli BW25113 from Keio collection (16), generated with BRIG (30). The genomes from the inner circle to the outer circle are E. coli BW25113, E. coli UPEC ST131 EC958, E. coli UPEC ST131, S. Typhimurium A130, S. Typhimurium D23580, S. Typhimurium SL3261, S. Typhimurium SL1344, S. Enteritidis P125109, S. Typhi Ty2, C. rodentium ICC168, E. cloacae NCTC 9394, K. pneumoniae Ecl8, and K. pneumoniae RH201207, respectively.
Fig 2
Fig 2
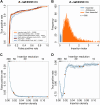
Assessing gene essentiality predictions. (A) Receiver operating characteristic (ROC) curves show the accuracy of six methods for predicting essential genes. True positives are genes that are predicted as essential for E. coli K-12 BW25113 by TraDIS and classified as essential in EcoGene. False positives are genes that are predicted as essential but are classified as non-essential in EcoGene. Genes for which the Monte Carlo method returned NA were omitted from this comparison. (B) The bimodal distribution of insertion indices illustrates essentiality classification using DBSCAN. Essential genes have the lowest insertion indices, non-essential genes have higher insertion indices, and ambiguous genes are located between these groups. (C and D) Simulation of insertion density effects: The orange triangles and gray dots are obtained from real and down-sampled data from S. Typhimurium SL1344, respectively. The blue lines show loess curves with 0.2 span, and the light blue regions show 95% confidence intervals. Insertion resolution is calculated by dividing genome length by the number of unique insertion sites. The false-positive rate decreases with increasing insertion density (number of insertions divided by genome length) and remains constant after it reaches 0.04, or approximately one insertion every 25 bases (C). The true-positive rate converges around an insertion density of ~0.03, or approximately one insertion every 30 bases (D). The false-positive and true-positive rates are calculated by comparing predicted essential genes with the EcoGene database.
Fig 3
Fig 3
An analysis of putative sources of bias in TraDIS data. (A) The average insertion index for each length percentile of all essential genes from TraDIS data. The genes are divided into three segments: 5% of the gene length on the 5′ end (dark red), 20% of the gene length on the 3′ end (orange), and the rest in the middle (gray). (B) Number of insertions and their location in the RNase E gene in Klebsiella pneumoniae RH201207. The 5′ end of the gene is located on the left-hand side. There are no insertions in the nuclease domain predicted by Pfam (49). (C) The insertion index versus the distance from the dnaA gene (usually found near the origin of replication). The blue curve shows a fitted GAM (Generalized Additive Model) curve, and the shading shows the 95% confidence interval. (D) Sequence logo plots generated using sequences from the 10 nucleotides flanking the 100 topmost frequent insertion sites from each genome. Character height represents frequency (top) or information content per position (bottom), calculated by multiplying the frequency of each base by the total information content of the position in bits. (E) Insertion index versus G-C content of genes. The blue curve shows the fitted GAM curve, and the shading shows the 95% confidence interval.
Fig 4
Fig 4
The ancestral and core essential genomes of Enterobacteriaceae. (A) Left, reconstruction of the ancestral essential genome. Numbers on branches indicate the number of reconstructed essential genes (blue) compared to the total number of genes reconstructed to be present (black) on each ancestral branch. Right, upset plot illustrating the overlap of essential genes between strains. Overlaps with <5 essential genes are not shown. (B) Venn diagram comparing the ancestral and core essential gene sets to genes designated essential in EcoGene. (C) Heatmaps illustrating variable gene essentiality across the Enterobacteriaceae. Essentiality scores are indicated by color; blue indicates essentiality while orange indicates non-essentiality. Left, 24 genes essential in EcoGene and ancestrally essential, but not core essential, with clear evidence for non-essentiality (essentiality score >1) in at least one strain in the collection. Center, genes involved in the σE response. Right, genes with genus-associated essentiality as determined by a permutation test (P < 0.05).
Fig 5
Fig 5
Comparing gene essentiality in free-living Enterobacteriaceae to conservation in reduced genomes. (A) Venn diagram comparing ancestral and core essential gene sets to genes classified as core endosymbiont genes. Core endosymbiont core genes are defined as those universally conserved across a set of 34 endosymbiont genomes from within the family Enterobacteriaceae. (B) Barplot for gene set overrepresentation analysis of KEGG pathways in the four essential gene classes. Bars depict FDR-adjusted hypergeometric P-values of significantly enriched pathways (P(adj) < 0.01) per gene class. All pathways with at least one significantly overrepresented class are shown. The dotted gray line shows the significance threshold (P(adj)= 0.01).

References

    1. Rancati G, Moffat J, Typas A, Pavelka N. 2018. Emerging and evolving concepts in gene essentiality. Nat Rev Genet 19:34–49. doi:10.1038/nrg.2017.74 - DOI - PubMed
    1. Mushegian AR, Koonin EV. 1996. A minimal gene set for cellular life derived by comparison of complete bacterial genomes. Proc Natl Acad Sci U S A 93:10268–10273. doi:10.1073/pnas.93.19.10268 - DOI - PMC - PubMed
    1. Koonin EV. 2000. How many genes can make a cell: the minimal-gene-set concept. Annu Rev Genomics Hum Genet 1:99–116. doi:10.1146/annurev.genom.1.1.99 - DOI - PMC - PubMed
    1. Juhas M, Eberl L, Church GM. 2012. Essential genes as antimicrobial targets and cornerstones of synthetic biology. Trends Biotechnol 30:601–607. doi:10.1016/j.tibtech.2012.08.002 - DOI - PubMed
    1. Payne DJ, Gwynn MN, Holmes DJ, Pompliano DL. 2007. Drugs for bad bugs: confronting the challenges of antibacterial discovery. Nat Rev Drug Discov 6:29–40. doi:10.1038/nrd2201 - DOI - PubMed

MeSH terms

Substances