Live-Cell Invasive Phenotyping Uncovers ALK2 as a Therapeutic Target in LKB1-Mutant Lung Cancer
- PMID: 39207369
- PMCID: PMC11565166
- DOI: 10.1158/0008-5472.CAN-23-2631
Live-Cell Invasive Phenotyping Uncovers ALK2 as a Therapeutic Target in LKB1-Mutant Lung Cancer
Abstract
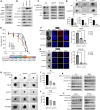
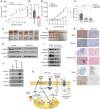
The acquisition of invasive properties is a prerequisite for tumor progression and metastasis. Molecular subtypes of KRAS-driven lung cancer exhibit distinct modes of invasion that contribute to unique growth properties and therapeutic susceptibilities. Despite this, preclinical strategies designed to exploit growth within the context of invasion are lacking. To address this, we designed an experimental system to screen for targetable signaling pathways linked to active early 3D invasion phenotypes in different molecular subtypes of KRAS-driven lung adenocarcinoma. Combined live-cell imaging of human bronchial epithelial cells in a 3D invasion matrix and transcriptomic profiling identified mutant LKB1-specific upregulation of BMP6. LKB1 loss increased BMP6 signaling, which induced the canonical iron regulatory hormone hepcidin. Intact LKB1 was necessary to maintain BMP6 signaling homeostasis and restrict ALK2/BMP6-fueled growth. Preclinical studies in a Kras/Lkb1-mutant syngeneic mouse model and in a xenograft model showed potent growth suppression by inhibiting the ALK2/BMP6 signaling axis with single-agent inhibitors that are currently in clinical trials. Lastly, BMP6 expression was elevated in tumors of patients with LKB1-mutant early-stage lung cancer. These results are consistent with those of a model in which LKB1 acts as a "brake" to iron-regulated growth and suggest that ALK2 inhibition can be used for patients with LKB1-mutant tumors. Significance: Three-dimensional invasion-linked gene expression analysis reveals a therapeutic vulnerability to inhibition of ALK2/BMP6 signaling in LKB1-mutant lung cancer that can be rapidly translated to the clinic.
©2024 The Authors; Published by the American Association for Cancer Research.
Conflict of interest statement
S.S. Ramalingam reports grants from Bristol Myers Squibb, AstraZeneca, Merck, Pfizer, and Amgen outside the submitted work. No disclosures were reported by the other authors.
Figures


Update of
-
Live-cell invasive phenotyping uncovers the ALK2/BMP6 iron homeostasis pathway as a therapeutic vulnerability in LKB1-mutant lung cancer.bioRxiv [Preprint]. 2023 Jun 14:2023.06.14.544941. doi: 10.1101/2023.06.14.544941. bioRxiv. 2023. Update in: Cancer Res. 2024 Nov 15;84(22):3761-3771. doi: 10.1158/0008-5472.CAN-23-2631. PMID: 37398244 Free PMC article. Updated. Preprint.
Similar articles
-
Live-cell invasive phenotyping uncovers the ALK2/BMP6 iron homeostasis pathway as a therapeutic vulnerability in LKB1-mutant lung cancer.bioRxiv [Preprint]. 2023 Jun 14:2023.06.14.544941. doi: 10.1101/2023.06.14.544941. bioRxiv. 2023. Update in: Cancer Res. 2024 Nov 15;84(22):3761-3771. doi: 10.1158/0008-5472.CAN-23-2631. PMID: 37398244 Free PMC article. Updated. Preprint.
-
The level of oncogenic Ras determines the malignant transformation of Lkb1 mutant tissue in vivo.Commun Biol. 2021 Jan 29;4(1):142. doi: 10.1038/s42003-021-01663-8. Commun Biol. 2021. PMID: 33514834 Free PMC article.
-
LKB1 and KEAP1/NRF2 Pathways Cooperatively Promote Metabolic Reprogramming with Enhanced Glutamine Dependence in KRAS-Mutant Lung Adenocarcinoma.Cancer Res. 2019 Jul 1;79(13):3251-3267. doi: 10.1158/0008-5472.CAN-18-3527. Epub 2019 Apr 30. Cancer Res. 2019. PMID: 31040157 Free PMC article.
-
LKB1/AMPK Pathway and Drug Response in Cancer: A Therapeutic Perspective.Oxid Med Cell Longev. 2019 Oct 31;2019:8730816. doi: 10.1155/2019/8730816. eCollection 2019. Oxid Med Cell Longev. 2019. PMID: 31781355 Free PMC article. Review.
-
LKB1 regulated pathways in lung cancer invasion and metastasis.J Thorac Oncol. 2010 Dec;5(12):1883-6. doi: 10.1097/JTO.0b013e3181fbc28a. J Thorac Oncol. 2010. PMID: 21102257 Free PMC article. Review.
Cited by
-
Targeting LKB1/STK11-mutant cancer: distinct metabolism, microenvironment, and therapeutic resistance.Trends Pharmacol Sci. 2025 Aug;46(8):722-737. doi: 10.1016/j.tips.2025.06.008. Epub 2025 Jul 22. Trends Pharmacol Sci. 2025. PMID: 40701847 Review.
-
High PER1 expression is associated with STK11 mutation and clinical biomarkers of immunotherapy resistance in lung adenocarcinoma.J Cancer Res Clin Oncol. 2025 Jul 26;151(7):223. doi: 10.1007/s00432-025-06269-9. J Cancer Res Clin Oncol. 2025. PMID: 40715535 Free PMC article.
-
A patient-derived organoid model captures fetal-like plasticity in colorectal cancer.Cell Res. 2025 Sep;35(9):642-655. doi: 10.1038/s41422-025-01139-y. Epub 2025 Jul 4. Cell Res. 2025. PMID: 40615635
References
MeSH terms
Substances
Grants and funding
LinkOut - more resources
Full Text Sources
Medical
Molecular Biology Databases
Miscellaneous

