. 2024 Sep 3;121(36):e2404916121.
doi: 10.1073/pnas.2404916121. Epub 2024 Aug 29.

Peripheral-derived regulatory T cells contribute to tumor-mediated immune suppression in a nonredundant manner

Affiliations

Peripheral-derived regulatory T cells contribute to tumor-mediated immune suppression in a nonredundant manner

Md Moazzem Hossain et al. Proc Natl Acad Sci U S A. .

Abstract

Identifying tumor-mediated mechanisms that impair immunity is instrumental for the design of new cancer therapies. Regulatory T cells (Tregs) are a key component of cancer-derived immune suppression; however, these lymphocytes are necessary to prevent systemic autoimmunity in mice and humans, and thus, direct targeting of Tregs is not a clinical option for cancer patients. We have previously demonstrated that excising transcription factor Kruppel-like factor 2 (Klf2) within the T cell lineage blocks the generation of peripheral-derived Tregs (pTregs) without impairing production of thymic-derived Tregs. Using this mouse model, we have now demonstrated that eliminating pTregs is sufficient to delay/prevent tumor malignancy without causing autoimmunity. Cancer-bearing mice that expressed KLF2 converted tumor-specific CD4+ T cells into pTregs, which accumulated in secondary lymphoid organs and impaired further T cell effector activity. In contrast, pTreg-deficient mice retained cancer-specific immunity, including improved T cell infiltration into "cold" tumors, reduced T cell exhaustion in tumor beds, restricted generation of tumor-associated myeloid-derived suppressor cells, and the continued production of circulating effector T cells that arose in a cancer-dependent manner. Results indicate that tumor-specific pTregs are critical for early stages of cancer progression and blocking the generation of these inhibitory lymphocytes safely delays/prevents malignancy in preclinical models of melanoma and prostate cancer.

Keywords: KLF2; melanoma; pTregs; prostate cancer; regulatory T cells.


Conflict of interest statement

Competing interests statement:The authors declare no competing interest.

Figures
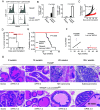
Fig. 1.
Fig. 1.
Excision of Klf2 within the T cell compartment impedes malignant cancer. (A) Tregs harvested from Lck-cre; Klf2fl/fl mice express high levels of transcription factor Helios, which is consistent with these cells being confined to the tTreg lineage. The percentage of Helioslow pTregs is shown in each histogram. N = 2 mice per cohort. (B) T cell proliferation in response to B16 antigen. Lck-cre; Klf2fl/fl (white bars) and Klf2fl/fl (black bars) littermates were challenged i.v. with B16 melanoma; then, splenocytes were restimulated ex vivo with B16 lysate to elicit tumor-specific activity. Proliferation (CFSE dilution, cultured in triplicate) was measured by flow cytometry. P values (Student’s t test) and error bars (SD) are shown. N = 2 experiments. (C) B16 tumor progression in Lck-cre; Klf2fl/fl mice. Four Klf2fl/fl (black) and Lck-cre; Klf2fl/fl (red) littermates were challenged s.c. with B16 melanoma (104), and tumor volume was measured over time. P = 0.005, calculated using the Wilcoxon signed rank-sum test at 26 d posttransplant. N = 2 experiments. (D) Survival estimates of mice challenged s.c. with B16 melanoma. Kaplan–Meier curves using 8 Klf2fl/fl (black) and 10 Lck-cre; Klf2fl/fl (red) mice. P = 0.001, calculated using a log-rank test. (E) Survival estimates for TRAMP versus TRAMP; Lck-cre; Klf2fl/fl littermates. A Kaplan–Meier survival curve was generated with 45 TRAMP (black line) and 28 TRAMP; Lck-cre; Klf2fl/fl (red line) mice. P = 0.006, calculated using a log-rank test. (F) PCa progression in TRAMP cohorts. The % genitourinary tract weight (GU) relative to TBW was plotted over time. Lines are fitted values. P = 0.008; the P-value tests the difference of slope between the two TRAMP cohorts via an interaction term in a linear regression model. (G) Histological analysis of prostates harvested from TRAMP (Top) versus TRAMP; Lck-cre; Klf2fl/fl (Bottom) mice at indicated time points. H&E, 20× magnification. Pathologic scores are assigned to each tissue.
Fig. 2.
Fig. 2.
pTregs are necessary and sufficient for PCa progression. (A) Histological analysis of prostates from control (TRAMP and TRAMP; Lck-cre; Klf2fl/fl) versus TRAMP; Foxp3-cre; Klf2fl/fl mice. H&E, 10× magnification. The age of each animal, extent of tumor growth (GU relative to TBW), and pathology score assigned to each tissue are shown. Arrows in TRAMP; Lck-cre; Klf2fl/fl prostate (Right) indicate sites of TIL. (B) PCa progression in TRAMP; Foxp3-cre; Klf2fl/fl mice. Percent GU/TBM increase over time is shown for TRAMP (black) versus TRAMP; Foxp3-cre; Klf2fl/fl (blue) littermates. Nine mice per cohort. Linear regression identified no significant difference between the lines, P > 0.05. (C) Generation of mixed bone marrow chimeric animals. Lethally irradiated TRAMP; Lck-cre; Klf2fl/fl mice received a 5:1 ratio of Lck-cre; Klf2fl/fl and Klf2fl/fl bone marrow to generate animals that had both KLF2-deficient T cells and KLF2-replete pTregs. (D) PCa progression in a TRAMP; Lck-cre; Klf2fl/fl mixed bone marrow chimeric mouse. Prostate histology (H&E, 10× magnification), percent GU/TBW (blue font), and tissue pathology score (red font) are shown for a TRAMP (Top), TRAMP; Lck-cre; Klf2fl/fl (Middle), and a TRAMP; Lck-cre; Klf2fl/fl chimeric mouse (Bottom). Mice were 32 to 35 wk of age when they were killed. Three chimeric mice were generated, each demonstrating signs of PCa malignancy. (E) TRAMP-C2 progression in Lck-cre; Klf2fl/fl mice that received naive KLF2+ CD4+ T cells. One week after s.c. challenge with TRAMP-C2, CD4+CD25 T cells from Klf2fl/fl animals were transferred into three Lck-cre; Klf2fl/fl mice (experimental, black). The remaining four Lck-cre; Klf2fl/fl mice served as controls (red). Mean tumor volume (±SD) at d52 was 1,737 ± 326 (experimental) versus 311 ± 254 (control), P = 0.001, calculated by Student’s t test. (F) Newly generated pTregs were located in the draining lymph node, not the tumor, of PCa-bearing mice. Naive CD4+ T cells from CD45.1+ mice were transferred into Lck-cre; Klf2fl/fl (CD45.2+) recipients that had established TRAMP-C2 cancer; then, de novo pTreg production (CD45.1+CD45.2CD4+CD25+Foxp3+) was assessed 1 mo later in the tumor and associated draining lymph node (inguinal). The percentage of pTregs are shown. Data are representative of three mice. (G) Schematic to test whether tumor-specific pTregs were sufficient to impair anticancer immunity in Lck-cre; Klf2fl/fl mice. Naive CD4+ T cells harvested from OT2; Foxp3RFP mice were transferred into Lck-cre; Klf2fl/fl recipients previously challenged s.c. with B16-OVA melanoma. Newly generated pTregs (mRFP+ lymphocytes) were then transferred into a second set of Lck-cre; Klf2fl/fl mice challenged with B16-OVA to assess their impact on tumor progression. (H) Tumor growth in Lck-cre; Klf2fl/fl mice following the adoptive transfer of tumor-specific pTregs. Melanoma progression was measured in Lck-cre; Klf2fl/fl animals with cancer (1.5 × 10⁴ B16-OVA) that received 1.5 × 10⁵ tumor-specific mRFP+ pTregs (black lines). Tumor progression in positive control (Klf2fl/fl, blue lines) and negative control (Lck-cre; Klf2fl/fl, red lines) animals was measured at the same time. The dashed line demarcates maximal limit for humane tumor burden. N = 3 Klf2fl/fl, 5 Lck-cre; Klf2fl/fl, and 4 Lck-cre; Klf2fl/fl mice that received mRFP+ cells. There is a statistically significant difference (P < 0.001) in growth trajectories between the Lck-cre; Klf2fl/fl (red) and Lck-cre; Klf2fl/fl+pTregs (black) groups as determined using a linear mixed effects model with the cube root of tumor volume as the response.
Fig. 3.
Fig. 3.
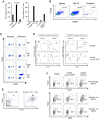
Tumor-specific pTregs are present in mice that develop malignant PCa but are absent in mice with lasting anti-PCa immunity. (A) Tumor-specific CD4+ effector T cell activity was suppressed in mice that harbor pTregs. (Left) TRAMP, TRAMP; Lck-cre; Klf2fl/fl, and Lck-cre; Klf2fl/fl mice were inoculated with tumor antigen (SV40 peptide)+adjuvant; then, 10 d later, CD4+ T cells were restimulated with a pan-T cell immunogen to quantify IFNγ production via ELISpot. Cells were cultured in triplicate, N = 2 experiments. P < 0.0001 for TRAMP versus TRAMP; Lck-cre; Klf2fl/fl, as determined by Student’s t test. (Right) Splenocytes from TRAMP, TRAMP; Lck-cre; Klf2fl/fl and Klf2fl/fl mice were individually cultured with SV40 peptide. Additionally, splenocytes from TRAMP and TRAMP; Lck-cre; Klf2fl/fl mice were cocultured with SV40 peptide at a 1:1 ratio. CD4+ T cells were then isolated from cultures and restimulated with a pan-T cell immunogen to quantify IFNγ production by ELISpot. CD4+ T cells isolated from individual TRAMP and TRAMP; Lck-cre; Klf2fl/fl cultures were also mixed at a 1:1 ratio prior to restimulation to demonstrate potential dilution effects. N = 2 experiments. (B) Tregs were plentiful in SLOs but scarce in the prostate of TRAMP animals. Treg frequencies (CD4+CD25+Foxp3+) in SLOs (spleen, mesenteric lymph nodes) and GU of a 20-wk-old TRAMP mouse. Data are representative of 5 mice, 15 to 20 wk of age. (C) De novo generation of pTregs occurred in melanoma-associated draining lymph nodes. Naive CD4+(CD25) T cells from CD45.1+ mice were adoptively transferred into Lck-cre; Klf2fl/fl recipients that had established s.c. B16 melanoma. Lck-cre; Klf2fl/fl mice that received CD45.1+ T cells but lacked tumor served as a control. The percentage of newly generated CD45.1+CD90.2+CD4+CD25+Foxp3+ Tregs is shown for select tissues, including spleen, mesenteric lymph nodes (Ms LN), inguinal lymph node associated with tumor (Drn LN), and contralateral inguinal lymph node (NDrn LN). N = 3 mice per cohort. (D) Tumor-specific pTregs were generated at an early stage of PCa in TRAMP mice. Thymocytes or splenocytes were isolated from 6-wk-old TRAMP and TRAMP; Lck-cre; Klf2fl/fl littermates; then, the cells were passed over a column containing immobilized SV40 peptide/I-Ab tetramer. Two sets of tetramers were used, both of which present an immunogenic sequence of SV40 peptide. T cells that bound to the tetramers were then analyzed by flow cytometry for Foxp3 expression. The % Foxp3+CD4+ Tregs is shown. N = 3 experiments. (E) Tumor-specific pTregs accumulated in the draining lymph node of a 28-wk-old TRAMP mouse. Lymphocytes from the iliac lymph nodes were passed over an SV40 peptide/I-Ab tetramer column and then stained for CD4+CD25+Foxp3+ expression. The % Tregs precolumn (Left contour plot) and postcolumn (Right contour plot) are displayed. N = 2 experiments. (F) Identification of tumor-specific pTregs in TRAMP; Lck-cre; Klf2fl/fl chimeric mice. Lymphocytes from TRAMP, TRAMP; Lck-cre; Klf2fl/fl, or TRAMP; Lck-cre; Klf2fl/fl chimeric (5:1 ratio of Lck-cre; Klf2fl/fl and Klf2fl/fl bone marrow) age-matched mice were passed over a SV40 peptide/I-Ab tetramer column; then, flow-through (cells that did not bind to the column) and tetramer-bound cells were stained to identify Tregs (CD4+CD25+Foxp3+). % Tregs in flow-through (Top) and tetramer-positive lymphocytes from mesenteric lymph nodes (Middle) or spleen (Bottom) are displayed. N = 2 experiments.
Fig. 4.
Fig. 4.
In the absence of pTregs, spontaneous CD4+ effector T cell activity develops and persists in tumor-bearing animals. (A) Immunohistochemistry of prostate from TRAMP; Lck-cre; Klf2fl/fl mice at early (8 wk), intermediate (16 wk), late (28 wk), and very late (60 wk) stages of autochthonous PCa. Serial sections of prostate tissue were stained to identify infiltrating T cells (αCD3), TH cells (αCD4), CTLs (αCD8), and Tregs (αFoxp3). 20× magnification. Arrows identify sites of lymphocyte infiltration. (B) Frequency of tumor-infiltrating CD4+ T cells in 35-wk-old TRAMP, TRAMP; Lck-cre Klf2fl/fl, and TRAMP; Lck-cre; Klf2fl/fl mixed bone marrow chimeric mice. Contour plots display % of conventional CD4+ T cells. N = 1 experiment. (C) Frequency of CD4+Foxp3 TILs in 22-wk-old TRAMP and TRAMP; Lck-cre; Klf2fl/fl mice. Five mice per group, P < 0.0001 as determined by Student’s test. (D) Frequency of TILs in mice challenged with TRAMP-C2 for 8 wk. % of CD4+Foxp3 and CD8+ TILs present in a Klf2fl/fl (WT), Lck-cre; Klf2fl/fl, and Lck-cre; Klf2fl/fl mouse reconstituted with a 5:1 ratio of Lck-cre; Klf2fl/fl and Klf2fl/fl bone marrow (chimera) are displayed. Data are representative of three experiments. (E) Exhaustion markers on CD4+Foxp3 TILs harvested from TRAMP (black) versus TRAMP; Lck-cre; Klf2fl/fl (red) mice at 22 wk of age. Histogram overlays of CD4+Foxp3 T cells as analyzed by flow cytometry. Mean fluorescent intensity (MFI) of KLF2+ (black) and KLF2-deficient cells (red) are shown. N = 3 experiments. (F) Exhaustion markers on CD4+Foxp3 TILs isolated from Klf2fl/fl (black) versus Lck-cre; Klf2fl/fl (red) mice challenged with TRAMP-C2 for 8 wk. MFI of KLF2+ (black) and KLF2-deficient cells (red) are shown. N = 2 experiments. (G) Frequency of MDSC found in the spleen (Top) and prostate (Lower) of Klf2fl/fl (WT), Lck-cre; Klf2fl/fl, TRAMP, and TRAMP; Lck-cre; Klf2fl/fl mice at 16 wk of age. The % of mMDSC (CD11b+Ly6Chi, red font) and gMDSC (CD11b+Ly6cint, black font) is shown. N = 2 experiments. (H) IL-2 responsive effector T cells circulated in TRAMP; Lck-cre; Klf2fl/fl mice but were absent in mice with pTregs. T cells harvested from a TRAMP, TRAMP; Lck-cre; Klf2fl/fl, or TRAMP; Lck-cre; Klf2fl/fl mouse reconstituted with a 5:1 ratio of Lck-cre; Klf2fl/fl and Klf2fl/fl bone marrow (all 16-wk of age) were cultured with IL-2 (100 U/mL, 4 d); then, proliferation was quantified by Ki67 expression. (Upper) A representative histogram with % proliferating CD4+Foxp3 T cells. (Lower) Cumulative data from triplicate cultures. Error bars are SD, P = 0.02 using a Kruskal–Wallis H test. N = 2 experiments. (I) IL-2 responsive effector CD4+ T cells were present in Lck-cre; Klf2fl/fl mice challenged with TRAMP-C2 (Left bars) or B16 (Right bars) tumor cells. Splenocytes from tumor-bearing Klf2fl/fl (black) and Lck-cre; Klf2fl/fl (white) mice were cultured with IL-2 (100 U/mL, 4 d); then, proliferation was assessed by Ki67 surface expression. Cells were cultured in triplicate, error bars are SD. P = 0.0014 for TRAMP-C2 (N = 3 experiments), P < 0.0001 for B16 (N = 2 experiments). (J) TH1 and TH17 effector cells were present in tumor-bearing mice that lack pTregs. TH1 (IFNγ), TH2 (IL-4), and TH17 (IL-17) differentiation was assessed by restimulating lymphocytes harvested from the mesenteric lymph nodes of Klf2fl/fl (cKO), TRAMP, and TRAMP; Lck-cre; Klf2fl/fl (TRAMP cKO) littermates. The percentage of gated lineages is shown. N = 3 mice per cohort.

References

    1. Khattri R., Cox T., Yasayko S. A., Ramsdell F., An essential role for scurfin in Cd4+Cd25+ T regulatory cells. Nat. Immunol. 4, 337–342 (2003). - PubMed
    1. Fontenot J. D., Gavin M. A., Rudensky A. Y., Foxp3 programs the development and function of Cd4+Cd25+ regulatory T cells. Nat. Immunol. 4, 330–336 (2003). - PubMed
    1. Wildin R. S., et al. , X-Linked neonatal diabetes mellitus, enteropathy and endocrinopathy syndrome is the human equivalent of mouse scurfy. Nat. Genet. 27, 18–20 (2001). - PubMed
    1. Shimizu J., Yamazaki S., Sakaguchi S., Induction of tumor immunity by removing Cd25+Cd4+ T cells: A common basis between tumor immunity and autoimmunity. J. Immunol. 163, 5211–5218 (1999). - PubMed
    1. Dannull J., et al. , Enhancement of vaccine-mediated antitumor immunity in cancer patients after depletion of regulatory T cells. J. Clin. Invest. 115, 3623–3633 (2005). - PMC - PubMed

Substances