Clinical Trial
. 2024 Aug 29;134(20):e180331.
doi: 10.1172/JCI180331.

Deciphering bone marrow engraftment after allogeneic stem cell transplantation in humans using single-cell analyses

Affiliations
Clinical Trial

Deciphering bone marrow engraftment after allogeneic stem cell transplantation in humans using single-cell analyses

Jennifer Bordenave et al. J Clin Invest. .

Abstract

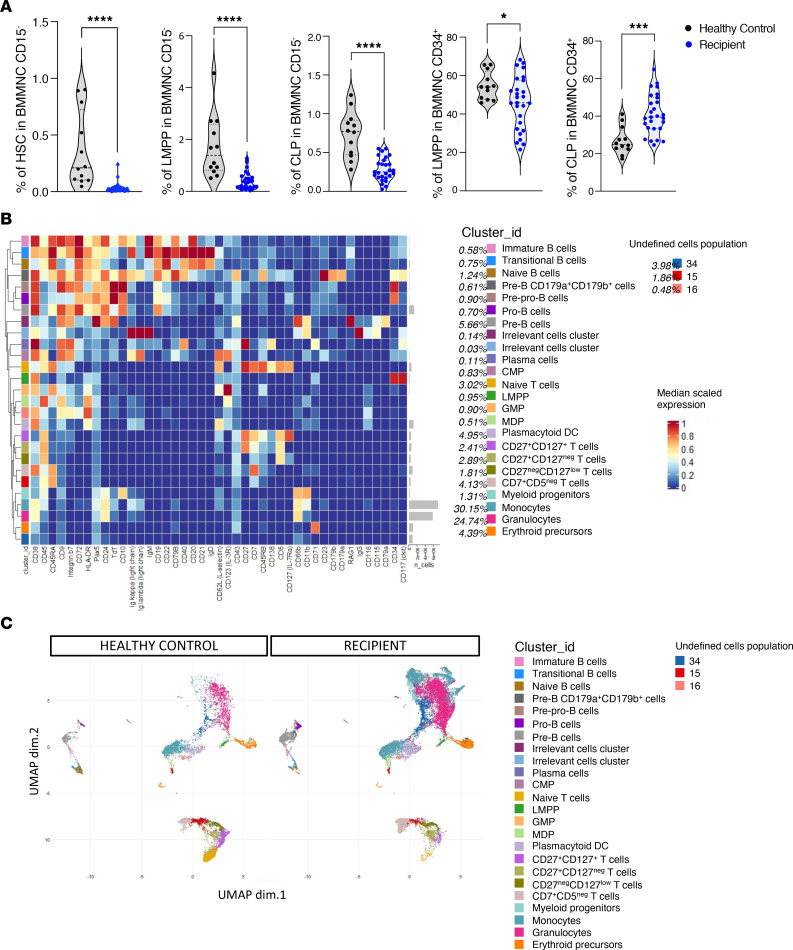
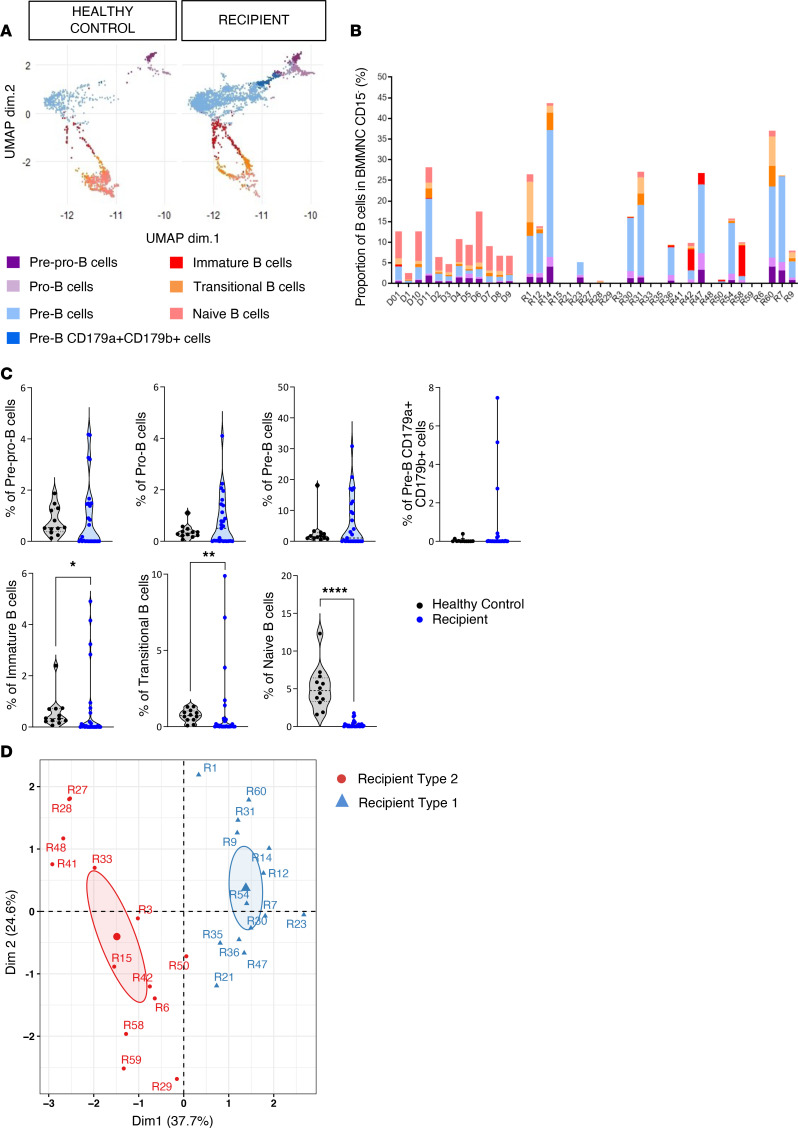
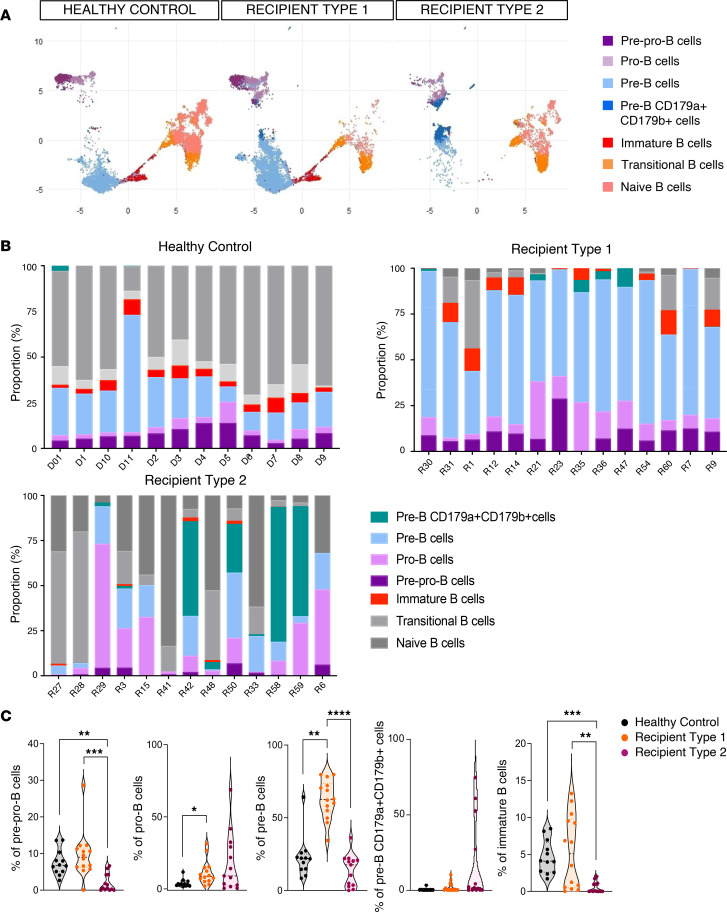
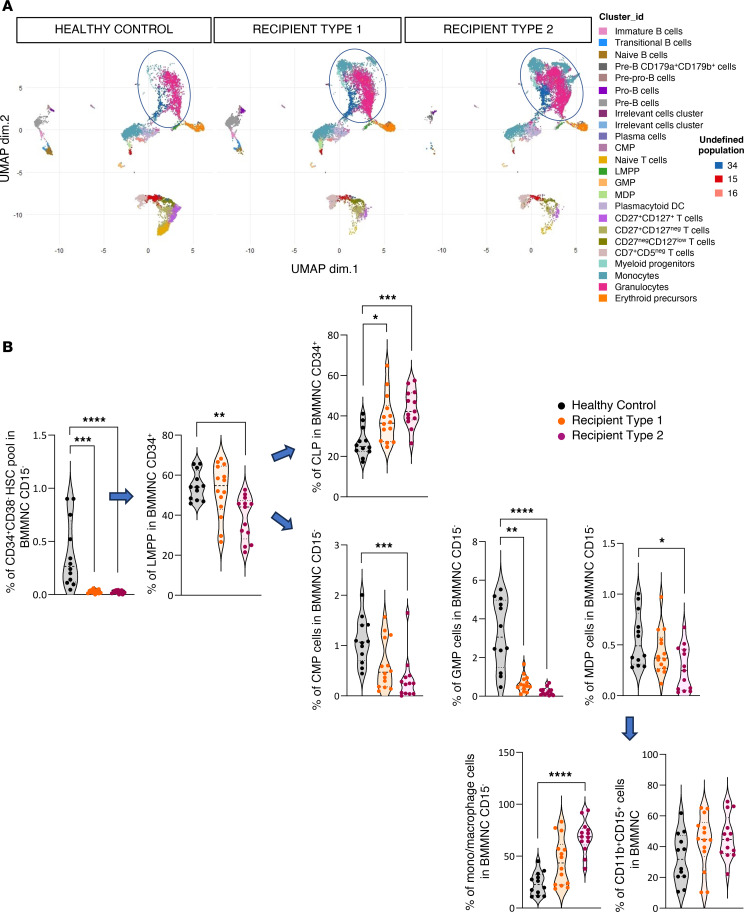
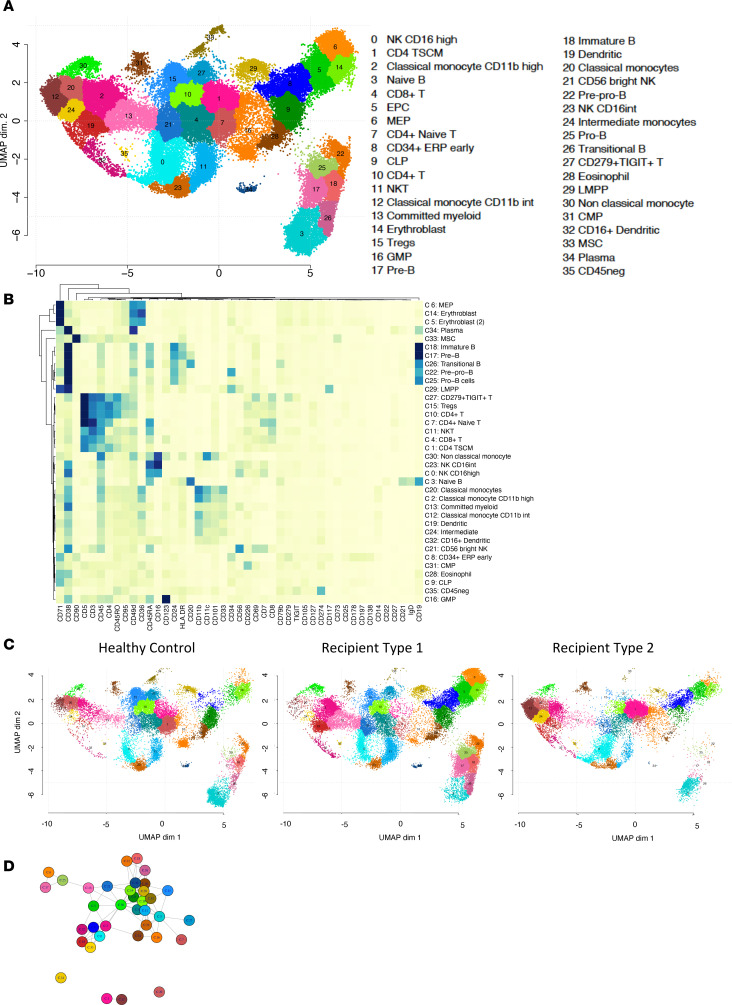
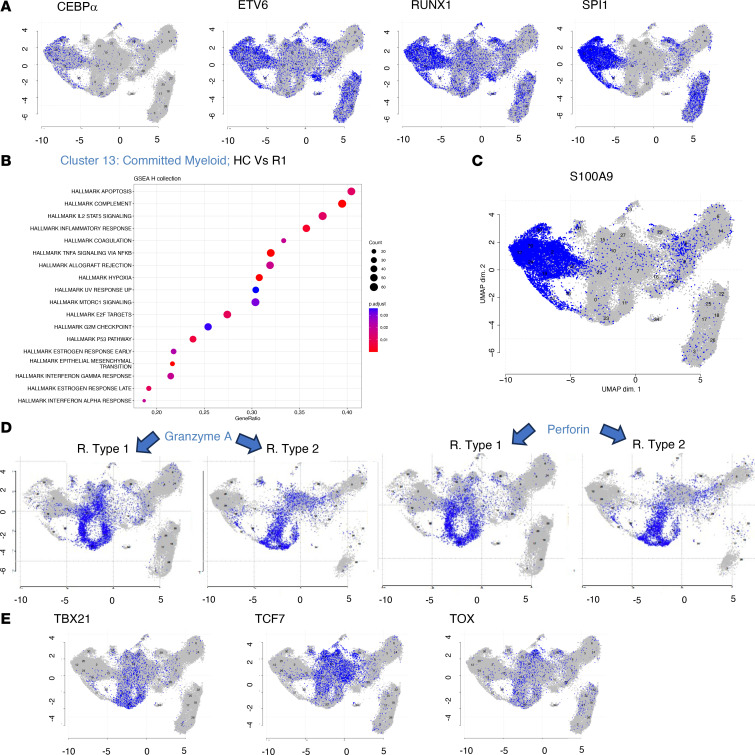
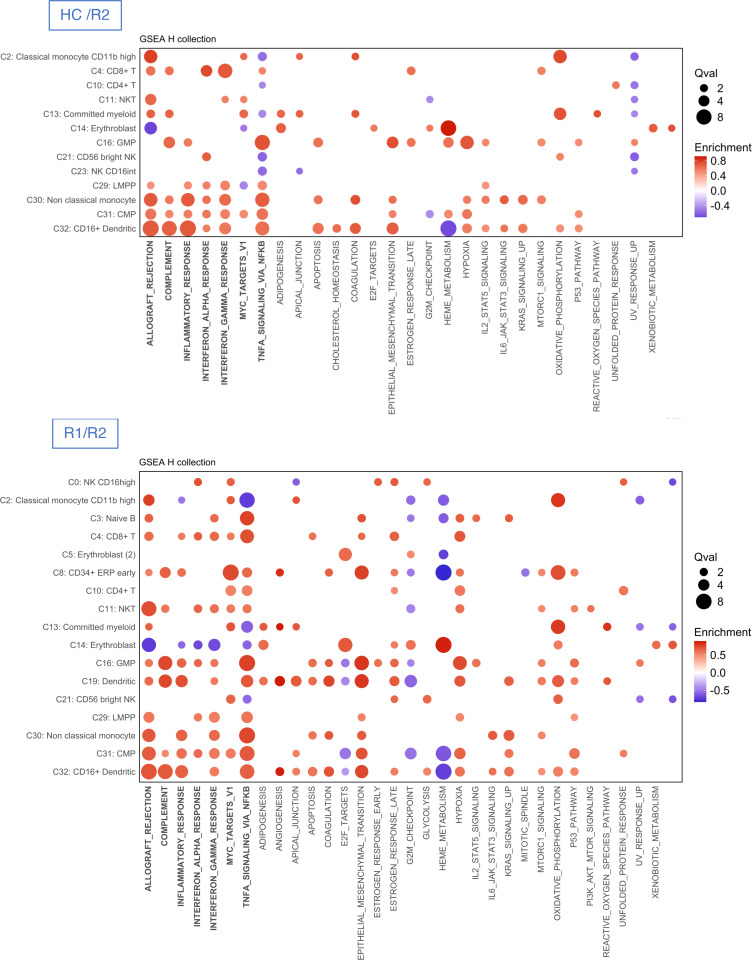
BACKGROUNDDonor cell engraftment is a prerequisite of successful allogeneic hematopoietic stem cell transplantation. Based on peripheral blood analyses, it is characterized by early myeloid recovery and T and B cell lymphopenia. However, cellular networks associated with bone marrow engraftment of allogeneic human cells have been poorly described.METHODSMass cytometry and CITE-Seq analyses were performed on bone marrow cells 3 months after transplantation in patients with acute myelogenous leukemia.RESULTSMass cytometric analyses in 26 patients and 20 healthy controls disclosed profound alterations in myeloid and B cell progenitors, with a shift toward terminal myeloid differentiation and decreased B cell progenitors. Unsupervised analysis separated recipients into 2 groups, one of them being driven by previous graft-versus-host disease (R2 patients). We then used single-cell CITE-Seq to decipher engraftment, which resolved 36 clusters, encompassing all bone marrow cellular components. Hematopoiesis in transplant recipients was sustained by committed myeloid and erythroid progenitors in a setting of monocyte-, NK cell-, and T cell-mediated inflammation. Gene expression revealed major pathways in transplant recipients, namely, TNF-α signaling via NF-κB and the IFN-γ response. The hallmark of allograft rejection was consistently found in clusters from transplant recipients, especially in R2 recipients.CONCLUSIONBone marrow cell engraftment of allogeneic donor cells is characterized by a state of emergency hematopoiesis in the setting of an allogeneic response driving inflammation.FUNDINGThis study was supported by the French National Cancer Institute (Institut National du Cancer; PLBIO19-239) and by an unrestricted research grant by Alexion Pharmaceuticals.

Keywords: Hematology; Immunology; Stem cell transplantation.


Figures

Figure 1
Figure 1. Characterization of the different populations of human cells in bone marrow.
(A) Quantification of percentages of hematopoietic stem cells (HSCs), LMPPs, and common lymphoid progenitors (CLPs) from CD15 bone marrow mononuclear cells (BMMNCs) and of LMPPs and CLPs from CD34+CD15 BMMNCs. The gating strategy used to sort early progenitor cells from human CD15 BMMNCs is summarized in Supplemental Figure 5, A and B. Twenty-six patients with acute myeloid leukemia/myelodysplastic syndrome were included in the cohort. BMMNCs were collected at 3 months after HSCT and analyzed. Twelve healthy controls were also analyzed. HSCs were defined as LinCD34+CD38CD45RA, LMPPs as CD34+CD38+CD117+CD127, and CLPs as CD34+CD38+CD117CD127. The heatmap shows the median in patients (blue) compared with healthy controls (black). (B) Heatmap showing median expression intensities of each protein marker (columns) for each detected cluster (rows) using FlowSOM algorithm, with 24 indicated relevant metaclusters. (C) UMAP plot generated from an equal subsampling by subset from CD15 BMMNCs from healthy controls (n = 12) and recipients (n = 26) (42 surface and 2 intracellular markers). Clusters are color-coded. For A and B, Mann-Whitney tests: *P < 0.05; ***P < 0.001; ****P < 0.0001.
Figure 2
Figure 2. Segregating B cells into phenotypically distinct subsets in human bone marrow.
(A) UMAP visualization of B cell populations from human CD15 BMMNCs from controls and recipients. B cell populations were defined by FlowSOM in Figure 1B. Colors indicate clusters. (B) Data showing the individual cellular compositions of B cell populations per individual. (C) Quantification of percentages of all B cell subsets from human CD15 BMMNCs from controls and recipient patients. Mann-Whitney tests: *P < 0.05; **P < 0.01; ****P < 0.0001. (D) Principal component analysis (PCA) generated using all markers on B cell population subsets identified in A. PCA identified 2 clusters among all recipients. Each point represents a recipient (n = 26).
Figure 3
Figure 3. B cell engraftment.
(A) UMAP visualization of B cell populations from human CD15 BMMNCs from healthy controls (n = 12), recipients of group 1 (R1, n = 14) and recipients of group 2 (R2, n = 12) patients. Colors indicated clusters. (B) Data showing the individual cellular compositions of B cell populations in total B cells per individual and per group (controls, R1 and R2 patients). In gray are mature B cells and in color are early B cells (pre-pro-B, pro-B, pre-B, pre-B CD179a+CD179b+, and immature B) corresponding to populations of interest. (C) Quantification of percentage of early B cell populations in controls (black) and R1 (orange) and R2 (pink) recipients. P values correspond to Kruskal-Wallis test: *P < 0.05; **P < 0.01; ***P < 0.001; ****P < 0.0001.
Figure 4
Figure 4. Early progenitors and mature myeloid engraftment.
(A) UMAP plot generated from an equal subsampling by subset from CD15 BMMNCs from controls (n = 12) and recipients (n = 26) (44 antigens). Clusters are color-coded, and mature myeloid and early progenitors are circled in blue. (B) Quantification of percentage of the HSC pool (CD34+CD38) from CD15 BMMNCs; LMPPs and CLPs from CD34+CD15 BMMNCs; common myeloid progenitors (CMPs; CD34+CD38+CD123+CD45RA); granulocyte and monocyte progenitors (GMPs; CD34+CD38+CD123+CD45RA+); macrophage dendritic cell precursors (MDPs; CD34loCD38CD117int/loCD45RA); and monocytes/macrophages from CD15 BMMNCs and granulocytes from CD11b+CD15+ BMMNCs in controls and R1 and R2 recipients. P values correspond to Kruskal-Wallis test: *P < 0.05; **P < 0.01; ***P < 0.001; ****P < 0.0001.
Figure 5
Figure 5. A comprehensive single-cell proteo-genomic map of controls, recipients of group 1, and recipients of group 2.
(A) UMAP display of single-cell proteo-genomics data by CITE-Seq of human bone marrow from controls and recipient of cluster 1 and recipient of cluster 2 patients (n = 72,566 single-cell, 137 surface markers); n = 14 samples. Clusters are color-coded, and cell types associated with each cluster are displayed. (B) Heatmap representing scaled expression of phenotype antigen across the cell subsets manually ordered and annotated for visualization purposes. (C) UMAP visualization from controls (n = 4) and recipient cluster 1 (n = 7) and recipient cluster 2 (n = 3) patients. (D) Connection graph of clusters. Two clusters are connected if their relative abundance is not significantly different between R1 and R2 recipients (see Methods). Four classes of cluster appear (clusters 24, 1, 12, and 20), with no connection between them: these clusters differentiate R1 and R2 recipients.
Figure 6
Figure 6. Gene expression of selected genes.
(A) Expression of selected mRNAs highlighted on the UMAP from Figure 5A. Expression of several mRNAs expressed by myeloid-committed progenitors. (B) Functional enrichment analysis of annotated genes using hallmark collection. GSEA analysis based on log fold change from limma-trend analysis on scran-normalized data. The figure shows significant (Benjamini-Hochberg, adjusted P values < 5%) functional enrichment in biological states or processes analysis in committed myeloid progenitors (cluster 13). (C) RNA expression of S100A9 in the UMAP from Figure 5A. (D) RNA expression of granzyme A and perforin in the UMAP from R1 and R2 recipients. (E) Expression of selected mRNAs highlighted on the UMAP from Figure 5A. Expression of TBX21, TCF7, and TOX by T cells.
Figure 7
Figure 7. Comparison of gene signatures between controls and recipients of group 1 and group 2.
Dot plots depicting enrichment analysis within each cluster of cells with the use of hallmark gene sets in healthy control (HC) versus recipient (R) groups. All significant pathways (Benjamini-Hochberg, adjusted P values < 5%) from GSEA analysis are presented as dots whose sizes correspond to the q values [–log10(q)] and colors to the enrichment score. Comparisons between HCs and recipients of group 2 (R2) and between recipients R1 and R2 are illustrated.

References

    1. Socie G, Michonneau D. Milestones in acute GVHD pathophysiology. Front Immunol. 2022;13:1079708. doi: 10.3389/fimmu.2022.1079708. - DOI - PMC - PubMed
    1. Busch K, Rodewald HR. Unperturbed vs. post-transplantation hematopoiesis: both in vivo but different. Curr Opin Hematol. 2016;23(4):295–303. doi: 10.1097/MOH.0000000000000250. - DOI - PMC - PubMed
    1. Roeker KE, et al. Fixed-duration pirtobrutinib plus venetoclax with or without rituximab in relapsed/refractory CLL: Phase 1b BRUIN trial [published online June 11, 2024]. Blood. - DOI - PMC - PubMed
    1. Triana S, et al. Single-cell proteo-genomic reference maps of the hematopoietic system enable the purification and massive profiling of precisely defined cell states. Nat Immunol. 2021;22(12):1577–1589. doi: 10.1038/s41590-021-01059-0. - DOI - PMC - PubMed
    1. Velten L, et al. Human haematopoietic stem cell lineage commitment is a continuous process. Nat Cell Biol. 2017;19(4):271–281. doi: 10.1038/ncb3493. - DOI - PMC - PubMed

Publication types