. 2024 Oct 22;9(20):e183158.
doi: 10.1172/jci.insight.183158.

Androgen production, uptake, and conversion (APUC) genes define prostate cancer patients with distinct clinical outcomes

Affiliations

Androgen production, uptake, and conversion (APUC) genes define prostate cancer patients with distinct clinical outcomes

Hannah E Bergom et al. JCI Insight. .

Abstract

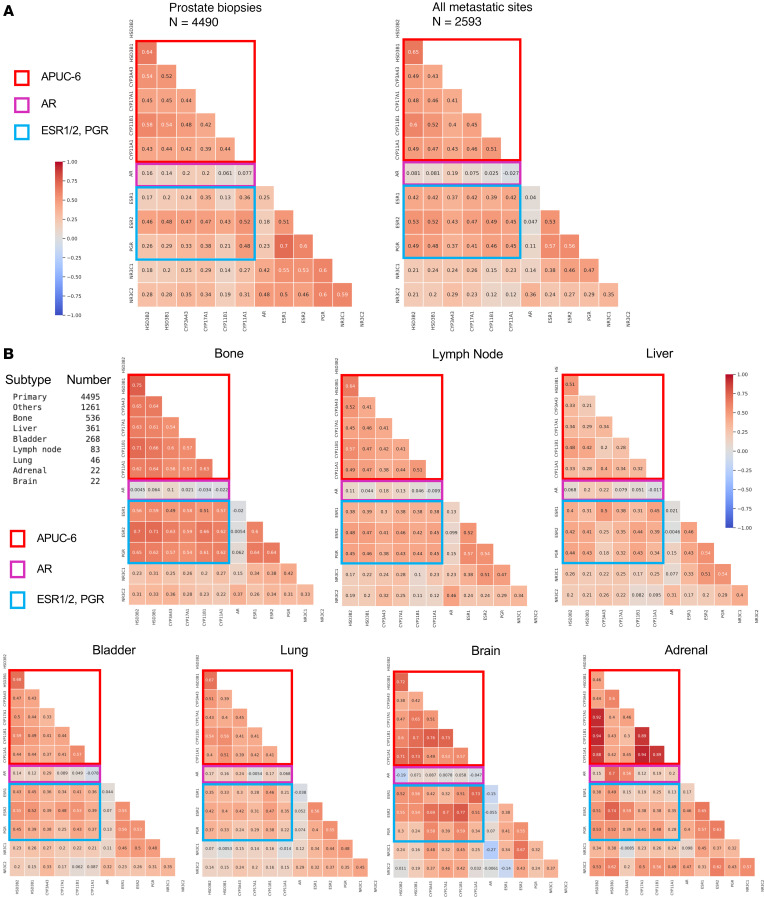
BACKGROUNDProstate cancer (PC) is driven by aberrant signaling of the androgen receptor (AR) or its ligands, and androgen deprivation therapies (ADTs) are a cornerstone of treatment. ADT responsiveness may be associated with germline changes in genes that regulate androgen production, uptake, and conversion (APUC).METHODSWe analyzed whole-exome sequencing (WES) and whole-transcriptome sequencing (WTS) data from prostate tissues (SU2C/PCF, TCGA, GETx). We also interrogated the Caris Precision Oncology Alliance (POA) DNA (592-gene/whole exome) and RNA (whole transcriptome) next-generation sequencing databases. Algorithm for Linking Activity Networks (ALAN) was used to quantify all pairwise gene-to-gene associations. Real-world overall survival was determined from insurance claims data using Kaplan-Meier estimates.RESULTSSix APUC genes (HSD3B1, HSD3B2, CYP3A43, CYP11A1, CYP11B1, CYP17A1) exhibited coalescent gene behavior in a cohort of metastatic tumors (n = 208). In the Caris POA dataset, the 6 APUC genes (APUC-6) exhibited robust clustering in primary prostate (n = 4,490) and metastatic (n = 2,593) biopsies. Surprisingly, tumors with elevated APUC-6 expression had statically lower expression of AR, AR-V7, and AR signaling scores, suggesting ligand-driven disease biology. APUC-6 genes instead associated with the expression of alternative steroid hormone receptors, ESR1/2 and PGR. We used RNA expression of AR or APUC-6 genes to define 2 subgroups of tumors with differential association with hallmark pathways and cell surface targets.CONCLUSIONSThe APUC-6-high/AR-low tumors represented a subgroup of patients with good clinical outcomes, in contrast with the AR-high or neuroendocrine PCs. Altogether, measuring the aggregate expression of APUC-6 genes in current genomic tests identifies PCs that are ligand (rather than AR) driven and require distinct therapeutic strategies.FUNDINGNCI/NIH 1R37CA288972-01, NCI Cancer Center Support P30 CA077598, DOD W81XWH-22-2-0025, R01 CA249279.

Keywords: Bioinformatics; Molecular genetics; Oncology; Prostate cancer.


Figures

Figure 1
Figure 1. Interaction of APUC genes in prostate tissue.
(A) STRING analysis was performed to indicate the degree of connection. Based on the output for molecular interactions, we then labeled uptake (blue), production (red), and conversion (yellow) genes. (B) The relationship between APUC genes was examined using ALAN outputs, values between –1 (blue) and 1 (red), based on WTS data from benign prostate tissue, PC, and metastatic PC tumors. Unsupervised hierarchical clustering was performed on ALAN outputs within each dataset. Six APUC genes are highlighted (red font). (C) The ALAN profiles for 6 APUC genes of interest are examined with greater detail in prostate tissue and metastatic PC. (D) Using WTS data from the Caris dataset, we conducted unsupervised hierarchical clustering of prostate and metastatic PC samples based on z score–scaled TPM data. (E) The median expression (TPM) of all APUC genes was examined in the GTEx database across all available tissue sites. Six APUC genes are highlighted (red font).
Figure 2
Figure 2. Key clinical correlates of APUC-6-high tumors.
APUC-6 genes were used to stratify metastatic PC patients from the SU2C/PCF samples (27) in which we examined (A) the relative expression of AR-V7 (P value), (B) AR and NEPC signatures (adjusted P values), and (C) Luminal and Basal signatures (adjusted P values). P values for single tests or adjusted P values for multiple comparisons are shown: *Padj ≤ 0.05 and P > 0.01, **Padj < 0.01 and P ≥ 0.001, ***Padj ≤ 0.001. NS, Padj and P > 0.05. (D) The expression of each APUC-6 gene and AR activity was evaluated through Pearson’s correlations using the samples in Abida et al. (27) as well as the primary and metastatic samples from the Caris cohort. The correlation coefficients (R) are shown. (E) The expression of each APUC-6 gene is depicted in primary tumors that are adenocarcinomas or NEPCs. *q < 0.05, **q < 0.01, ***q < 0.001, ****q < 0.0001. (F) AR amplification status (no/low/high amplifications) was examined based on metastatic tumors as stratified by APUC-6 and AR expression. (G) Venn diagrams showing coexpression of AR-high and APUC-6-high PCs (SU2C/PCF) using 2 percentile thresholds — above the 75th and 90th percentiles of target gene(s) expression. (H) We aggregated the proliferation score for the 6 APUC genes based on our prior study (29). The scores are based on the z score of the specific gene as compared with all 17,255 genes in the overexpression screen, in which numbers reflect the standard deviation. We then presented the aggregate scores of genes based on 2 treatment conditions (No Treatment, ADT), as well as the differences in the proliferation scores for every gene (Differential Score).
Figure 3
Figure 3. APUC-6 genes are associated with the expression of alternative hormone receptors (ESR1, ESR2, PGR) instead of AR.
(A) UMAP was used for dimensional reduction of the ALAN outputs from metastatic PC patients, in which the distance between genes (gray dots) indicates the similarity of ALAN gene behavior. Four groups of genes are specifically labeled as APUC (purple), APUC-6 (red), AR-Related (blue), and Alternative SHRs (green). (B) Based on stratifying patients by APUC-6 expression, we examined the relative expression of cancer-related hormone receptors. (C) Pearson’s correlation was used to examine the relative expression of hormone receptors with respect to APUC-6 genes (APUC-Score) in metastatic PC samples. (D) ESR1/2 and PGR expression levels were correlated with each APUC-6 gene. In C and D, the correlation coefficient (R) and adjusted P values (FDR adjusted for multiple comparisons) are shown: *Padj ≤ 0.05 and P > 0.01, **Padj < 0.01 and P ≥ 0.001, ***Padj ≤ 0.001. NS, Padj > 0.05.
Figure 4
Figure 4. APUC-6 genes have positive associations with ESR1, ESR2, and PGR, but not AR.
(A and B) In the Caris cohort of samples, we examined the Spearman’s correlation between APUC-6 genes, AR, ER (ESR1/2), PR (PGR), GR (NR3C1), and MR (NR3C2). We present the overall results as a correlation matrix and separately examined tissue from prostate tumors and metastatic PCs (A) and specific biopsy site (B). Positive correlation values are indicated in red (+1) and negative correlation values in blue (–1). Groups of genes are highlighted on each plot, including APUC-6 (red), AR (purple), and ESR1/2, PGR (blue).
Figure 5
Figure 5. Pathway analysis indicates APUC-6 high and AR high regulate distinct pathways.
(A) 50 Hallmark signatures were analyzed using GSEA based on APUC-6 high or AR high status. The analysis was conducted based on primary tumor samples from the Caris cohort. (B) The enrichment plots are shown along with net enrichment scores (NES) and FDR. (C) We examined the relative rank of all genes based on the differential expression upon grouping samples based on APUC-6 or AR expression status in primary tumor biopsies and metastatic tumor biopsies via snake plot. Genes enriched in AR-high tumors have a positive enrichment score (gray) and APUC-6-high tumors have a negative enrichment score (yellow). Steroid hormone receptors (red) and cell surface targets (blue) are highlighted.
Figure 6
Figure 6. APUC-6-high and AR-high tumors have distinct clinical outcomes.
(A) OS is shown for APUC-6-high or AR-high PC tumors based on biopsy site. ****P < 0.0001. Cox’s proportional hazards regression model and the log-rank statistic to determine significance were used to make these plots. (B) Venn diagrams showing coexpression of AR-high and APUC-6-high prostate and metastatic (top and bottom, respectively) biopsies using 2 percentile thresholds — above 75th and 90th percentiles of target gene(s) expression. (C) OS is shown for APUC-6 and AR expression status (4 combinations: APUC-6 high/AR high, APUC-6 high/AR low, APUC-6 low/AR high, APUC-6 low/AR low) across PC tumors based on biopsy site.
Figure 7
Figure 7. APUC-6-high, AR-high, and NEPC tumors have distinct clinical outcomes.
(A) OS is shown by NEPCs and PCs organized by APUC-6 and AR expression status (2 combinations: APUC-6 high/AR low versus APUC-6 low/AR high). The results are illustrated based on biopsy site. (B) OS based on hormone sensitive and castration status as well as NEPCs or PCs after stratification by APUC-6 and AR expression. The samples are organized based on prostate or metastatic biopsies.

Similar articles

Cited by

References

    1. Abudoubari S, et al. Prostate cancer epidemiology and prognostic factors in the United States. Front Oncol. 2023;13:1142976. doi: 10.3389/fonc.2023.1142976. - DOI - PMC - PubMed
    1. Ryan CJ, et al. Abiraterone in metastatic prostate cancer without previous chemotherapy. N Engl J Med. 2013;368(2):138–148. doi: 10.1056/NEJMoa1209096. - DOI - PMC - PubMed
    1. Ryan CJ, et al. Androgen decline and survival during docetaxel therapy in metastatic castration resistant prostate cancer (mCRPC) Prostate Cancer Prostatic Dis. 2020;23(1):66–73. doi: 10.1038/s41391-019-0152-3. - DOI - PMC - PubMed
    1. Ryan CJ, et al. Serum androgens as prognostic biomarkers in castration-resistant prostate cancer: results from an analysis of a randomized phase III trial. J Clin Oncol. 2013;31(22):2791–2798. doi: 10.1200/JCO.2012.45.4595. - DOI - PMC - PubMed
    1. Locke JA, et al. Androgen levels increase by intratumoral de novo steroidogenesis during progression of castration-resistant prostate cancer. Cancer Res. 2008;68(15):6407–6415. doi: 10.1158/0008-5472.CAN-07-5997. - DOI - PubMed