. 2024 Aug 29;134(21):e181421.
doi: 10.1172/JCI181421.

West Nile virus triggers intestinal dysmotility via T cell-mediated enteric nervous system injury

Affiliations

West Nile virus triggers intestinal dysmotility via T cell-mediated enteric nervous system injury

Hana Janova et al. J Clin Invest. .

Abstract

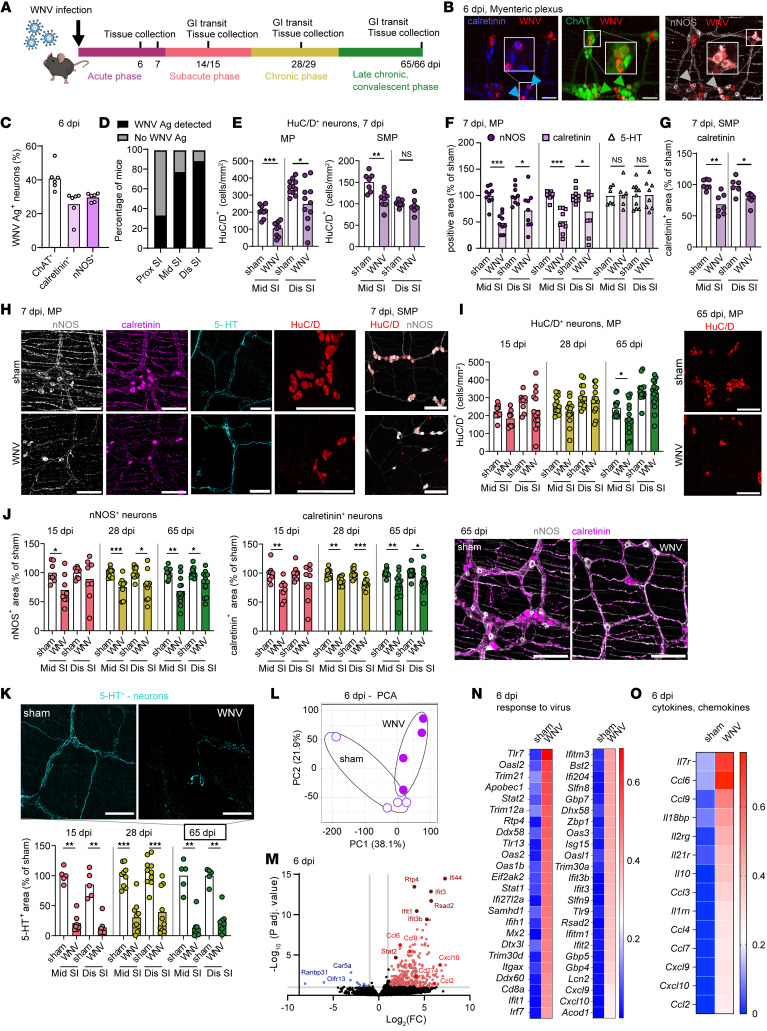
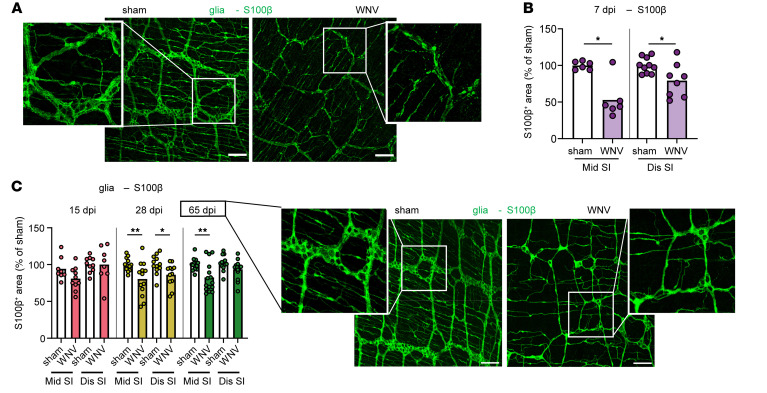
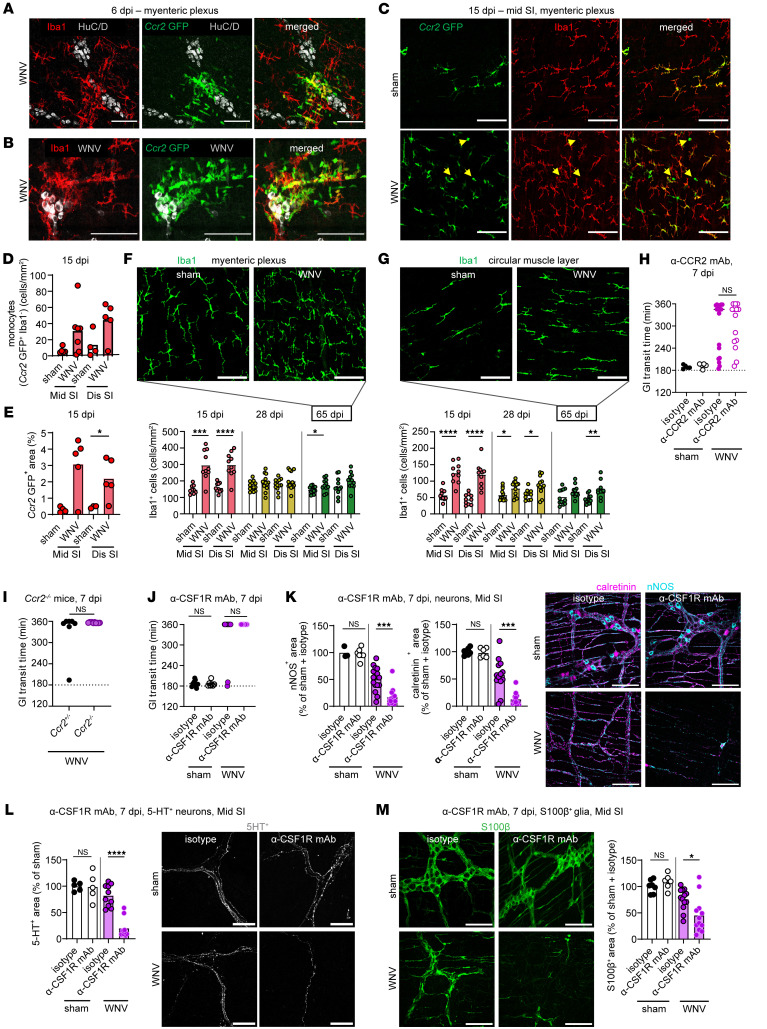
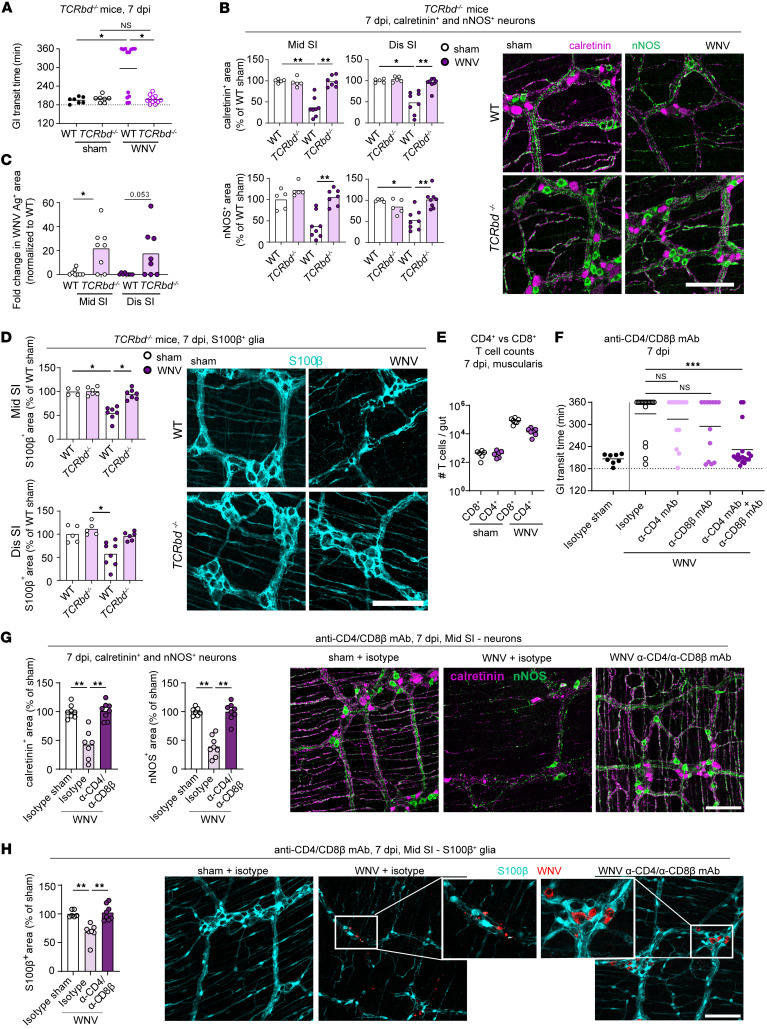
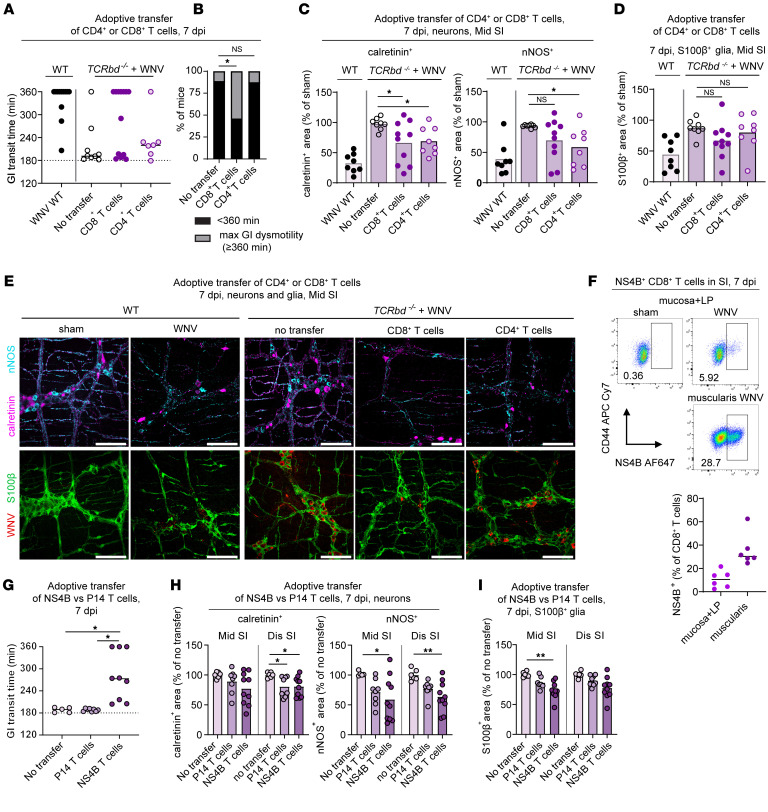
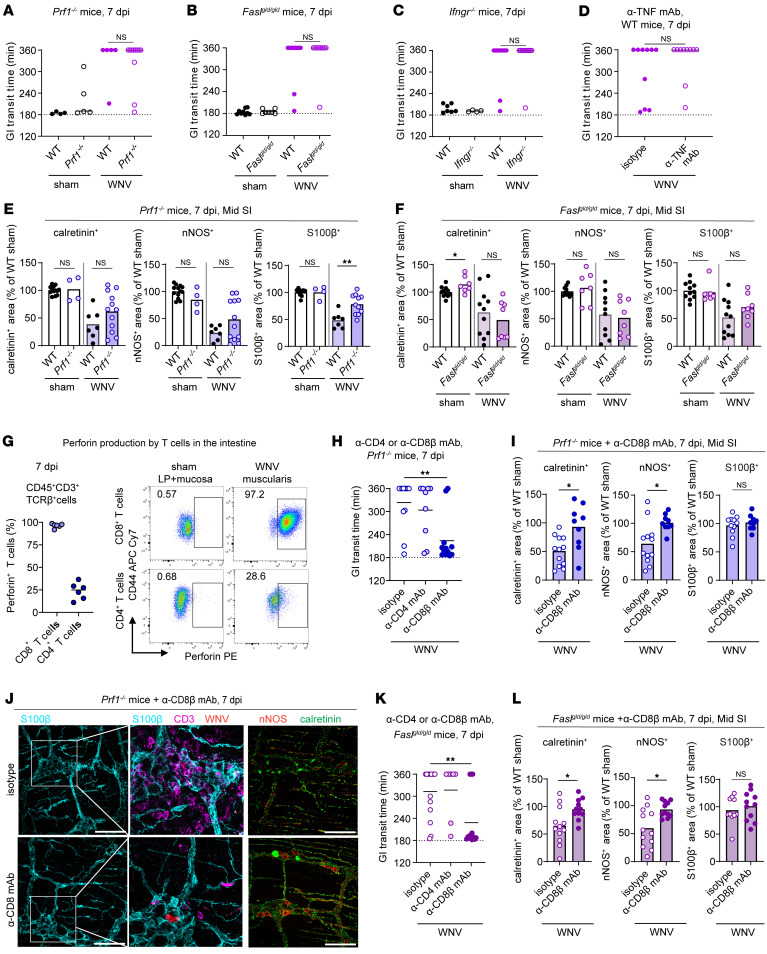
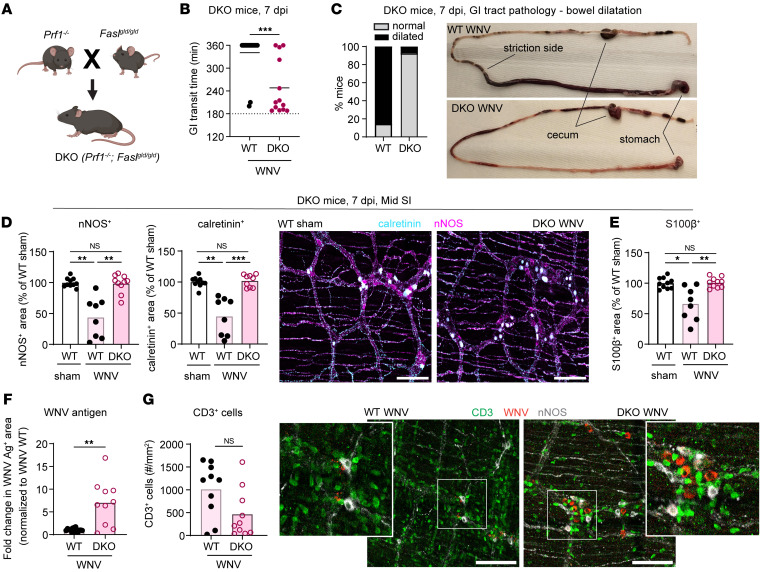
Intestinal dysmotility syndromes have been epidemiologically associated with several antecedent bacterial and viral infections. To model this phenotype, we previously infected mice with the neurotropic flavivirus West Nile virus (WNV) and demonstrated intestinal transit defects. Here, we found that within 1 week of WNV infection, enteric neurons and glia became damaged, resulting in sustained reductions of neuronal cells and their networks of connecting fibers. Using cell-depleting antibodies, adoptive transfer experiments, and mice lacking specific immune cells or immune functions, we show that infiltrating WNV-specific CD4+ and CD8+ T cells damaged the enteric nervous system (ENS) and glia, which led to intestinal dysmotility; these T cells used multiple and redundant effector molecules including perforin and Fas ligand. In comparison, WNV-triggered ENS injury and intestinal dysmotility appeared to not require infiltrating monocytes, and damage may have been limited by resident muscularis macrophages. Overall, our experiments support a model in which antigen-specific T cell subsets and their effector molecules responding to WNV infection direct immune pathology against enteric neurons and supporting glia that results in intestinal dysmotility.

Keywords: Fas signaling; Gastroenterology; Infectious disease; Neurological disorders; T cells.


Conflict of interest statement

Conflict of interest: MSD is a consultant or advisor for Inbios, VIR Biotechnology, Moderna, Merck, GlaxoSmithKline, IntegerBio, and Akagera Medicines. The Diamond laboratory has received unrelated funding support in sponsored research agreements from Moderna, VIR Biotechnology, IntegerBio, and Emergent BioSolutions.

Figures

Figure 1
Figure 1. WNV infection induces changes in ENS neuronal networks.
(A) Nine- to 10-week-old C57BL6/J male mice were inoculated in the footpad with 102 FFU WNV (New York 1999 strain), and a carmine dye transit assay and tissue collections were done at the indicated time points. The figure in A was created using BioRender software. (B and C) Whole-mount preparations of the muscularis externa from ChAT-eGFP reporter mice were isolated at 5 or 6 dpi and costained for WNV antigen, calretinin+, and nNOS+ neurons. (B) Blue, green, and white arrowheads indicate WNV antigen+ calretinin+ neurons, ChAT+ neurons, and nNOS+ neurons, respectively. Images are representative of 2 experiments. Scale bars: 50 μm. (C) Proportion of neuronal subgroups infected with WNV. (D) Percentage of mice that had WNV antigen (Ag) in the proximal (Prox), middle (Mid), and distal (Dis) regions of the small intestine (SI) at 6 dpi. (EK) The muscularis externa with the attached layer containing the submucosal plexus (SMP) (G), the myenteric plexus (MP) (F and IK), or both the myenteric plexus and submucosal plexus, as indicated (E and H), was isolated from the middle and distal small intestine of sham- and WNV-infected mice at 7 dpi (EH) or at 15, 28, and 65 dpi (IK) and stained for neuronal markers. (E and I) The total number of HuC/D+ neurons in (E) the submucosal plexus and myenteric plexus and (I) the myenteric plexus only was counted and is shown as the number of neurons per mm2. (F and G) The fraction of area that stained positively for nNOS, calretinin, and 5-HT in the myenteric plexus (F) or for calretinin in the submucosal plexus (G); values were normalized to those for sham-infected mice. Circles, squares, and triangles indicate nNOS+, calretinin+, and 5-HT+ neurons, respectively. (H) Images show staining for the indicated markers in the middle small intestine from sham- and WNV-infected mice at 7 dpi in either the myenteric plexus or the submucosal plexus. Scale bars: 100 μm. (J) nNOS+ and calretinin+ and (K) 5-HT+ cell areas; values were normalized to those for sham-infected mice. (IK) Images show staining in the middle small intestine from sham- and WNV-infected mice at 65 dpi. Scale bars: 100 μm. (LO) Analysis of neuron-specific RNA-Seq using TRAP in WNV- or mock-infected Snap25l10a mice at 6 dpi. (L) Principal component analysis (PCA). (M) Volcano plot of differential expression analysis (DEseq2) of translating ribosome affinity purification sequencing (TRAP-Seq) comparing WNV- and mock-infected samples. Red dots indicate a log2 fold change of greater than 1 and a FDR (P-adjusted) of less than 0.05, and blue dots indicate a log2 fold change of 1 or less and a P-adjusted FDR of less than 0.05. (N and O) Heatmap of differentially expressed genes in sham- and WNV-infected mice showing genes related to (N) the response to virus and (O) cytokines and chemokines. Expression levels were normalized across each gene and represent the average of 4 mice per condition. Data were pooled from the following number of experiments: (C and D) 2; (EK) 3 (myenteric plexus) and 2 (submucosal plexus); (F) 3; (G) 2, (I) 3; (J) 2 (15 dpi), 3 (28 dpi), and 4 (65 dpi); and (K) 2 (15 dpi), 3 (28 dpi), and 2 (65 dpi). The numbers of mice per group were as follows: (C) n = 6; (D) n = 9; (E) n = 7–11; (F) n = 6–10; (G) n = 6–7; (I) n = 9–16; (J) n = 8–13; (K) n = 5–10. Column heights in C, EG, and IK indicate mean values. *P < 0.05, **P < 0.01, and ***P < 0.001, by 2-tailed Mann-Whitney U test.
Figure 2
Figure 2. WNV infection affects enteric glial networks.
(AC) The muscularis externa was isolated from middle and distal regions of the small intestine of sham- or WNV-infected C57BL/6J mice at (A and B) 7 dpi or (C) 15, 28, and 65 dpi and stained for glia (S100β). The fraction of area that stained positive for S100β was determined, and the values were normalized to sham-infected mice. Representative images show S100β staining in the middle region of the small intestine in sham- and WNV-infected mice at (A) 7 dpi or (C) 65 dpi. (A and C) Scale bars: 100 μm. Original magnification, ×2.5 (enlarged insets). Data were pooled from (A and B) 2 experiments (n = 5–10) and (C) (left to right) 2, 3, and 4 experiments (n = 6–10, 12–13, and 13–16). Column heights indicate the mean values. *P < 0.05 and **P < 0.01, by 2-tailed Mann-Whitney U test.
Figure 3
Figure 3. WNV infection promotes infiltration of monocytes into the intestine.
(AE) Whole-mount preparations of the muscularis externa were isolated from the middle and distal regions of the small intestine from WNV-infected heterozygous Ccr2-GFP mice at (A and B) 6 or (C) 15 dpi and stained for (A) neuron (HuC/D) and macrophage (Iba1) markers, (B) WNV antigen and macrophage markers, or (CE) macrophage markers. Yellow arrowheads indicate monocytes (CCR2 GFP+Iba1 cells). Scale bars: 100 μm. (AC) Images were obtained from the myenteric plexus of the middle region of the small intestine from at least 2 experiments. (D) Monocytes (Ccr2 GFP+Iba1) in the myenteric plexus are shown as the numbers of cells per mm2. (E) The fraction of Ccr2 GFP+ area (representing monocytes and/or monocyte-derived macrophages) in the myenteric plexus of WNV- or sham-infected mice. (F and G) Muscularis externa of the middle and distal small intestines from sham- or WNV-infected mice harvested at 15, 28, or 65 dpi were stained for Iba1+ macrophages. Macrophages in (F) the myenteric plexus and (G) the circular muscle layer are shown as the number of Iba1+ cells per mm2. Images of Iba1 staining in sham- or WNV-infected mice at 65 dpi. Scale bars: 100 μm. (HJ) GI transit was measured after oral gavage of carmine red dye (H) in sham- or WNV-infected mice (at 7 dpi) after treatment with anti-CCR2 or isotype mAbs (I) in WNV-infected Ccr2+/– and Ccr2–/– mice, and (J) in sham- or WNV-infected mice after treatment with anti-CSF1R or an isotype control mAb. (KM). Whole-mount preparations of the muscularis externa were isolated from the middle region of small intestine of WNV-infected mice treated with anti-CSF1R or isotype mAbs and stained for (K) nNOS+ and calretinin+ neurons, (L) 5-HT+ neurons, or (M) S100β+ glia. Scale bars: 100 μm. The fraction of the area that stained positive for calretinin, nNOS, 5-HT, or S100β; values were normalized to those for sham-infected mice treated with an isotype control mAb. Data were pooled from (D and E) 2; (F and G) 2 (15 dpi); 3 (28 dpi) and 4 (65 dpi); (H) 3; (I) 1; (J) 3; and (KM) 3 experiments. The numbers of mice per group were as follows: (D and E) n = 4–7; (F) n = 9–13; (G) n = 10–12; (H) n = 5–20; (I) n = 7–10; (J) n = 7–16; (K) n = 6–13; (L) n = 5–10; and (M) n = 7–13. Column heights in DG and JL indicate mean values, and lines in HJ indicate median values. *P < 0.05, **P < 0.01, ***P < 0.001, and ****P < 0.0001, by (D, F and G) 2-tailed Mann-Whitney U test and (L) Kruskal-Wallis ANOVA with Dunn’s post test.
Figure 4
Figure 4. Damage to the neuronal and glial networks is caused by CD4+ and CD8+ T cells.
(A and F) GI transit was measured after oral gavage of carmine red dye. (A) Transit time for sham- or WNV-infected WT or TCRbd–/– mice at 7 dpi. (BD, G, and H) The muscularis externa was isolated from (BD) middle and distal regions of the small intestine of sham- or WNV-infected WT or TCRbd–/– mice at 7 dpi, (G and H) middle regions of the small intestine of sham- or WNV-infected WT mice at 7 dpi that were treated with anti-CD4 and/or anti-CD8β or isotype control mAbs and stained for (B and G) calretinin+ and nNOS+ neurons, (C) WNV antigen, (D) S100β+ glia, or (H) and S100β+ glia and WNV antigen. The fraction of the area that stained positive for calretinin, nNOS, or S100β was determined, and the values were normalized to values for (B and D) WT sham-infected mice or (G and H) animals treated with an isotype control mAb. Representative images from the myenteric plexus of the middle region of the small intestine. Scale bars: 100 μm. Original magnification, ×2.5 (enlarged insets). (C) Data are presented as the percentage of WNV antigen+ area in the field of view. (E) Counts of live CD45+TCRβ+CD4+ or CD8+ T cells in the muscularis of sham- or WNV-infected C57BL6/J mice at 7 dpi. (F) Transit time for sham- or WNV-infected mice at 7 dpi; mice were treated with anti-CD4 (α-CD4) and/or anti-CD8β or isotype control mAbs. Data were pooled from (A) 3; (CE, and G) 2; and (F) 4 experiments. The numbers of mice per group were as follows: (A) n = 7–13; (C and D) n = 5–8; (E) n = 6–7; (F) n = 8–18; (G) n = 7–8; (H) n = 6–8. Lines in A, E, and F and column heights in BD, G, and H indicate mean values. *P < 0.05, **P < 0.01, and ***P < 0.001, by (A, B, D, G, and H) Kruskal-Wallis ANOVA with Dunn’s post test (all groups compared with each other); (F) Kruskal-Wallis ANOVA with Dunn’s post test (compared with the isotype control group); and (C) 2-tailed Mann-Whitney U test.
Figure 5
Figure 5. Damage to the neuronal and glial networks is caused by WNV-specific CD8+ and CD4+ T cells.
(AE) CD4+ or CD8+ T cells from WNV-infected WT mice were isolated at 7 dpi and adoptively transferred into TCRbd–/– mice at 2 dpi. (A) GI transit time in recipient TCRbd–/– mice at 7 dpi, (B) proportions of mice with severe GI dysmotility (≥360 min), (C and D) analysis of neuronal (calretinin, nNOS) and glial (S100β) networks from the middle small intestine at 7 dpi, and (E) images obtained from the myenteric plexus of the middle region of small intestine. Scale bars: 100 μm. (F) Flow cytometric analysis of the muscularis externa or mucosa and lamina propria at 7 dpi. Cells were stained with mAbs against CD45, TCRβ, TCRγδ, CD8a, CD44, and WNV NS4B Db–restricted tetramers and gated on live CD45+TCRβ+CD8+ cells (see Supplemental Figure 4C). Graph shows the percentage of CD8+ T cells positive for NS4B. (GI) Adoptive transfer of CD8+ T cells from P14 transgenic mice (targeting LCMV gp33 peptide) or WNV NS4B transgenic mice into TCRbd–/– mice. T cells were administered to TCRbd–/– mice 1 day prior to subcutaneous inoculation with WNV. (G) GI transit 7 dpi, (H and I) analysis of the neuronal (calretinin, nNOS) and glial network (S100β) in middle and distal small intestines at 7 dpi. (A and G) GI transit was measured after oral gavage of carmine red dye. (C, D, H, and I) Fraction of the area that stained positively for calretinin, nNOS, or S100β; values were normalized to (C and D) WT sham mice or (H and I) TCRbd–/– mice without adoptive transfer. Data were pooled from (AD) 6; (F) 2; and (GI) 3 experiments. The numbers of mice per group were as follows: (F) n = 6; (A) n = 8–13; (B) n = 8–13; (C and D) n = 8–13; (F) n = 6; (G) n = 5–9; (H and I) n = 6–10. Lines in G and F and column heights in C, D, H, and I indicate mean values. *P < 0.05 and **P < 0.01, by (C and D) ANOVA with Dunnett’s post test (comparison with the no-transfer group); (B) χ2 test with Bonferroni correction (proportions compared with the no-transfer group); and (GI) Kruskal-Wallis ANOVA with Dunn’s post test (comparison with the no-transfer group).
Figure 6
Figure 6. CD4+ and CD8+ T cells injure neurons and glia using multiple effector functions.
(AD, H, and K) GI tract transit was measured after oral gavage of carmine red dye at 7 dpi. Transit time for sham, WNV-infected WT, or WNV-infected (A) Prf1–/–, (B) Faslgld/gld, (C) Ifngr–/–, and (D) WT mice treated with anti-TNF or isotype control mAb or WNV-infected (H) Prf1–/– or (K) Faslgld/gld mice treated with anti-CD4, anti-CD8β, or isotype control mAb. (E, F, I, J, and L) The muscularis externa was isolated from the middle regions of small intestines from sham-infected, WNV-infected WT, or Prf1–/– mice (E), Faslgld/gld mice (F), WNV-infected Prf1–/– mice (I and J), or Faslgld/gld mice (L) treated with anti-CD4 or anti-CD8β mAb at 7 dpi and then stained. The fraction of the area that stained positive for calretinin, nNOS, or S100β was determined, and values were normalized to those for sham-infected WT mice. (J) Representative images were obtained from the myenteric plexus of the middle region of the small intestine. Scale bars: 100 μm. Original magnification, ×2.5 (enlarged insets). Data were pooled from (AC, F, I, and J) 3; (D, G, and L) 2; (E and K) 5; and (H) 4 experiments. The numbers of mice per group were as follows: (A) n = 4–11; (B) n = 7–10; (C) n = 4–11; (D) n = 10; (E) n = 4–13; (F) n = 6–11; (G) n = 6; (H) n = 9–12; (I) n = 9–12; (K) n = 7–15; (L) n = 6–7. Lines indicate (AD and G) median or (H and K) mean values, and column heights indicate the mean values. *P < 0.05 and **P < 0.01, by (AF, I, and L) Mann-Whitney U test and (H and K) ANOVA with Dunnett’s post test (comparison with the isotype control group).
Figure 7
Figure 7. Mice lacking perforin and Fas/FasL signaling do not develop WNV-triggered GI dysmotility or neuronal and glial network injury.
(A) Scheme for the generation of Prf1–/– Faslgld/gld (DKO) mice. The figure in A was created using BioRender software. (B) GI transit time in WNV-infected WT or DKO mice at 7 dpi. (C) Proportions of WNV-infected WT and DKO mice showing abnormal bowel dilation in the small intestine at 7 dpi. (DG) The muscularis externa was isolated from the middle regions of small intestines from sham- (D and E) or WNV-infected WT or DKO (F and G) mice at 7 dpi and stained. (DF) The fraction of the area that stained positive for calretinin, nNOS, S100β, and WNV antigen was determined, and values were normalized to those for (D and E) sham-infected WT mice or (F) WNV-infected WT mice. (G) The numbers of CD3+ cells in the myenteric plexus were calculated by dividing the area positive for CD3 staining with the average size of CD3+ cells. Cell counts are expressed as the number of CD3+ cells per mm2. (D and G) Representative images of the myenteric plexus of the middle region of the small intestine. Scale bars: 100 μm. Original magnification, ×2.5 (enlarged insets). Data were pooled from (B, C, and F) 5 and (D, E, and G) 4 experiments. The numbers of mice per group were as follows: (B and C) n = 13–16; (D and E) n = 8–10; (F) n = 10–15; (G) n = 10. Lines in B and column heights in DG indicate mean values. *P < 0.05, **P < 0.01, and ***P < 0.001, by (B, F, and G) 2-tailed Mann-Whitney U test and (D and E) Kruskal-Wallis ANOVA with Dunn’s post test.

Comment in

  • Experimental West Nile virus infection provides lessons for recovery from enteric neuropathies

Similar articles

Cited by

References

    1. Spencer NJ, Hu H. Enteric nervous system: sensory transduction, neural circuits and gastrointestinal motility. Nat Rev Gastroenterol Hepatol. 2020;17(6):338–351. doi: 10.1038/s41575-020-0271-2. - DOI - PMC - PubMed
    1. White JP, et al. Intestinal dysmotility syndromes following systemic infection by flaviviruses. Cell. 2018;175(5):1198–1212. doi: 10.1016/j.cell.2018.08.069. - DOI - PMC - PubMed
    1. Klein S, et al. Interstitial cells of Cajal integrate excitatory and inhibitory neurotransmission with intestinal slow-wave activity. Nat Commun. 2013;4:1630. doi: 10.1038/ncomms2626. - DOI - PubMed
    1. Rao M, et al. Enteric glia regulate gastrointestinal motility but are not required for maintenance of the epithelium in mice. Gastroenterology. 2017;153(4):1068–1081. doi: 10.1053/j.gastro.2017.07.002. - DOI - PMC - PubMed
    1. Muller PA, et al. Gut macrophages: key players in intestinal immunity and tissue physiology. Curr Opin Immunol. 2020;62:54–61. doi: 10.1016/j.coi.2019.11.011. - DOI - PMC - PubMed

MeSH terms