Review
. 2024 Aug;44(1):257-288.
doi: 10.1146/annurev-nutr-062322-030557.

Decoding the Foodome: Molecular Networks Connecting Diet and Health

Affiliations
Review

Decoding the Foodome: Molecular Networks Connecting Diet and Health

Giulia Menichetti et al. Annu Rev Nutr. 2024 Aug.

Abstract

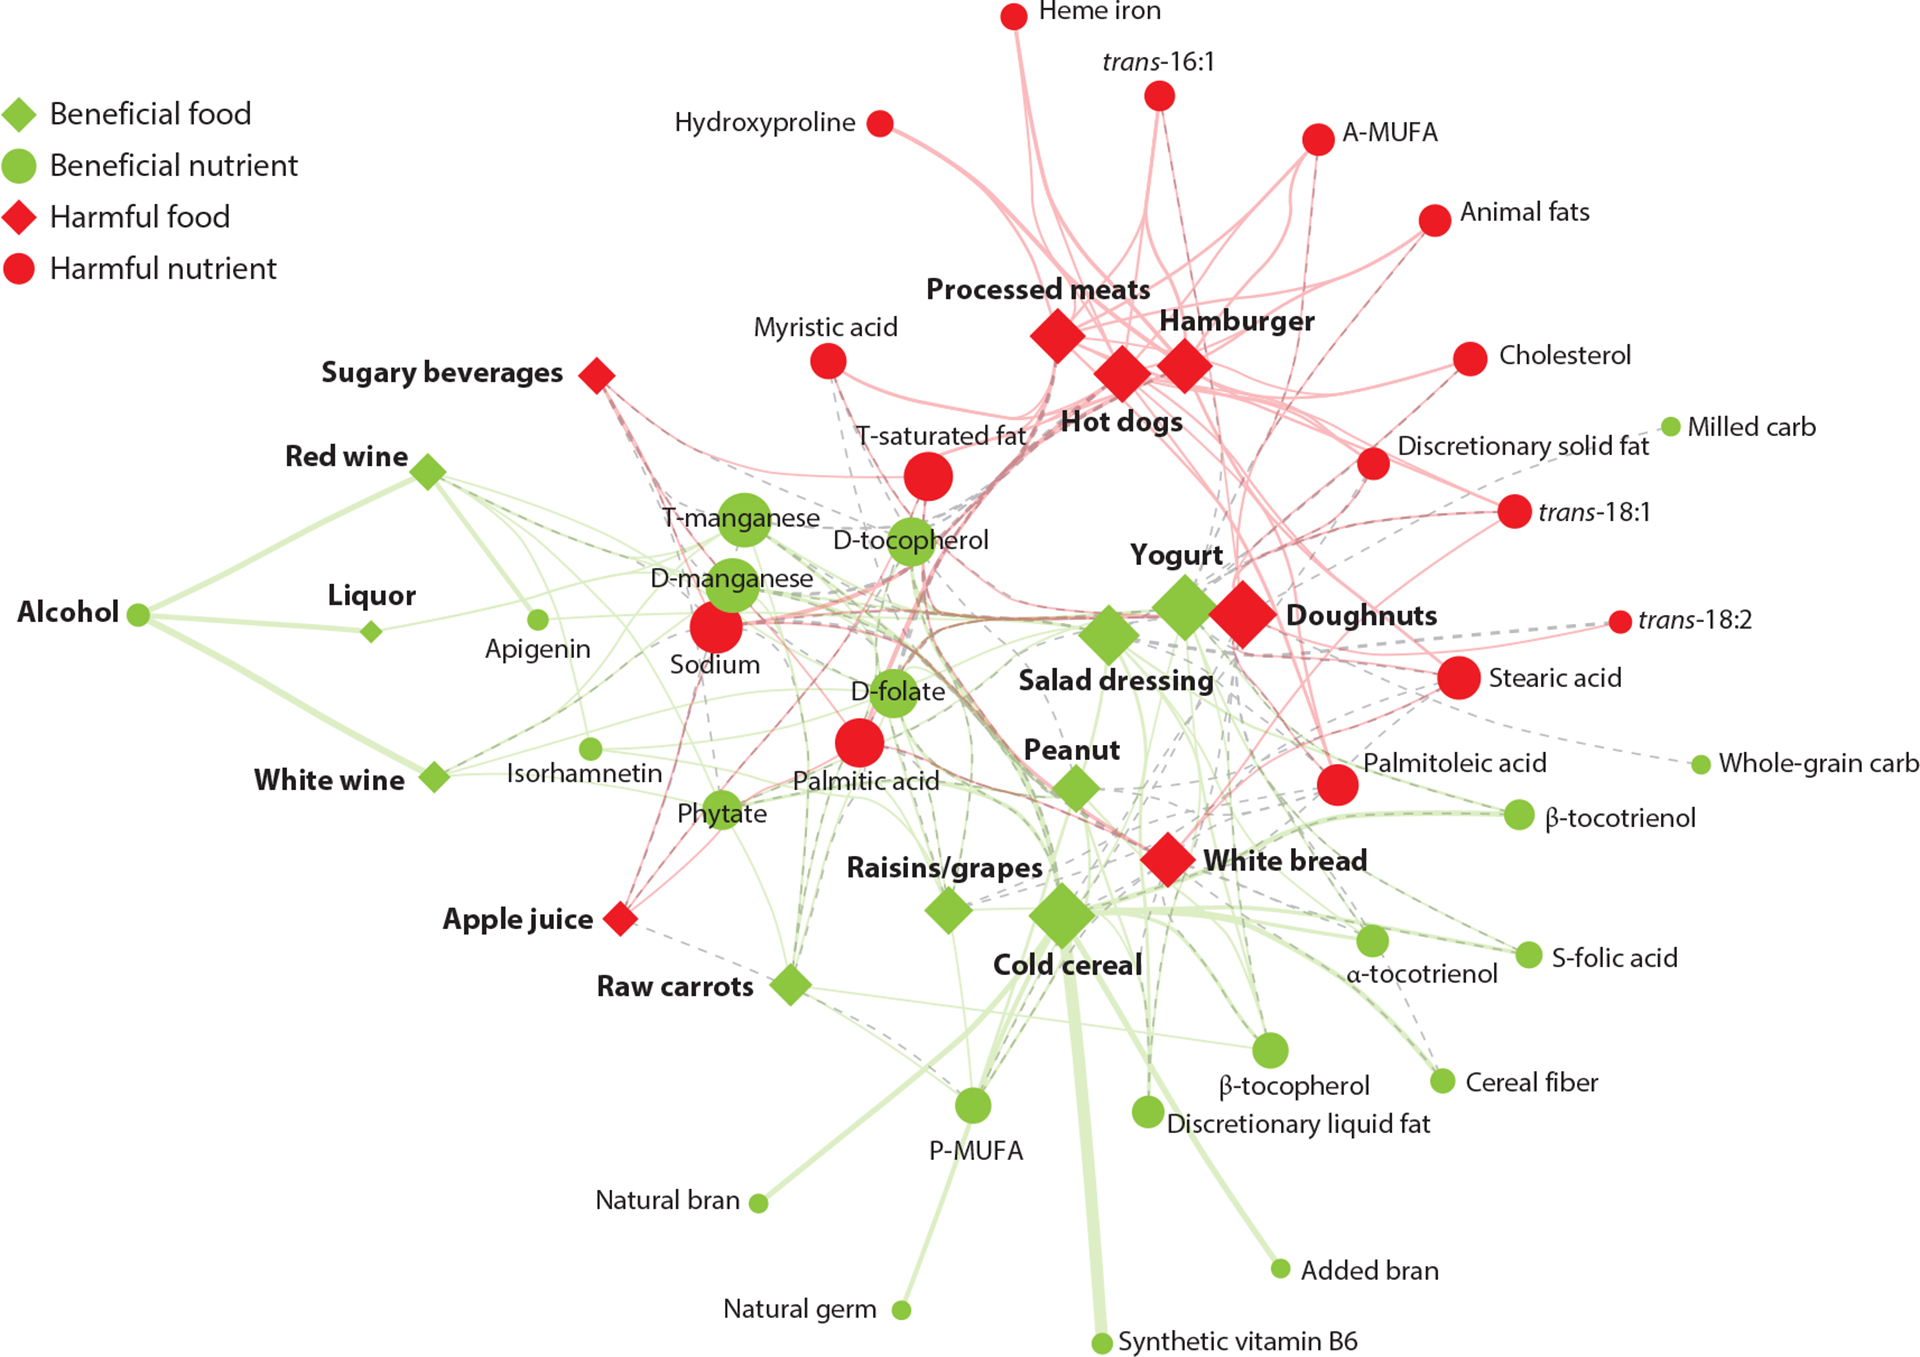
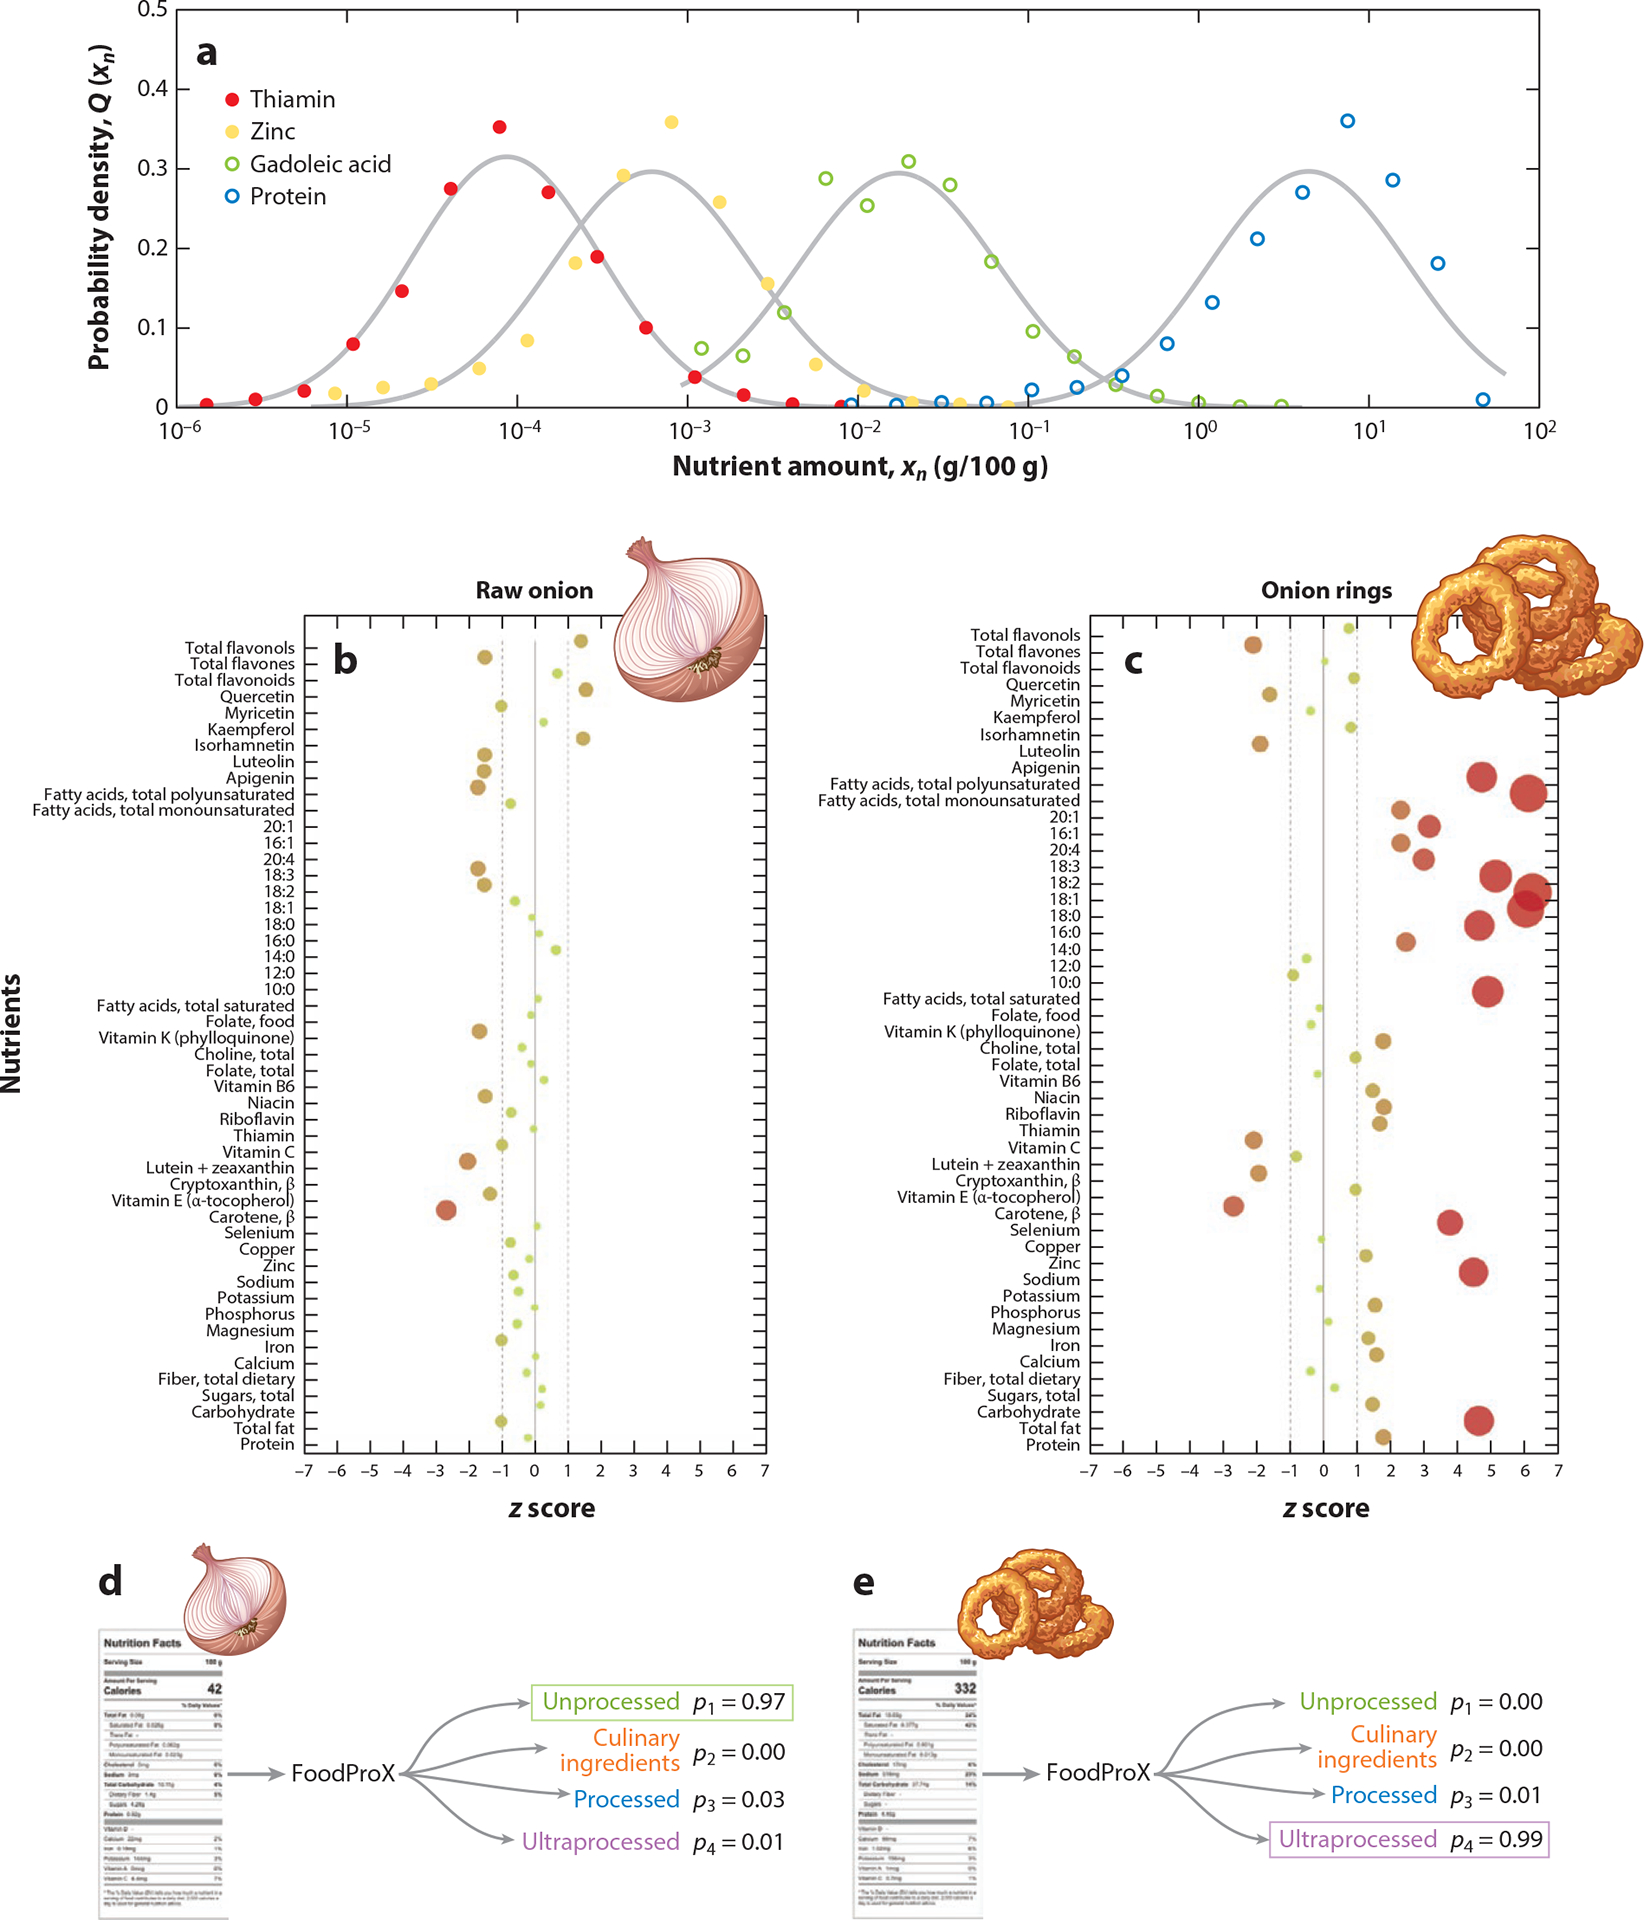
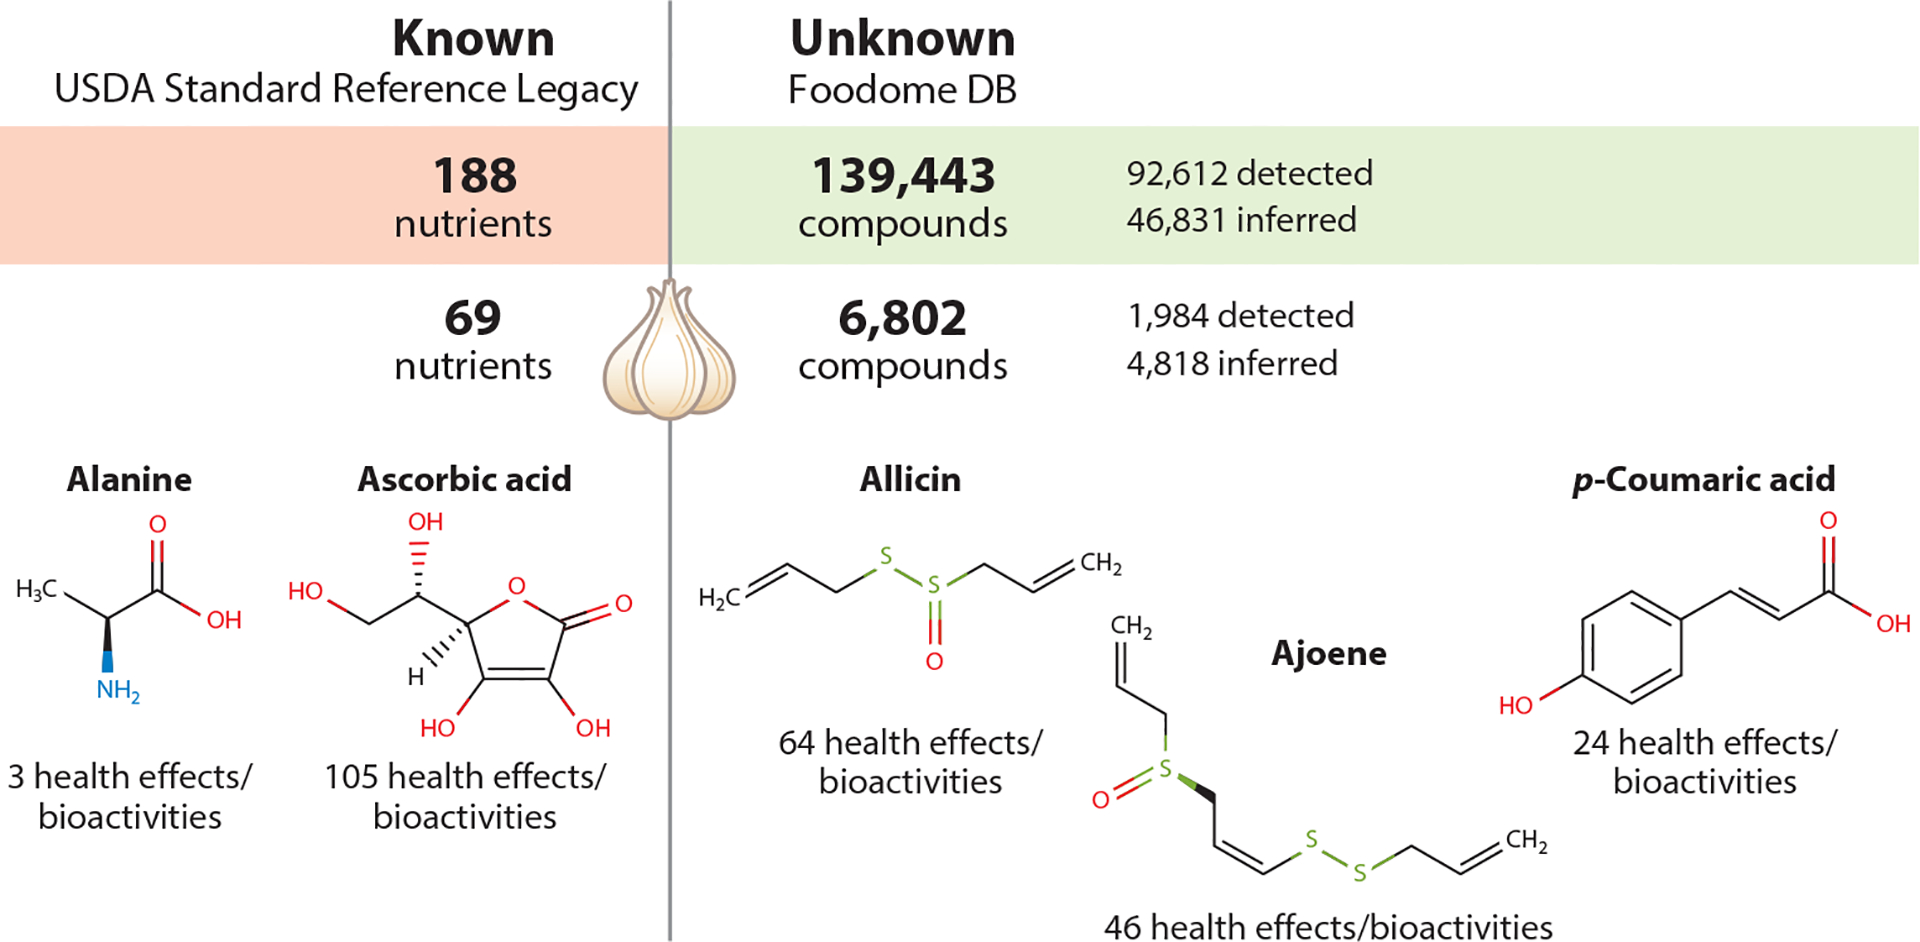
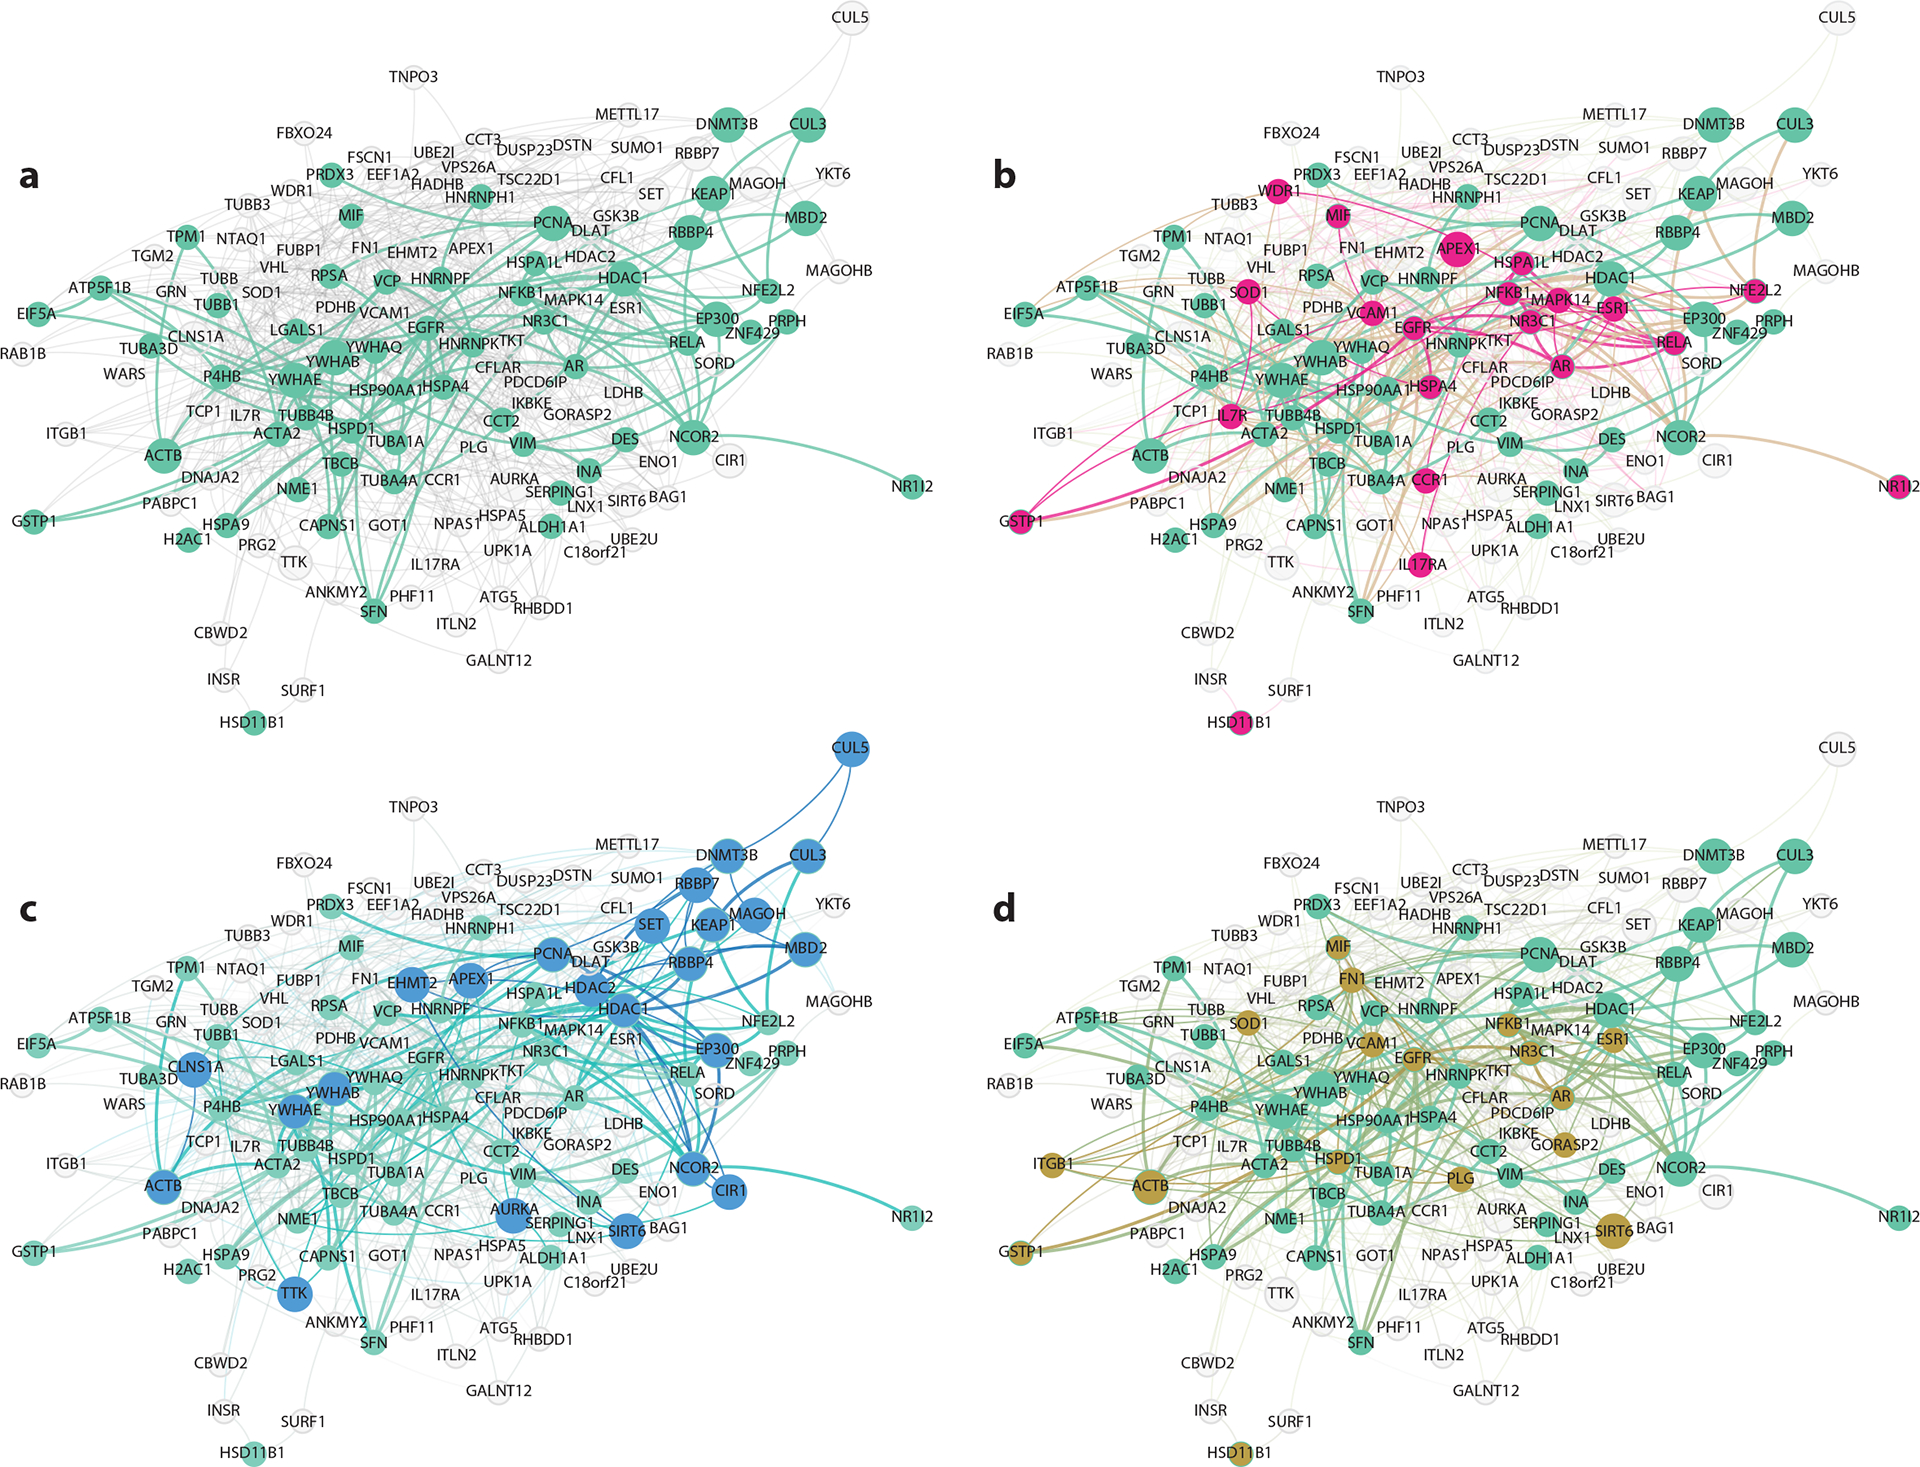
Diet, a modifiable risk factor, plays a pivotal role in most diseases, from cardiovascular disease to type 2 diabetes mellitus, cancer, and obesity. However, our understanding of the mechanistic role of the chemical compounds found in food remains incomplete. In this review, we explore the "dark matter" of nutrition, going beyond the macro- and micronutrients documented by national databases to unveil the exceptional chemical diversity of food composition. We also discuss the need to explore the impact of each compound in the presence of associated chemicals and relevant food sources and describe the tools that will allow us to do so. Finally, we discuss the role of network medicine in understanding the mechanism of action of each food molecule. Overall, we illustrate the important role of network science and artificial intelligence in our ability to reveal nutrition's multifaceted role in health and disease.

Keywords: artificial intelligence; complexity; machine learning; network medicine; network science; nutrition; systems pharmacology.


Figures

Figure 1
Figure 1
The knowledge graph connecting dietary factors and CVDs analyzed in NHS data. The graph consists of two sets of nodes: dietary exposures represented by circles, and CVDs represented by diamonds. Protective associations are depicted by green links, harmful associations by red links, and associations that were tested but not found to be statistically significant are shown in gray. In the context of NHS, CHD refers to nonfatal MI and fatal CHD, while CAD refers to nonfatal MI and fatal CAD. CVD is defined as a composite of CAD and nonfatal or fatal stroke. Abbreviations: A, animal; ALA, alpha-linolenic acid; CAD, coronary artery disease; CHD, coronary heart disease; CVD, cardiovascular disease; D, dietary; DASH, dietary approaches to stop hypertension; DHA, docosahexaenoic acid; DPA, docosapentaenoic acid; FA, fatty acids; FGF, fibroblast growth factor; FGI, food group index; GLS, glucosinolate; LCD, low carbohydrate diet; MDDW, minimal diet diversity score for women; MI, myocardial infarction; MUFA, monounsaturated fatty acids; NHS, Nurses’ Health Study; P, plant; PDQS, prime diet quality score; PPI, proton pump inhibitor; PTH, plasma parathyroid hormone; PUFA, polyunsaturated fatty acids; rep, replaced with; S, supplemental; SSB, sugar-sweetened beverage; SFA, saturated fatty acids; sTfR, soluble transferrin receptor; T, total; USFA, unsaturated fatty acids; VLCSFA, very-long-chain saturated fatty acids. Figure and caption adapted from Reference (CC BY 4.0).
Figure 2
Figure 2
The food–nutrient network of dietary exposures associated with CHD. In this bipartite food–nutrient network, protective factors are colored in green and detrimental factors in red. Different shapes distinguish between nutrients (circles) and foods (diamonds), while the size of each node corresponds to the estimated effect size in absolute value. The edge thickness indicates the contribution of a specific food to the overall quantity of a nutrient in the food supply. Abbreviations: A, animal; CHD, coronary heart disease; D, dietary; MUFA, monounsaturated fatty acids; P, plant; S, supplemental; T, total. Figure and caption adapted from Reference (CC BY 4.0).
Figure 3
Figure 3
Nutrient composition of food. According to the Food and Nutrient Database for Dietary Studies, the consumption of 100 g of raw onion delivers 45 nutritional components, whose amounts (measured in grams) span eight orders of magnitude. Among these 45 nutrients are compounds from different chemical classes, such as copper (a mineral), linoleic acid (a polyunsaturated omega-6 fatty acid, the most typical isomer of fatty acid 18:2), and quercetin (a flavonol). We rank the nutrients in onion in descending order of concentration on the ordinate axis. The gram amount of nutrient n per 100 g is reported as xn.
Figure 4
Figure 4
Large-scale analysis of nutrient concentrations in food. (a) The concentration probability distribution Q(𝑥𝑛) for four nutrients across the 4,889 foods reported in NHANES 2009–2010 data, shown on a logarithmic horizontal axis. The four distributions are approximately symmetric on a log scale and have similar width and shape that are independent of the average concentration of the respective nutrient. Each symbol represents a histogram bin. (b,c) The observed common scale of nutrient fluctuations observed in the log space allows us to rescale all nutrients and compare them on a single plot, suggesting a methodology to detect foods with outlier concentrations. The pattern of nutrient outliers in different foods (quantified by a z score in the log space) is informative of the type and extent of processing, as shown here for (b) 100 g of raw onion compared with (c) 100 g of onion rings. (d,e) FoodProX is a random forest classifier that was trained over the nutrient concentrations within 100 g of each food, tasking the classifier to predict its processing level according to NOVA. FoodProX represents each food by a vector of probabilities {pi}, capturing the likelihood of the food being classified as an unprocessed food (NOVA 1), a processed culinary ingredient (NOVA 2), a processed food (NOVA 3), or an ultraprocessed food (NOVA 4). The final classification label, highlighted with a box on the right, is determined by the highest probability. The probability values were rounded to two decimal places. Abbreviation: NHANES, National Health and Nutrition Examination Survey. Panel a adapted from Reference . Panels d and e adapted from Reference (CC BY 4.0).
Figure 5
Figure 5
FPro’s variability with food categories. Distribution of FPro for the food categories in What We Eat in America (WWEIA) data (2015–2016) with at least five items. WWEIA categories group foods and beverages with similar usage and nutrient content in the US food supply. All categories are ranked in increasing order of median FPro, indicating that each food group varies widely in FPro, thereby confirming the presence of different degrees of processing. The figure shows four ready-to-eat cereals, all manually classified as NOVA 4, that have different FPro values. While the differences between the nutrient content of Post Shredded Wheat ‘n Bran (FPro = 0.5658) and that of Post Shredded Wheat (FPro = 0.5685) are minimal, with lower fiber content for the latter, fortification with vitamins and minerals as well as the addition of sugar significantly increases the processing of Post Grape-Nuts (FPro = 0.9603), and the addition of fats results in an even higher processing score for Post Honey Bunches of Oats with Almonds (FPro = 0.9999). These data show how FPro ranks progressive changes in nutrient content. Figure and caption adapted from Reference (CC BY 4.0).
Figure 6
Figure 6
The dark matter of nutrition. The United States Department of Agriculture (USDA) has systematically measured 188 nutritional components that encompass essential micro- and macronutrients related primarily to energy intake and vitamin deficiencies. Although this knowledge has been transformative for the health sciences, these nutritional components represent only a fraction of the more than 139,000 chemicals we have collected, many of which have documented effects. For example, the 69 nutrients documented by the USDA Standard Reference Legacy database for raw garlic include vitamins such as ascorbic acid and amino acids such as alanine but miss important bioactive compounds such as allicin, ajoene, and p-coumaric acid. The number of health effects/bioactivities documented in FooDB is shown for each compound.
Figure 7
Figure 7
The network medicine framework. The human interactome is the sum of all experimentally validated physical interactions (links) between proteins and transcription factors (nodes). Proteins linked to a specific phenotype or disease congregate in well-defined regions of the human interactome, forming disease modules (red, yellow). By binding to human proteins, both drugs and food molecules can perturb the cellular network, resulting in therapeutically beneficial local changes. Understanding which food molecules target the interactome could offer potential pathways for the discovery of food-based therapeutic interventions.
Figure 8
Figure 8
The network neighborhood of sulforaphane’s targets in the protein–protein interaction network. (a) Network neighborhood of sulforaphane’s largest connected component comprising 49 targets, surrounded by 9 additional isolated targets. Green indicates both sulforaphane’s targets and the binding links connecting them. Gray indicates proteins close to sulforaphane’s targets. (bd) Within the same region of the interactome are proteins belonging to the modules of inflammation (magenta), epigenetic modifiers (blue), and coronary artery disease (gold). Proteins that are both sulforaphane’s targets and associated with a therapeutic area are filled with the color of the selected therapeutic area, while their border is colored green.
Figure 9
Figure 9
The protein–protein interactions of polyphenol targets for 23 polyphenols forming connected components in the interactome (protein targets retrieved from STITCH). For instance, piceatannol targets constitute a single connected component comprising 23 proteins, whereas quercetin targets form several connected components, with the largest consisting of 140 proteins. Polyphenol targets disconnected from other targets are omitted from the visualization. Different colors are used to denote connected components associated with different polyphenols. Figure and caption adapted from Reference .
Figure 10
Figure 10
RA modulates platelet function. (a) Chemical structure of RA, a flavonoid commonly found in plants such as Perilla frutescens L., Rosmarinus officinalis L., and Melissa officinalis L. (b) Interactome neighborhood illustrating RA targets alongside the RA/VD platelet module, a connected subgraph composed by the RA target FYN and the VD proteins linked to platelet function (PDE4D, CD36, and APP), as well as the receptors for platelet agonists used in the experiments (collagen/CRPXL, TRAP-6, U46619, and ADP). (c,d) PRP or washed platelets were pretreated with RA for 1 h before CRP (CRPXL, 1 μg/mL) or U46619 (1 μM) stimulation, followed by assessment of (c) aggregation or (d) α-granule secretion. Abbreviations: CRP, collagen-related peptide; PRP, platelet-rich plasma; RA, rosmarinic acid; VD, vascular disease. Panels b, c, and d and caption text adapted from Reference .

Similar articles

Cited by

References

    1. Adjibade M, Julia C, Allès B, Touvier M, Lemogne C, et al. 2019. Prospective association between ultra-processed food consumption and incident depressive symptoms in the French NutriNet-Santé cohort. BMC Med. 17(1):78. - PMC - PubMed
    1. Afendi FM, Okada T, Yamazaki M, Hirai-Morita A, Nakamura Y, et al. 2012. KNApSAcK family databases: integrated metabolite–plant species databases for multifaceted plant research. Plant Cell Physiol. 53(2):e1. - PubMed
    1. Aguilera JM. 2019. The food matrix: implications in processing, nutrition and health. Crit. Rev. Food Sci. Nutr 59(22):3612–29 - PubMed
    1. Alonso-Pedrero L, Ojeda-Rodríguez A, Martínez-González MA, Zalba G, Bes-Rastrollo M, Marti A. 2020. Ultra-processed food consumption and the risk of short telomeres in an elderly population of the Seguimiento Universidad de Navarra (SUN) Project. Am. J. Clin. Nutr 111(6):1259–66 - PubMed
    1. Int AOAC. 2023. Official Methods of Analysis of AOAC International, Vols. 1–2. Washington, DC: Oxford Univ. Press. 22nd ed.

LinkOut - more resources