. 2024 Aug 1;5(8):1154-1166.
doi: 10.34067/KID.0000000000000491. Epub 2024 Jul 2.

Increased Urine Excretion of Neutrophil Granule Cargo in Active Proliferative Lupus Nephritis

Affiliations

Increased Urine Excretion of Neutrophil Granule Cargo in Active Proliferative Lupus Nephritis

Nicholas A Shoctor et al. Kidney360. .

Abstract

Key Points:

  1. Neutrophil degranulation participates in glomerular injury in proliferative lupus nephritis.

  2. Urine excretion of neutrophil granule proteins is a potential diagnostic for proliferative lupus nephritis.

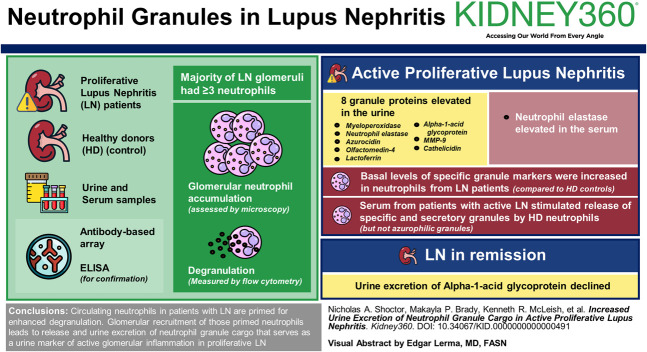
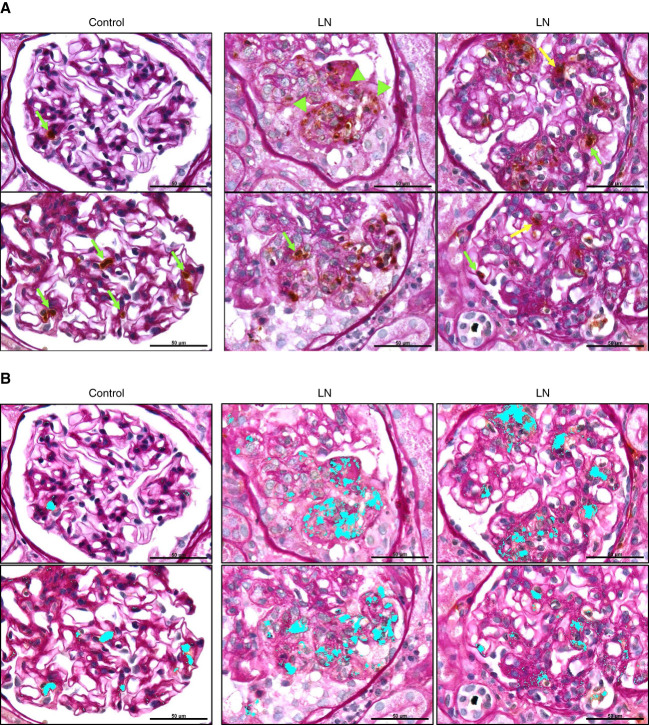
Background: Lupus nephritis (LN) occurs in more than half of patients with systemic lupus erythematosus, but the cellular and molecular events that contribute to LN are not clearly defined. We reported previously that neutrophil degranulation participates in glomerular injury in mouse models of acute LN. This study tests the hypothesis that glomerular recruitment and subsequent activation of neutrophils result in urine excretion of neutrophil granule constituents that are predictive of glomerular inflammation in proliferative LN.

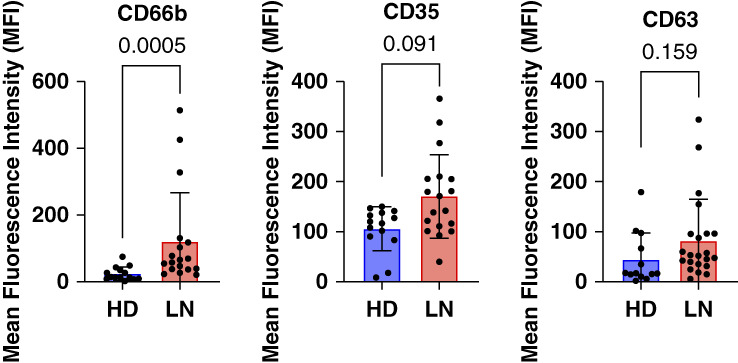
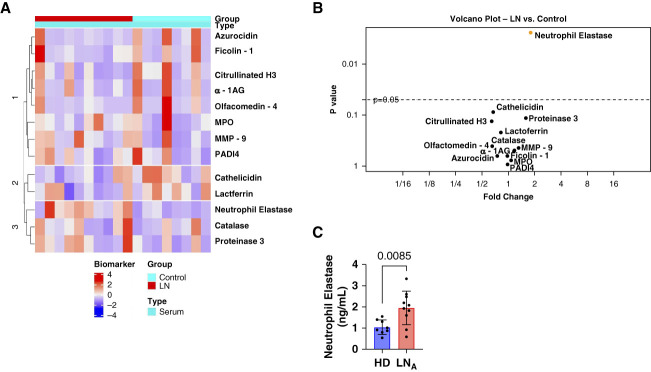
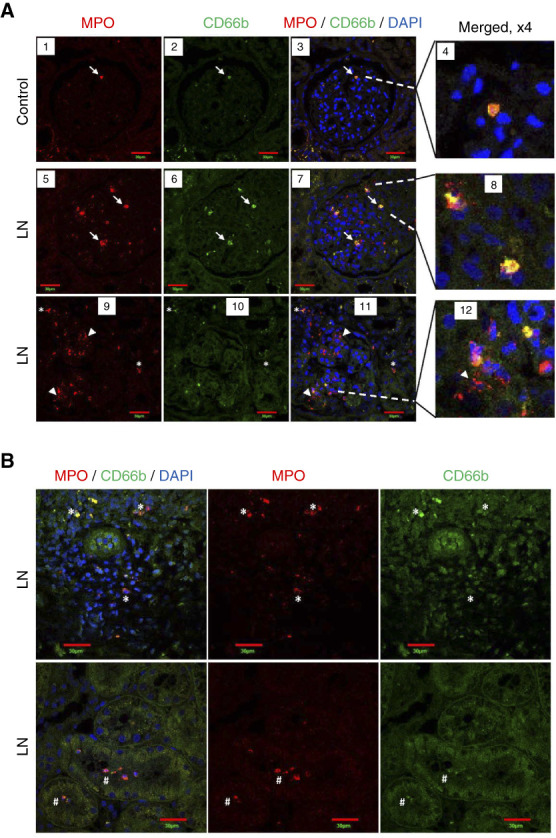
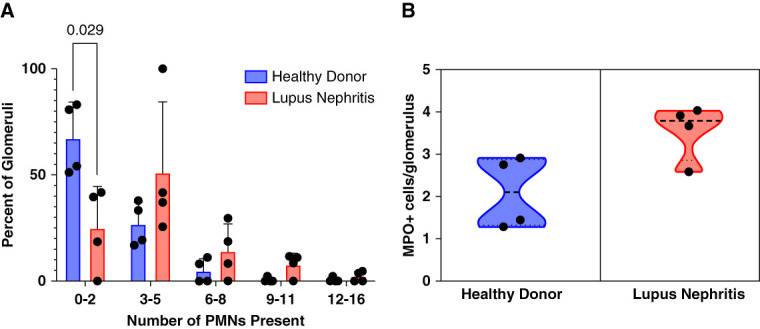
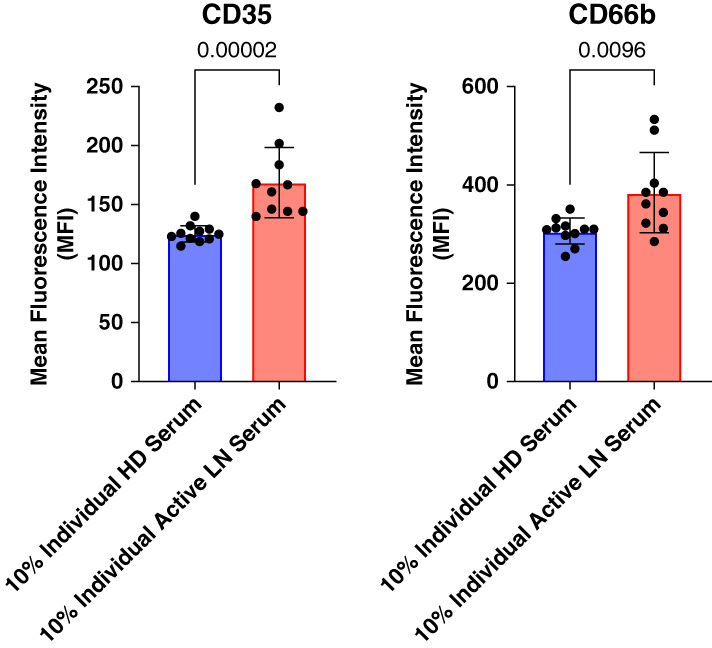
Methods: Urine and serum levels of 11 neutrophil granule proteins were measured by antibody-based array in patients with proliferative LN and healthy donors (HDs), and the results were confirmed by ELISA. Glomerular neutrophil accumulation was assessed in biopsies of patients with LN who contributed urine for granule cargo quantitation and normal kidney tissue by microscopy. Degranulation was measured by flow cytometry in neutrophils isolated from patients with LN and HD controls by cell surface granule markers CD63 (azurophilic), CC66b (specific), and CD35 (secretory). Nonparametric statistical analyses were performed and corrected for multiple comparisons.

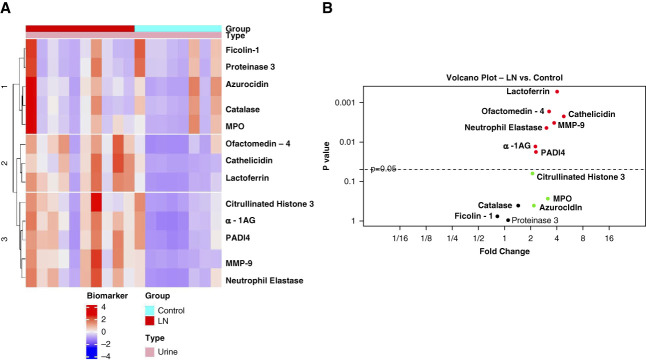
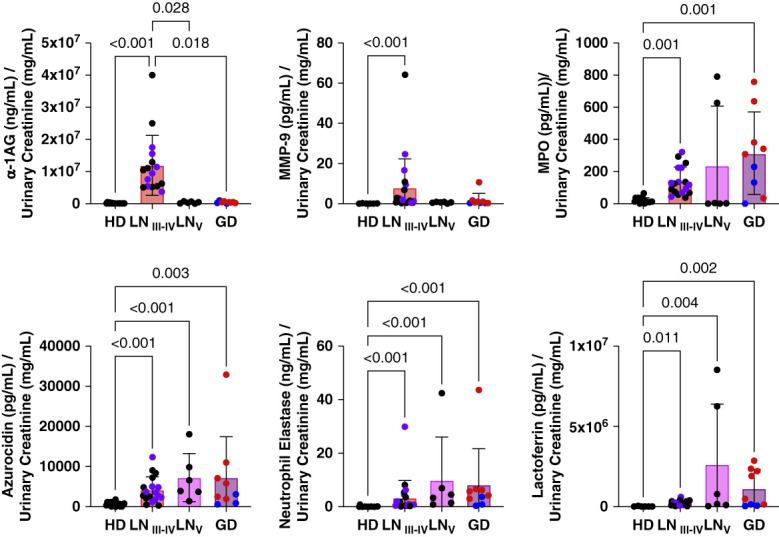
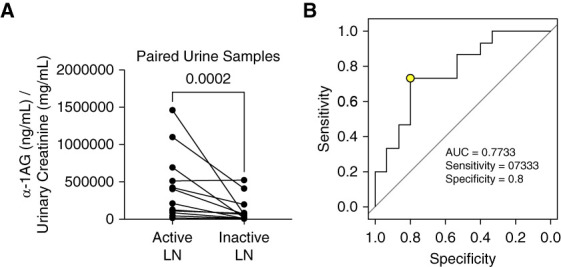
Results: Eight granule proteins (myeloperoxidase, neutrophil elastase, azurocidin, olfactomedin-4, lactoferrin, alpha-1-acid glycoprotein 1, matrix metalloproteinase 9, and cathelicidin) were significantly elevated in urine from patients with active proliferative LN by array and/or ELISA, whereas only neutrophil elastase was increased in LN serum. Urine excretion of alpha-1-acid glycoprotein 1 declined in patients who achieved remission. The majority of LN glomeruli contained ≥3 neutrophils. Basal levels of specific granule markers were increased in neutrophils from patients with LN compared with HD controls. Serum from patients with active LN stimulated specific and secretory, but not azurophilic granule, release by HD neutrophils.

Conclusions: Circulating neutrophils in patients with LN are primed for enhanced degranulation. Glomerular recruitment of those primed neutrophils leads to release and urine excretion of neutrophil granule cargo that serves as a urine marker of active glomerular inflammation in proliferative LN.


Conflict of interest statement

Disclosure forms, as provided by each author, are available with the online version of the article at http://links.lww.com/KN9/A553.

Figures

None
Graphical abstract
Figure 1
Figure 1
Urine excretion of neutrophil granule proteins is enhanced in LN. Urine protein concentrations of 11 granule proteins and two NET-associated proteins were measured by custom antibody-based array (RayBiotech) and normalized to urinary creatinine concentrations in ten patients with LN and eight HDs. (A) The scaled and centered data were plotted as a heatmap in which the different colors represent biomarker expression levels. The biomarkers and samples were then subjected to hierarchical clustering based on Euclidean distance. (B) Volcano plot where each point represents one protein. The protein values were summarized by mean and SD or median with minimum and maximum responses across the groups. The fold change between groups was calculated as the ratio of the mean or median. If a protein met or did not meet normality criteria across the group, the significance of expression difference was evaluated by the paired t test or signed-rank test, respectively. Proteins with FDR <0.05 were considered as differentially expressed. α-1AG, alpha-1-acid glycoprotein 1; FDR, false discovery rate; LN, lupus nephritis; MMP-9, matrix metalloproteinase 9; MPO, myeloperoxidase; NET, neutrophil extracellular trap; PADI4, peptidyl arginine deiminase 4.
Figure 2
Figure 2
Enhanced urine excretion of granule proteins is associated with LN activity. Enhanced excretion of granule proteins were validated and compared in urine from patients with proliferative LN (LN 3–4), class 5 LN (LN 5), MCD, and primary MGN (other GD) and HDs by ELISA with normalization to urine creatinine concentrations. Azurophilic granule constituents measured included MPO (n=16 HD, n=18 LN 2–4, n=6 LN 5, n=9 GD), neutrophil elastase (n=16 HD, n=21 LN 2–4, n=6 LN 5, n=9 GD), and azurocidin (n=16 HD, n=18 LN 2–4, n=6 LN 5, n=9 GD). Specific granule constituents measured were α-1AG (n=15 HD, n=16 LN 2–4, n=6 LN 5, n=9 GD) and lactoferrin (n=6 HD, n=21 LN 2–4, n=6 LN 5, n=9 GD). The gelatinase granule constituent measured was MMP-9 (n=6 HD, n=21 LN I2–4, n=6 LN 5, n=9 GD). P values are shown for comparisons with statistical significance. MGN (red) and MCD (blue) results were include together as other GDs. In the proliferative LN group, purple represents patients with crescentic glomeruli on kidney biopsy. Enhanced granule protein excretion of granule proteins was validated in a separate patient cohort by ELISA with normalization to urine creatinine concentrations. The data were statistically analyzed using a series of Kruskal–Wallis tests with post hoc–corrected Dunn tests for multiple comparisons. Data were represented as mean±SD. GD, glomerular disease; HD, healthy donor; MCD, minimal change disease; MGN, membranous nephropathy.
Figure 3
Figure 3
Urine levels of specific granule protein α-1AG decease with LN remission. (A) α-1AG concentrations in paired urine samples from patients with proliferative LN during active disease and during remission (inactive LN) were measured by ELISA and normalized to urine creatinine concentrations. The normalized values were statistically analyzed using a Wilcoxon matched-pairs signed rank test (n=15 paired samples) and P value shown. (B) A ROC curve was generated using the data from (A) to determine how well a given protein value can predict a patient's disease status (active or inactive LN). The optimal cutoff value between disease states was marked by a yellow circle. ROC, receiver operating characteristic.
Figure 4
Figure 4
Neutrophil degranulation is enhanced in patients with LN. Neutrophil degranulation was assessed by untreated/basal cell surface expression of markers for secretory vesicles (CD35; n=15 LN, n=14 control), specific granules (CD66; n=15 LN, n=13 control), and azuophilic granules (CD63; n=22 LN, n=13 control) by flow cytometry. Statistical analysis comparing the two independent groups was performed by Mann–Whitney tests with post hoc Bonferroni correction for multiple comparisons and P values shown. Data were represented as mean±SD. MFI, mean fluorescence intensity.
Figure 5
Figure 5
Serum concentration of granule proteins in LN. (A) Serum from the same ten patients with LN and eight HDs was examined for expression of 11 granule proteins and two NET-associated proteins by custom antibody-based array (RayBiotech). The scaled and centered data were plotted as a heatmap in which the different colors represent biomarker expression levels. The proteins and samples were then subjected to hierarchical clustering based on Euclidean distance. (B) Volcano plot where each point represents one biomarker. The protein values were summarized by its mean and SD or median with minimum and maximum responses across the groups. The fold change between groups was calculated as the ratio of the mean or median. If a protein met or did not meet normality criteria across the group, the significance of expression difference was evaluated by the paired t test or signed-rank test, respectively. Proteins with FDR <0.05 were considered as differentially expressed. (C) ELISA validation of serum neutrophil elastase (n=10 active LN, n=6 control). LNA represents active LN. The data were analyzed using a Mann–Whitney test. Data were represented as mean±SD.
Figure 6
Figure 6
Neutrophils in kidneys of patients with LN and controls. Kidneys from controls and patients with LN were co-immunostained for MPO (red staining) and CD66b (green staining). Nuclei were stained with DAPI. (A) Glomerulus from a control (panels 1–4) shows an intact PMN (white arrow) expressing MPO and CD66b (colocalization shown in yellow). Glomeruli from patients with LN also contain intact PMNs (panels 5–8; white arrows) with MPO and CD66b colocalized within cells, as well as areas with dispersed/diffuse MPO staining, suggestive of extracellular localization (panels 9–12; white arrowheads). (B) Neutrophils positive for MPO and CD66b staining are present in the interstitial regions (white asterisk, top row) and inside tubule lumen (white pound sign, bottom row) in kidneys of patients with LN. n=4/group. Single plane confocal images are shown. Scale bars: 30 µm. DAPI, 4’,6-diamidino-2-phenylindole; PMN, polymorphonuclear neutrophil.
Figure 7
Figure 7
Glomerular neutrophil recruitment in LN. Kidney sections from patients with LN and controls were immunohistochemically stained for MPO. Total number of glomeruli in each section was counted and number of MPO-stained neutrophils in each glomerulus. (A) Percentage of glomeruli with different range of neutrophil numbers/glomerulus are shown. Bar graph represents average for each group (control or LN) with glomeruli containing neutrophils in each range (0–2, 3–5, 6–8, 9–11, 12–16), ±SD n=4/group. Data were analyzed using a series of Mann–Whitney tests. (B) Average number of neutrophils/glomerulus in control and LN sections. Ratio of total number of neutrophils/total number of glomeruli for each sample was calculated and averaged for each group. Data are displayed as averages±SD with n=4 per group.
Figure 8
Figure 8
Localization of neutrophils and pattern of MPO staining within glomeruli of patients with LN and controls. To correlate neutrophil localization in glomeruli and MPO staining with glomerular histology, kidney sections from patients with LN and controls were immunohistochemically stained for MPO, followed by PAS staining of the section to define glomerular structure and pathology. (A) Glomeruli from controls show intact neutrophils (brown cells) contained within glomerular capillary loops (green arrows). Glomeruli from patients with LN contain intact neutrophils in capillary loops (green arrows) and the mesangial matrix or transmigrated from capillary lumen (yellow arrow). Glomeruli from patients with LN show diffuse/extracellular MPO staining around capillary loops or the mesangial matrix (green arrowheads). (B) To more clearly show the pattern of MPO staining in glomeruli, brown MPO staining was detected with Image Pro software in the same images as shown in (A), and the detected MPO staining area is highlighted in Cyan. Images are representative of n=4/group. Original magnification, 100×. Scale bar: 50 µm. PAS, periodic acid–Schiff.
Figure 9
Figure 9
Neutrophil degranulation is stimulated by LN sera. Neutrophils isolated from HDs were incubated with sera from 11 patients with LN and nine HDs. Degranulation was measured as plasma membrane expression of CD35 for secretory vesicles and CD66b for specific granules. Statistical analyses for comparison of more than two independent groups were performed by Kruskal–Wallis tests with post hoc–corrected Dunn tests and P values shown. Data are displayed as averages±SD.

Similar articles

Cited by

References

    1. Moulton VR, Suarez-Fueyo A, Meidan E, Li H, Mizui M, Tsokos GC. Pathogenesis of human systemic lupus erythematosus: a cellular perspective. Trends Mol Med. 2017;23(7):615–635. doi: 10.1016/j.molmed.2017.05.006 - DOI - PMC - PubMed
    1. Tsokos GC, Lo MS, Costa Reis P, Sullivan KE. New insights into the immunopathogenesis of systemic lupus erythematosus. Nat Rev Rheumatol. 2016;12(12):716–730. doi: 10.1038/nrrheum.2016.186 - DOI - PubMed
    1. Almaani S, Meara A, Rovin BH. Update on lupus nephritis. Clin J Am Soc Nephrol. 2017;12(5):825–835. doi: 10.2215/CJN.05780616 - DOI - PMC - PubMed
    1. Anders HJ, Saxena R, Zhao MH, Parodis I, Salmon JE, Mohan C. Lupus nephritis. Nat Rev Dis Primers. 2020;6(1):7. doi: 10.1038/s41572-019-0141-9 - DOI - PubMed
    1. Hachiya A Karasawa M Imaizumi T, et al. The ISN/RPS 2016 classification predicts renal prognosis in patients with first-onset class III/IV lupus nephritis. Sci Rep. 2021;11(1):1525. doi: 10.1038/s41598-020-78972-1 - DOI - PMC - PubMed