. 2024 Aug 29:13:RP98677.
doi: 10.7554/eLife.98677.

Opposing actions of co-released GABA and neurotensin on the activity of preoptic neurons and on body temperature

Affiliations

Opposing actions of co-released GABA and neurotensin on the activity of preoptic neurons and on body temperature

Iustin V Tabarean. Elife. .

Abstract

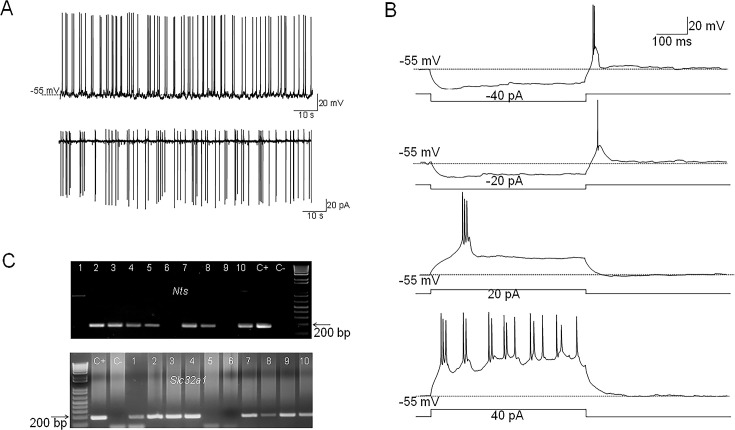
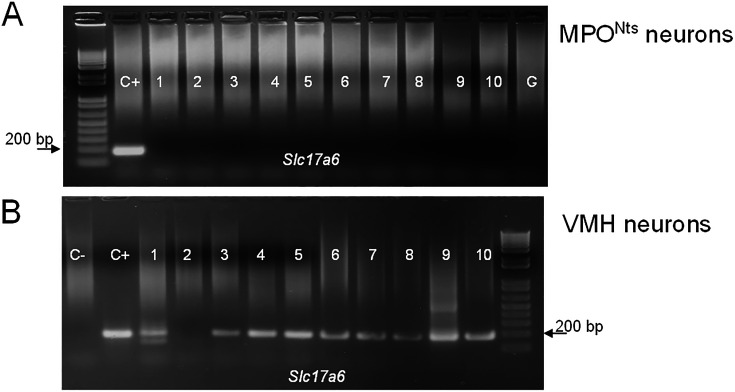
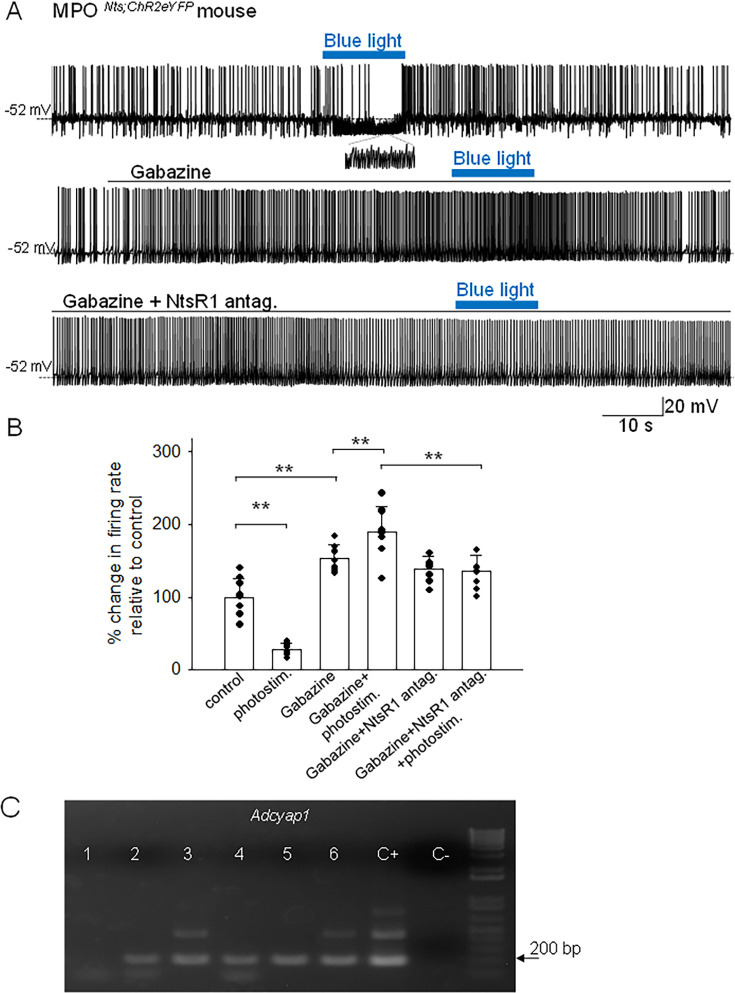
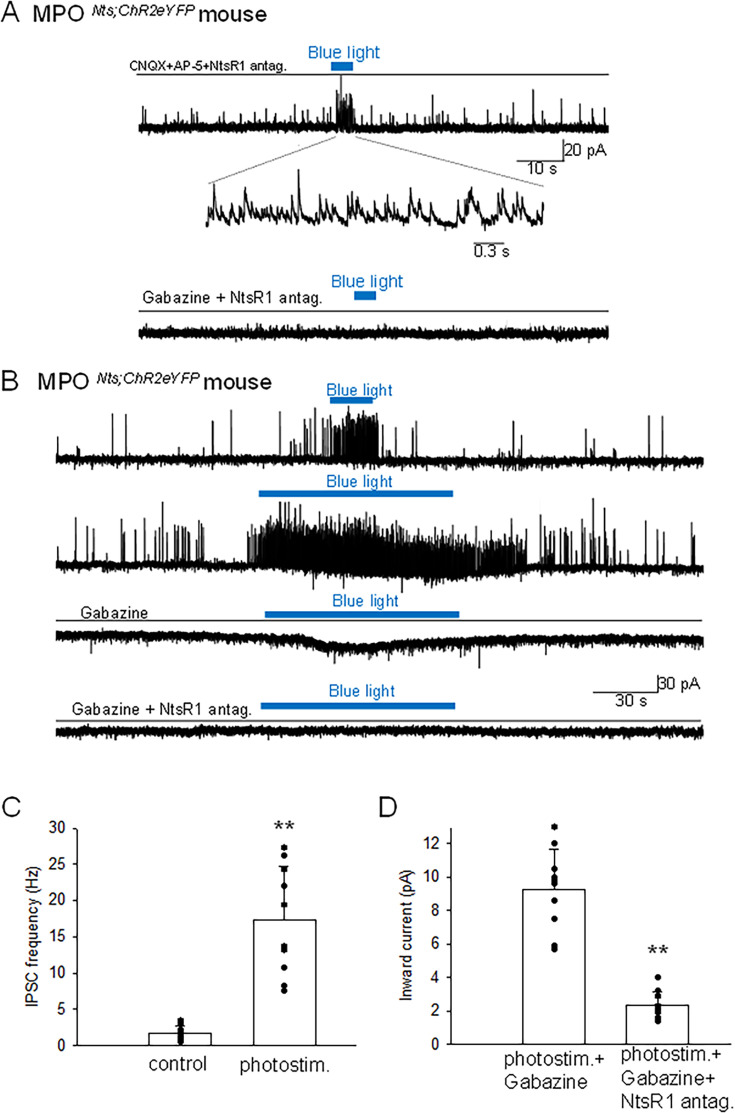
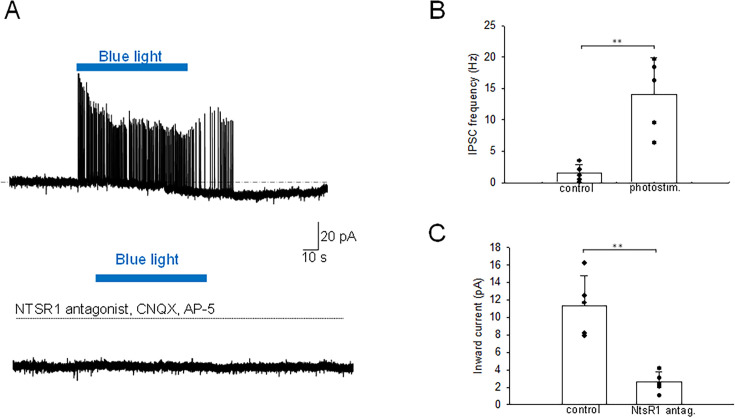
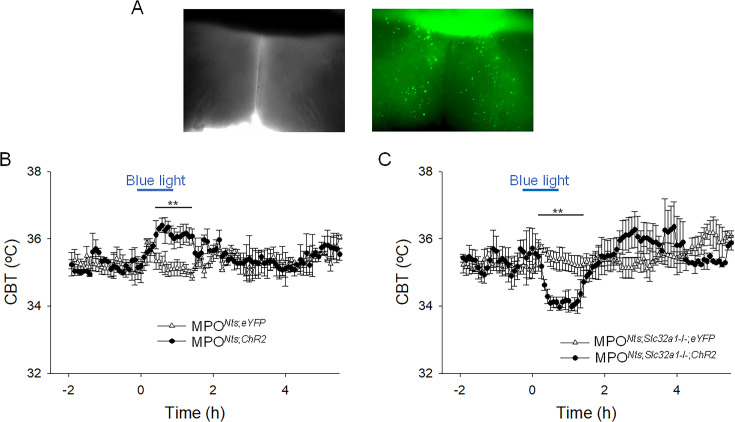
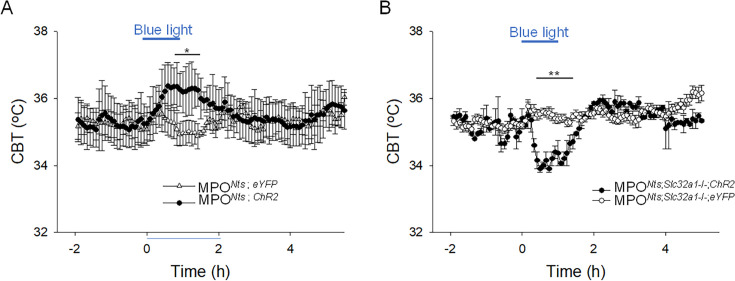
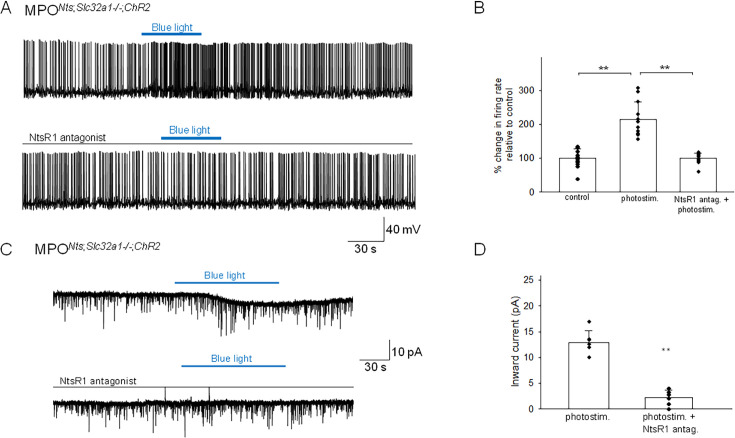
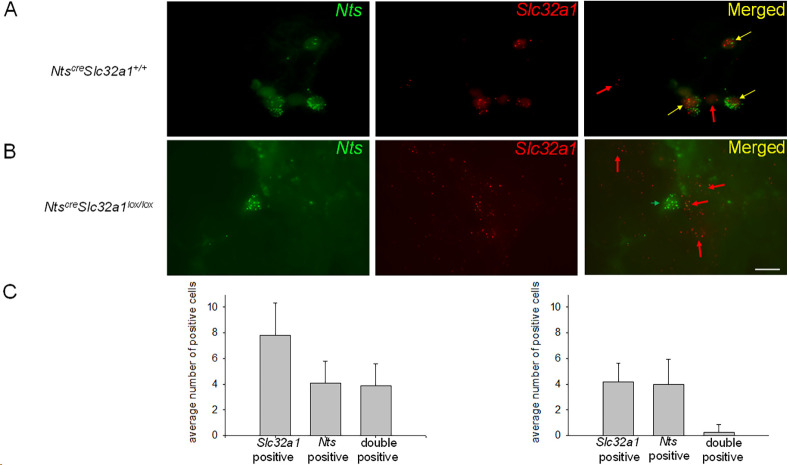
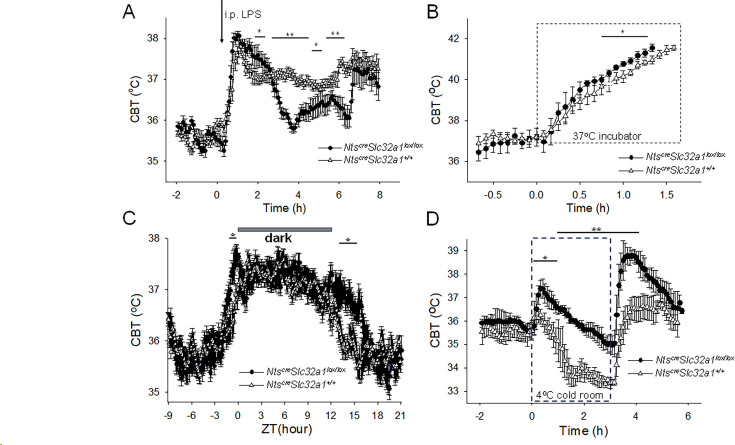
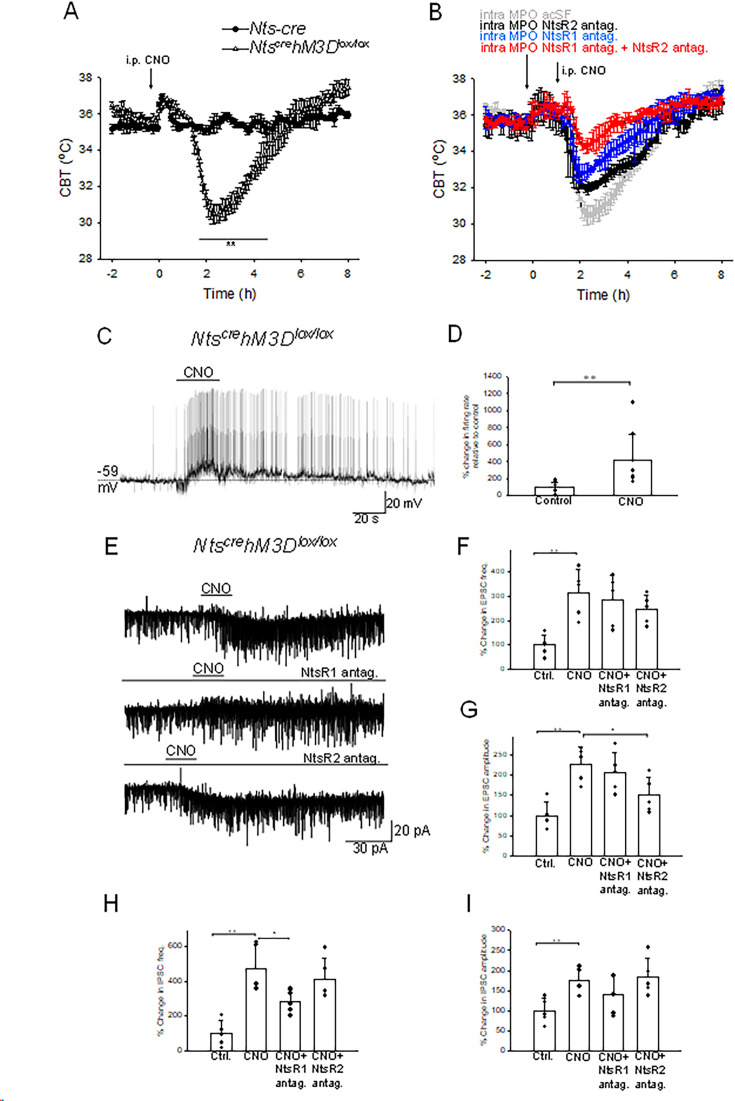
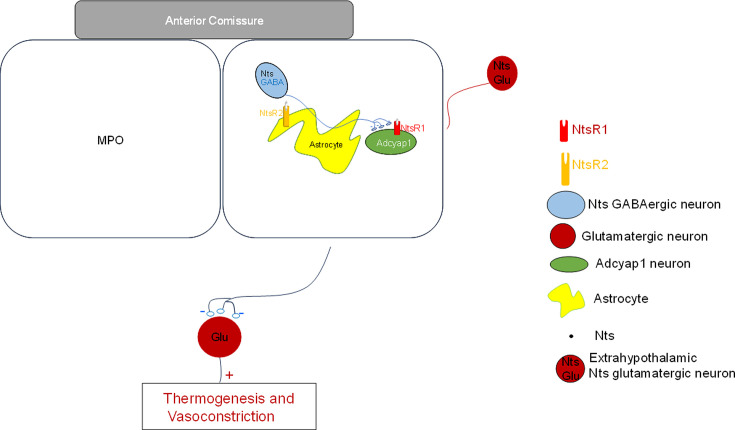
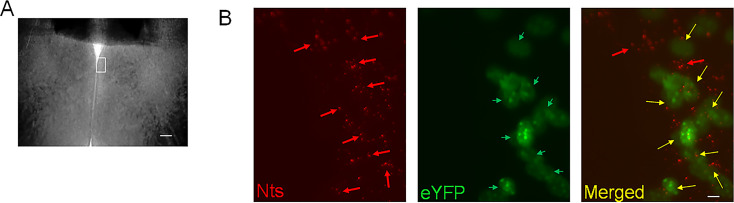
Neurotensin (Nts) is a neuropeptide acting as a neuromodulator in the brain. Pharmacological studies have identified Nts as a potent hypothermic agent. The medial preoptic area, a region that plays an important role in the control of thermoregulation, contains a high density of neurotensinergic neurons and Nts receptors. The conditions in which neurotensinergic neurons play a role in thermoregulation are not known. In this study, optogenetic stimulation of preoptic Nts neurons induced a small hyperthermia. In vitro, optogenetic stimulation of preoptic Nts neurons resulted in synaptic release of GABA and net inhibition of the preoptic pituitary adenylate cyclase-activating polypeptide (Adcyap1) neurons firing activity. GABA-A receptor antagonist or genetic deletion of Slc32a1 (VGAT) in Nts neurons unmasked also an excitatory effect that was blocked by a Nts receptor 1 antagonist. Stimulation of preoptic Nts neurons lacking Slc32a1 resulted in excitation of Adcyap1 neurons and hypothermia. Mice lacking Slc32a1 expression in Nts neurons presented changes in the fever response and in the responses to heat or cold exposure as well as an altered circadian rhythm of body temperature. Chemogenetic activation of all Nts neurons in the brain induced a 4-5°C hypothermia, which could be blocked by Nts receptor antagonists in the preoptic area. Chemogenetic activation of preoptic neurotensinergic projections resulted in robust excitation of preoptic Adcyap1 neurons. Taken together, our data demonstrate that endogenously released Nts can induce potent hypothermia and that excitation of preoptic Adcyap1 neurons is the cellular mechanism that triggers this response.

Keywords: GABA; mouse; neuroscience; neurotensin; preoptic area; thermoregulation.


Conflict of interest statement

IT No competing interests declared

Figures

Figure 1.
Figure 1.. Electrophysiological characteristics of MPONts;ChR2 neurons.
(A) Representative example of spontaneous firing activity of MPONts;ChR2 neurons recorded in whole-cell (up) or cell-attached configuration (down). (B) Membrane potential responses to hyperpolarizing current steps of –40 and –20 pA reveal the presence of a low threshold spike (LTS) upon depolarization to the resting membrane potential. Depolarizing current injections of 20 and 40 pA (right) elicit burst firing activity. The neuron fires 2–3 action potentials during each burst. (C) Nts (up) and Slc32a1(VGAT) (down) transcripts are present in MPONts;ChR2 neurons. Representative results from 10 MPONts;ChR2 neurons. The expected sizes of the PCR product are 149 and 137 base pairs, respectively. Negative (−) control was amplified from a harvested cell without reverse-transcription, and positive control (+) was amplified using 1 ng of hypothalamic mRNA. Nts transcripts were detected in 7 out of 10 neurons while Slc32a1 was detected in 8 neurons. Six neurons expressed both transcripts.
Figure 1—figure supplement 1.
Figure 1—figure supplement 1.. Lack of Slc17a6 (Vglut2) expression in MPONts neurons.
(A) Single cell RT/PCR analysis of Slc17a6 expression. Representative results from 10 MPONts;ChR2 neurons. (B) Slc17a6 expression in single ventromedial hypothalamus (VMH) neurons. Slc17a6 transcripts were detected in 9 out of 10 neurons. (A,B) The expected size of the PCR product is 184 base pairs. Negative (−) control was amplified from a harvested cell without reverse-transcription, and positive control (+) was amplified using 1 ng of hypothalamic mRNA.
Figure 2.
Figure 2.. Effects of optogenetic stimulation of MPONts;ChR2 neurons on the firing activity of nearby MPO neurons.
(A) Optogenetic stimulation of a MPONts;ChR2 neuron decreases the spontaneous firing rate of a nearby MPO neuron (upper trace) from 2.2 Hz to 0.9 Hz and increases the frequency of IPSC from 0.5 Hz to 21.8 Hz (see expanded trace). Gabazine (5 µM) (middle trace) increased the spontaneous firing activity of the neuron and abolished the activation of IPSCs by optogenetic stimulation. In the presence of Gabazine optogenetic stimulation increased the firing activity of the neuron from 4.1 Hz to 9.6 Hz. This increase in firing activity was blocked by pe-incubation with the NtsR1 antagonist SR48692 (100 nM) (lower trace). (B) Bar charts summarizing the effects of optogenetic stimulation of MPONts;ChR2 neurons on the spontaneous firing rates of nearby MPO neurons in control and in the presence of Gabazine (5 µM) and/or the NtsR1 antagonist SR48692 (100 nM). Bars represent means ± S.D. of the normalized firing rate relative to the control. The control value for the firing rate was calculated as the average value during the 5 min period preceding the optogenetic stimulation. Data pooled from n=9 neurons in each condition. There was a statistically significant difference between groups as determined by one-way ANOVA (F(5,40) = 77.71, p=1.08 × 10⁻⁸) followed by Tukey’s test between conditions; ** indicates statistical significance of p<0.01. The p-values of the Tukey’s statistical comparisons among groups are presented in Supplementary file 1-table 2. (C) Adcyap1 transcripts are present in MPO neurons inhibited by optogenetic stimulation of nearby MPONts;ChR2 neurons. Representative results from six recorded MPO neurons. The expected size of the PCR product is 181 base pairs. Negative (−) control was amplified from a harvested cell without reverse-transcription, and positive control (+) was amplified using 1 ng of hypothalamic mRNA. Adcyap1 transcripts were detected in five out of six neurons.
Figure 3.
Figure 3.. Optogenetic stimulation of MPONts;ChR2 neurons increases the frequency of IPSCs and activates an inward current in nearby MPO neurons.
(A) Optogenetic stimulation of a MPONts;ChR2 neuron activates IPSCs in a nearby MPO neuron. Recordings were performed in the presence of CNQX (20 µM), AP-5 (50 µM) and the NtsR1 antagonist SR48692 (100 nM). The sIPSCs were abolished by Gabazine (5 µM) (lower trace). The neuron was held at –50 mV. (B) Optogenetic stimulation of the whole field of view containing several MPONts;ChR2 neurons for 20 s activates IPSCs in a nearby MPO neuron (upper trace). Longer optogenetic stimulation (80 s) of the same neurons activated both IPSCs and an inward current (middle traces). The inward current was abolished by the NtsR1 antagonist SR48692 (100 nM) (lower trace). The neuron was held at –50 mV. (C, D) Bar charts summarizing the increase in the frequency of IPSCs (C) and the amplitude of the inward current (D) recorded in MPO neurons in response to optogenetic stimulation of several MPONts;ChR2 neurons. (C) The IPSCs frequency increased from1.75±0.97 Hz to 17.8±7.47 Hz in response to photostimulation (one-way ANOVA F(1,18)=42.5, p=4 × 10⁻⁴). The control value for the firing rate was calculated as the average value during the 5 min period preceding the optogenetic stimulation. (D) The average inward current activated by optogenetic stimulation decreased from 9.26±2.39 pA to 2.31±0.83 pA in the presence of the NtsR1 antagonist SR48692 (100 nM) (one-way ANOVA F(1,18)=75.35, p=7.5 × 10⁻⁸). Bars represent means ± S.D. Data pooled from n=10 neurons in each condition.
Figure 3—figure supplement 1.
Figure 3—figure supplement 1.. Optogenetic stimulation of MPONts;ChR2 neurons from females increases the frequency of IPSCs and activates an inward current in nearby MPO neurons.
(A) Optogenetic stimulation of a MPONts;ChR2 neuron activates IPSCs and an inward current in a nearby MPO neuron (upper trace). In the presence of CNQX (20 µM), AP-5 (50 µM), Gabazine (5 µM) and the NtsR1 antagonist SR48692 (100 nM) light stimulation was without effect (lower trace). The neuron was held at –50 mV. (B,C) Bar charts summarizing the increase in the frequency of IPSCs (B) and the amplitude of the inward current (C) recorded in MPO neurons in response to optogenetic stimulation of several MPONts;ChR2 neurons. (B) The IPSCs frequency increased from1.5±1.4 Hz to 14.1±5.8 Hz in response to photostimulation (one-way ANOVA F(1,9)=22.4, p=1.4 × 10⁻³). (C) The average inward current activated by optogenetic stimulation decreased from 11.3±3.4 pA to 2.6±1.2 pA in the presence of the NtsR1 antagonist SR48692 (100 nM) (one-way ANOVA F(1,9)=28.9, p=6.6 × 10⁻⁴). Bars represent means ± S.D. Data pooled from n=5 neurons.
Figure 4.
Figure 4.. Optogenetic activation of MPONts;ChR2 neurons induces hyperthermia while optogenetic activation of MPONts;Slc32a1-/-;ChR2 neurons induces hypothermia.
(A) DIC (left) and fluorescence (right) images of an acute slice from MPONts;ChR2 mouse indicating hChR2-eYFP expression in the MPO. (B) Optogenetic stimulation of MPONts;ChR2 neurons (●) in vivo for 1 hr (blue light) induced a hyperthermia of 1.22 ± 0.35 °C relative to control (∆). The response was statistically different to the response to photostimulation of control MPONts;eYFP mice (∆) (one-way repeated measures ANOVA, F(1,111)=20.9, p=1.2 × 10⁻⁵, followed by Mann-Whitney U tests for each time point, ** p<0.01). (C) Optogenetic stimulation of MPONts;Slc32a1-/-;ChR2 neurons (●) in vivo for 1 hour (blue light) induced a hypothermia of 1.44 ± 0.29 °C relative to control (∆). The response was statistically different to the response to photostimulation of control MPONts;Slc32a1-/-;eYFP mice (∆) (one-way repeated measures ANOVA, F(1,112)=8.27, p=4.8 × 10⁻³, followed by Mann-Whitney U tests for each time point, ** p<0.01). (B,C) The points represent averages ± S.D. through the 7 hr recording period. Experiments were carried out in parallel in groups of six mice.
Figure 4—figure supplement 1.
Figure 4—figure supplement 1.. In female mice optogenetic activation of MPONts;ChR2 neurons induces hyperthermia while optogenetic activation of MPONts;Slc32a1-/-;ChR2 neurons induces hypothermia.
(A) Optogenetic stimulation of MPONts;ChR2 neurons (●) in vivo for 1 hr (blue light) induced a hyperthermia of 1.31 ± 0.65 °C relative to control (∆). The response was statistically different to the response to photostimulation of control MPONts;eYFP mice (∆) (one-way repeated measures ANOVA, F(1,110)=5.7, p=1.9 × 10⁻², followed by Mann-Whitney U tests for each time point, * p<0.05). (B) Optogenetic stimulation of MPONts;Slc32a1-/-;ChR2 neurons (●) in vivo for 1 hr (blue light) induced a hypothermia of 1.69 ± 0.22 °C relative to control (∆). The response was statistically different to the response to photostimulation of control MPONts;Slc32a1-/-;eYFP mice (∆) (one-way repeated measures ANOVA, F(1,83)=9.9, p=2.2 × 10⁻³, followed by Mann-Whitney U tests for each time point, ** p<0.01). (A,B) The points represent averages ± S.D. through the 7 hr recording period. Experiments were carried out in parallel in groups of six female mice.
Figure 5.
Figure 5.. Optogenetic stimulation of MPONts;Slc32a1-/-;ChR2 neurons increases the firing activity of nearby MPO neurons.
(A) Optogenetic stimulation of MPONts;Slc32a1-/-;ChR2 neurons increases the spontaneous firing rate of a nearby MPO neuron (upper trace) from 1.6 Hz to 3.9 Hz. The photostimulation-induced increase in firing activity was blocked by pe-incubation with the NtsR1 antagonist SR48692 (100 nM) (lower trace). (B) Bar charts summarizing the effects of optogenetic stimulation of MPONts;Slc32a1-/-;ChR2 neurons on the spontaneous firing rates of nearby MPO neurons in control and in the presence of the NtsR1 antagonist SR48692 (100 nM). Bars represent means ± S.D. of the normalized firing rate relative to the control. Data pooled from n=12 neurons in each condition. There was a statistically significant difference between groups as determined by one-way (ANOVA F(2,22) = 42.45, p=2.80 × 10⁻⁸) followed by Tukey’s test between conditions; ** indicates statistical significance of p<0.01, * indicates p<0.05. The p-values of the Tukey’s statistical comparisons among groups are presented in Supplementary file 1-table 3. (C) Optogenetic stimulation of the whole field of view containing several MPONts;ChR2 neurons for 20 s activates IPSCs in a nearby MPO neuron (upper trace). Longer optogenetic stimulation (80 s) of the same neurons activated both IPSCs and an inward current (middle traces). The inward current was abolished by the NtsR1 antagonist SR48692 (100 nM) (lower trace). The neuron was held at –50 mV. (D) Bar chart summarizing the amplitude of the inward current recorded in MPO neurons in response to optogenetic stimulation in control and during incubation with the NtsR1 antagonist SR48692 (100 nM). The average inward current activated by optogenetic stimulation decreased from 12.86±2.33 pA to 2.18±1.49 pA in the presence of MPONts;Slc32a1-/-;ChR2 neurons the NtsR1 antagonist SR48692 (100 nM) (one-way ANOVA F(1,22)=193.73, p=2.49 × 10⁻⁸). Bars represent means ± S.D. Data pooled from n=12 neurons.
Figure 5—figure supplement 1.
Figure 5—figure supplement 1.. Expression of Slc32a1 transcripts in preoptic slices from Ntscre Slc32a1lox/lox and Ntscre Slc32a1+/+ male mice.
(A,B) Representative images of Slc32a1 (red) and Nts (green) transcripts visualized using RNAscope technology in preoptic slices from NtsSlc32a1+/+(A) and Ntscre Slc32a1lox/lox mice (B). (A) Nts transcripts (green, left) are present in 3 out of 5 Slc32a1-positive cells (red, middle) as indicated by their superimposed images (right, yellow arrows). Two other Slc32a1 expressing cells do not express Nts transcripts (right, red arrows). (B) Nts transcripts (green, left) are present in two cells while Slc32a1 transcripts (red, middle) are present in six cells (middle). In Ntscre Slc32a1lox/lox tissue the Slc32a1 positive cells (right, red arrows) do not co-express Nts transcripts. (A,B) The scale bar represents 10 µm. (C) Bar charts summarizing the average number positive cells for the respective transcripts in a randomly selected field of view in Ntscre Slc32a1+/+ (left) and Ntsccre Slc32a1lox/lox (right) preoptic slices. Data were averaged from 15 randomly selected fields of view and 3 different mice for each genotype. Overall, 139 cells expressed Slc32a1, 72 cells expressed Nts transcripts and 68 cells expressed both in Ntscre Slc32a1+/+ tissue. In the Ntsccre Slc32a1lox/lox tissue 75 cells expressed Slc32a1, 72 cells expressed Nts transcripts and 3 cells expressed both transcripts. The percentage of Nts expressing cells that co-expressed Slc32a1 was 94.4% and 4.2% in Ntscre Slc32a1+/+ and Ntscre Slc32a1lox/lox tissue, respectively.
Figure 6.
Figure 6.. Altered thermoregulatory profile of Ntscre Slc32a1lox/lox mice.
(A) CBT responses to i.p. injection (arrow) of LPS (0.03 mg/kg) in Ntscre Slc32a1+/+ mice (∆, control) and Ntscre Slc32a1lox/lox mice (●). LPS induced fever responses with differential profiles (one-way repeated measures ANOVA, F(1,94)=9.31, p=2.948 × 10⁻³, followed by Mann-Whitney U tests for each time point, ** p<0.01, * p<0.05). (B) CBT responses during a heat test in an incubator at 37°C. The CBT increased faster in Ntscre Slc32a1lox/lox mice (●) than in Ntscre Slc32a1+/+ mice (∆, control) (repeated measures ANOVA, F(1,16) = 33.49, p=2.78 × 10⁻⁵, followed by Mann-Whitney U tests for each time point, * p<0.05). (C). Circadian CBT profiles in NtsSlc32a1-/- mice (●) than in Ntscre Slc32a1+/+ mice (∆, control). Ntscre Slc32a1lox/lox mice display a longer active phase relative to controls (repeated measures ANOVA, F(1,359) = 173.35, p=1.10 × 10⁻⁹, followed by Mann-Whitney U tests for each time point, * p<0.05). Data for each mouse represents the average of 10 different 24 hr periods. (D) CBT responses during a cold test in an incubator at 4 °C. Ntscre Slc32a1lox/lox mice (●), in contrast with Ntscre Slc32a1+/+ mice (∆, control), displayed a significant hyperthermia at the beginning as well as following the end of the cold exposure (repeated measures ANOVA, F(1,92)=220.89, p=4.3 × 10⁻¹⁴, followed by Mann-Whitney U tests for each time point, * p<0.05, ** p<0.01). (A–D) The points represent averages ± S.D. (n = 6 male mice).
Figure 7.
Figure 7.. Chemogenetic activation of neurotensinergic neurons and projections induces hypothermia and potently excites MPO neurons.
(A) I.p. injection (arrow) of CNO (20 mM, 3 µl) in Ntscre hM3Dlox/lox mice (∆) and in Nts-cre mice (control, ●). CNO induced a hypothermia of 4.8 ± 0.6 °C (repeated measures ANOVA, F(1,242)=21.72, p=2.8 × 10⁻⁶, followed by followed by Mann-Whitney U tests for each time point, ** p<0.01). (B) Role of NtsR1 and NtsR2 expressed in the MPO in the CNO-induced activation of NtscrehM3Dlox/lox neurons. NtscrehM3Dlox/lox mice received a bilateral infusion of aCSF (gray), NtsR1 antagonist SR48692 (300 nM, 100 nl, blue), NtsR2 antagonist NTRC 824 (200 nM, 100 nl, black) and NtsR1 antagonist (300 nM, 100 nl)+NtsR2 antagonist (200 nM, 100 nl) (red) 1.5 hr prior to an i.p. injection of CNO (20 mM, 3 µl). The antagonists significantly reduced the hypothermia (repeated measures ANOVA, F(3,360)=71.33, p=8.82 × 10⁻¹⁶). (A,B) The points represent averages ± S.D. Experiments were carried out in parallel in groups of 6. (C) Chemogenetic activation of neurotensinergic neurons and neurotensinergic projections in the MPO by bath application of CNO (3 µM) in slices from NtscrehM3Dlox/lox mice depolarizes and increases the firing rate of a MPO neuron. The firing rate increased from 0.15 Hz to 1.65 Hz. (D) Bar chart summarizing the effect of chemogenetic activation of neurotensinergic neurons and projections in the MPO on the firing rates of MPO neurons. There was a statistically significant difference between groups as determined by one-way ANOVA (F(1,16)=8.99, p=8.52 × 10⁻³; ** indicates statistical significance of p<0.01). Bars represent means ± S.D. of the normalized firing rate relative to the control. Data pooled from n=10 neurons. (E) Chemogenetic activation of neurotensinergic neurons and neurotensinergic projections in the MPO by bath application of CNO (3 µM) in slices from NtscrehM3Dlox/lox mice increases the amplitudes and frequencies of both IPSCs and EPSCs and activates an inward current (upper trace). The NtsR1 antagonist SR48692 (100 nM) abolished the inward current activated by CNO (middle trace). The NtsR2 antagonist NTRC 824 (100 nM) did not change the inward current activated by CNO but significantly decreased the amplitude of sEPSCs (lower trace). The neuron was held at –50 mV. (F, G, H, I) Bar charts summarizing the increase in sEPSCs frequency (F) and amplitude (G) and IPSCs frequency (H) and amplitude (I) Bars represent means ± S.D. of the normalized frequency relative to the control. Data pooled from n=6 neurons. The changes were statistically significant for sEPSCs frequency (one-way ANOVA F(3,19)=6.94, p=3.33 × 10⁻³) and amplitude (one-way ANOVA F(3,19)=9.20, p=9.03 × 10⁻⁴) as well as for sIPSCs frequency (one-way ANOVA F(3,19)=12.61, p=1.71 × 10⁻⁴) and amplitude (one-way ANOVA F(3,19)=4.53, p=1.76 × 10⁻³). The P values for the inter-group comparisons are listed in Supplementary file 1-tables 4-7.
Figure 8.
Figure 8.. Schematic representation of neurotensinergic neurons in a thermoregulatory preoptic pathway.
Preoptic thermoregulatory Adcyap1 neurons, assumed to be glutamatergic, project to inhibitory interneurons in other brain regions that project to neurons controlling thermogenesis and vasoconstriction. Adcyap1 neurons’ inhibition results in increased thermogenesis and decreased vasoconstriction resulting in increased CBT. Conversely, excitation of the Adcyap1 thermoregulatory neurons results in hypothermia. Preoptic Nts neurons are GABAergic and project to preoptic thermoregulatory Adcyap1 neurons and modulate their activity. Preoptic astrocytes express NtsR2 receptors and their activation modulates the release of glutamate from nearby synaptic terminals.
Figure 9.
Figure 9.. Transduction of MPONts neurons with ChR2-eYFP by injecting AAV-EF1a-double floxed-hChR2(H134R)-eYFP in Nts-cre mice.
(A) Brightfield image of a MPO slice. The white rectangle represents the region imaged in (B). The scale bar represents 100 µm. (B) Representative images of Nts transcripts visualized using RNAscope (red, left panel), eYFP (green, middle) and their superimposed images (right) in a coronal slice from a MPONts;ChR2 mouse. eYFP was visible in 8 out of 10 Nts positive cells. The scale bar represents 10 µm.

Update of

Similar articles

Cited by

References

    1. Alexander MJ, Leeman SE. Widespread expression in adult rat forebrain of mRNA encoding high-affinity neurotensin receptor. The Journal of Comparative Neurology. 1998;402:475–500. - PubMed
    1. Armstrong WE, Wang L, Li C, Teruyama R. Performance, properties and plasticity of identified oxytocin and vasopressin neurones in vitro. Journal of Neuroendocrinology. 2010;22:330–342. doi: 10.1111/j.1365-2826.2010.01989.x. - DOI - PMC - PubMed
    1. Black JA, Vasylyev D, Dib-Hajj SD, Waxman SG. Nav1.9 expression in magnocellular neurosecretory cells of supraoptic nucleus. Experimental Neurology. 2014;253:174–179. doi: 10.1016/j.expneurol.2014.01.004. - DOI - PubMed
    1. Chen Z, Chen G, Zhong J, Jiang S, Lai S, Xu H, Deng X, Li F, Lu S, Zhou K, Li C, Liu Z, Zhang X, Zhu Y. A circuit from lateral septum neurotensin neurons to tuberal nucleus controls hedonic feeding. Molecular Psychiatry. 2022;27:4843–4860. doi: 10.1038/s41380-022-01742-0. - DOI - PMC - PubMed
    1. Frosini M, Valoti M, Sgaragli G. Changes in rectal temperature and ECoG spectral power of sensorimotor cortex elicited in conscious rabbits by i.c.v. injection of GABA, GABA(A) and GABA(B) agonists and antagonists. British Journal of Pharmacology. 2004;141:152–162. doi: 10.1038/sj.bjp.0705593. - DOI - PMC - PubMed

MeSH terms

Substances

LinkOut - more resources