. 2024 Aug 30;385(6712):eadj7446.
doi: 10.1126/science.adj7446. Epub 2024 Aug 30.

A p62-dependent rheostat dictates micronuclei catastrophe and chromosome rearrangements

Affiliations

A p62-dependent rheostat dictates micronuclei catastrophe and chromosome rearrangements

Sara Martin et al. Science. .

Abstract

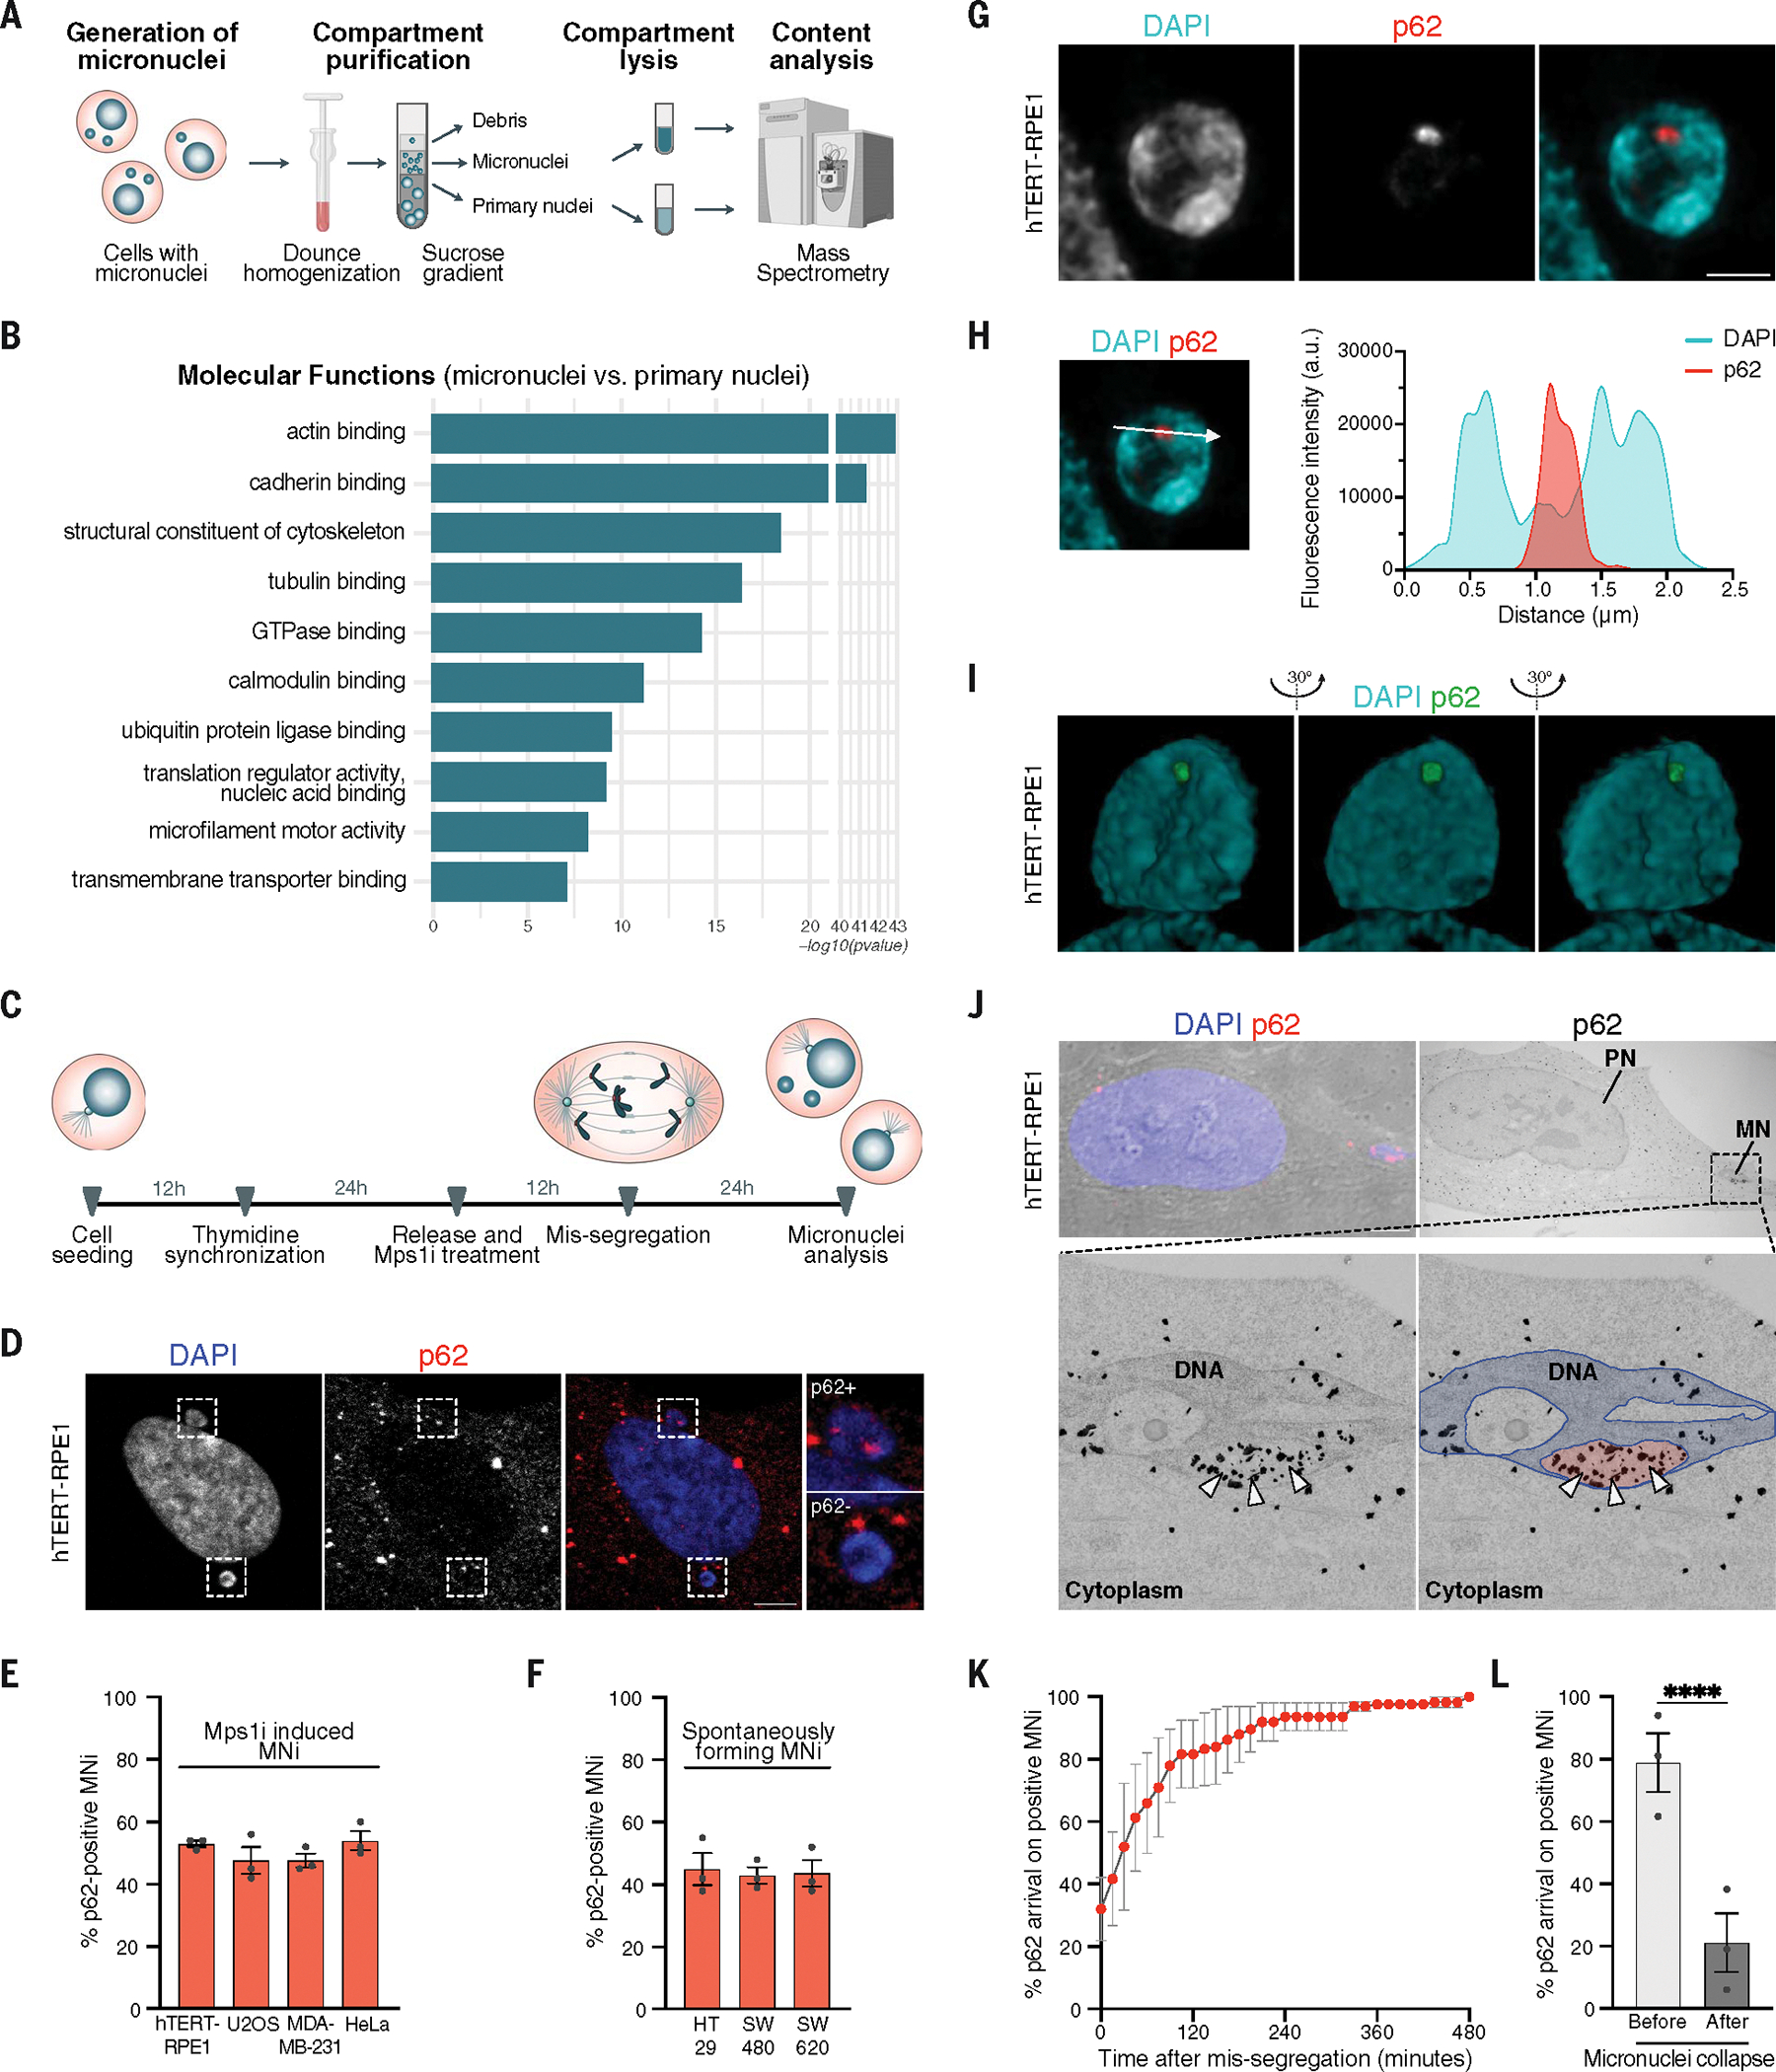
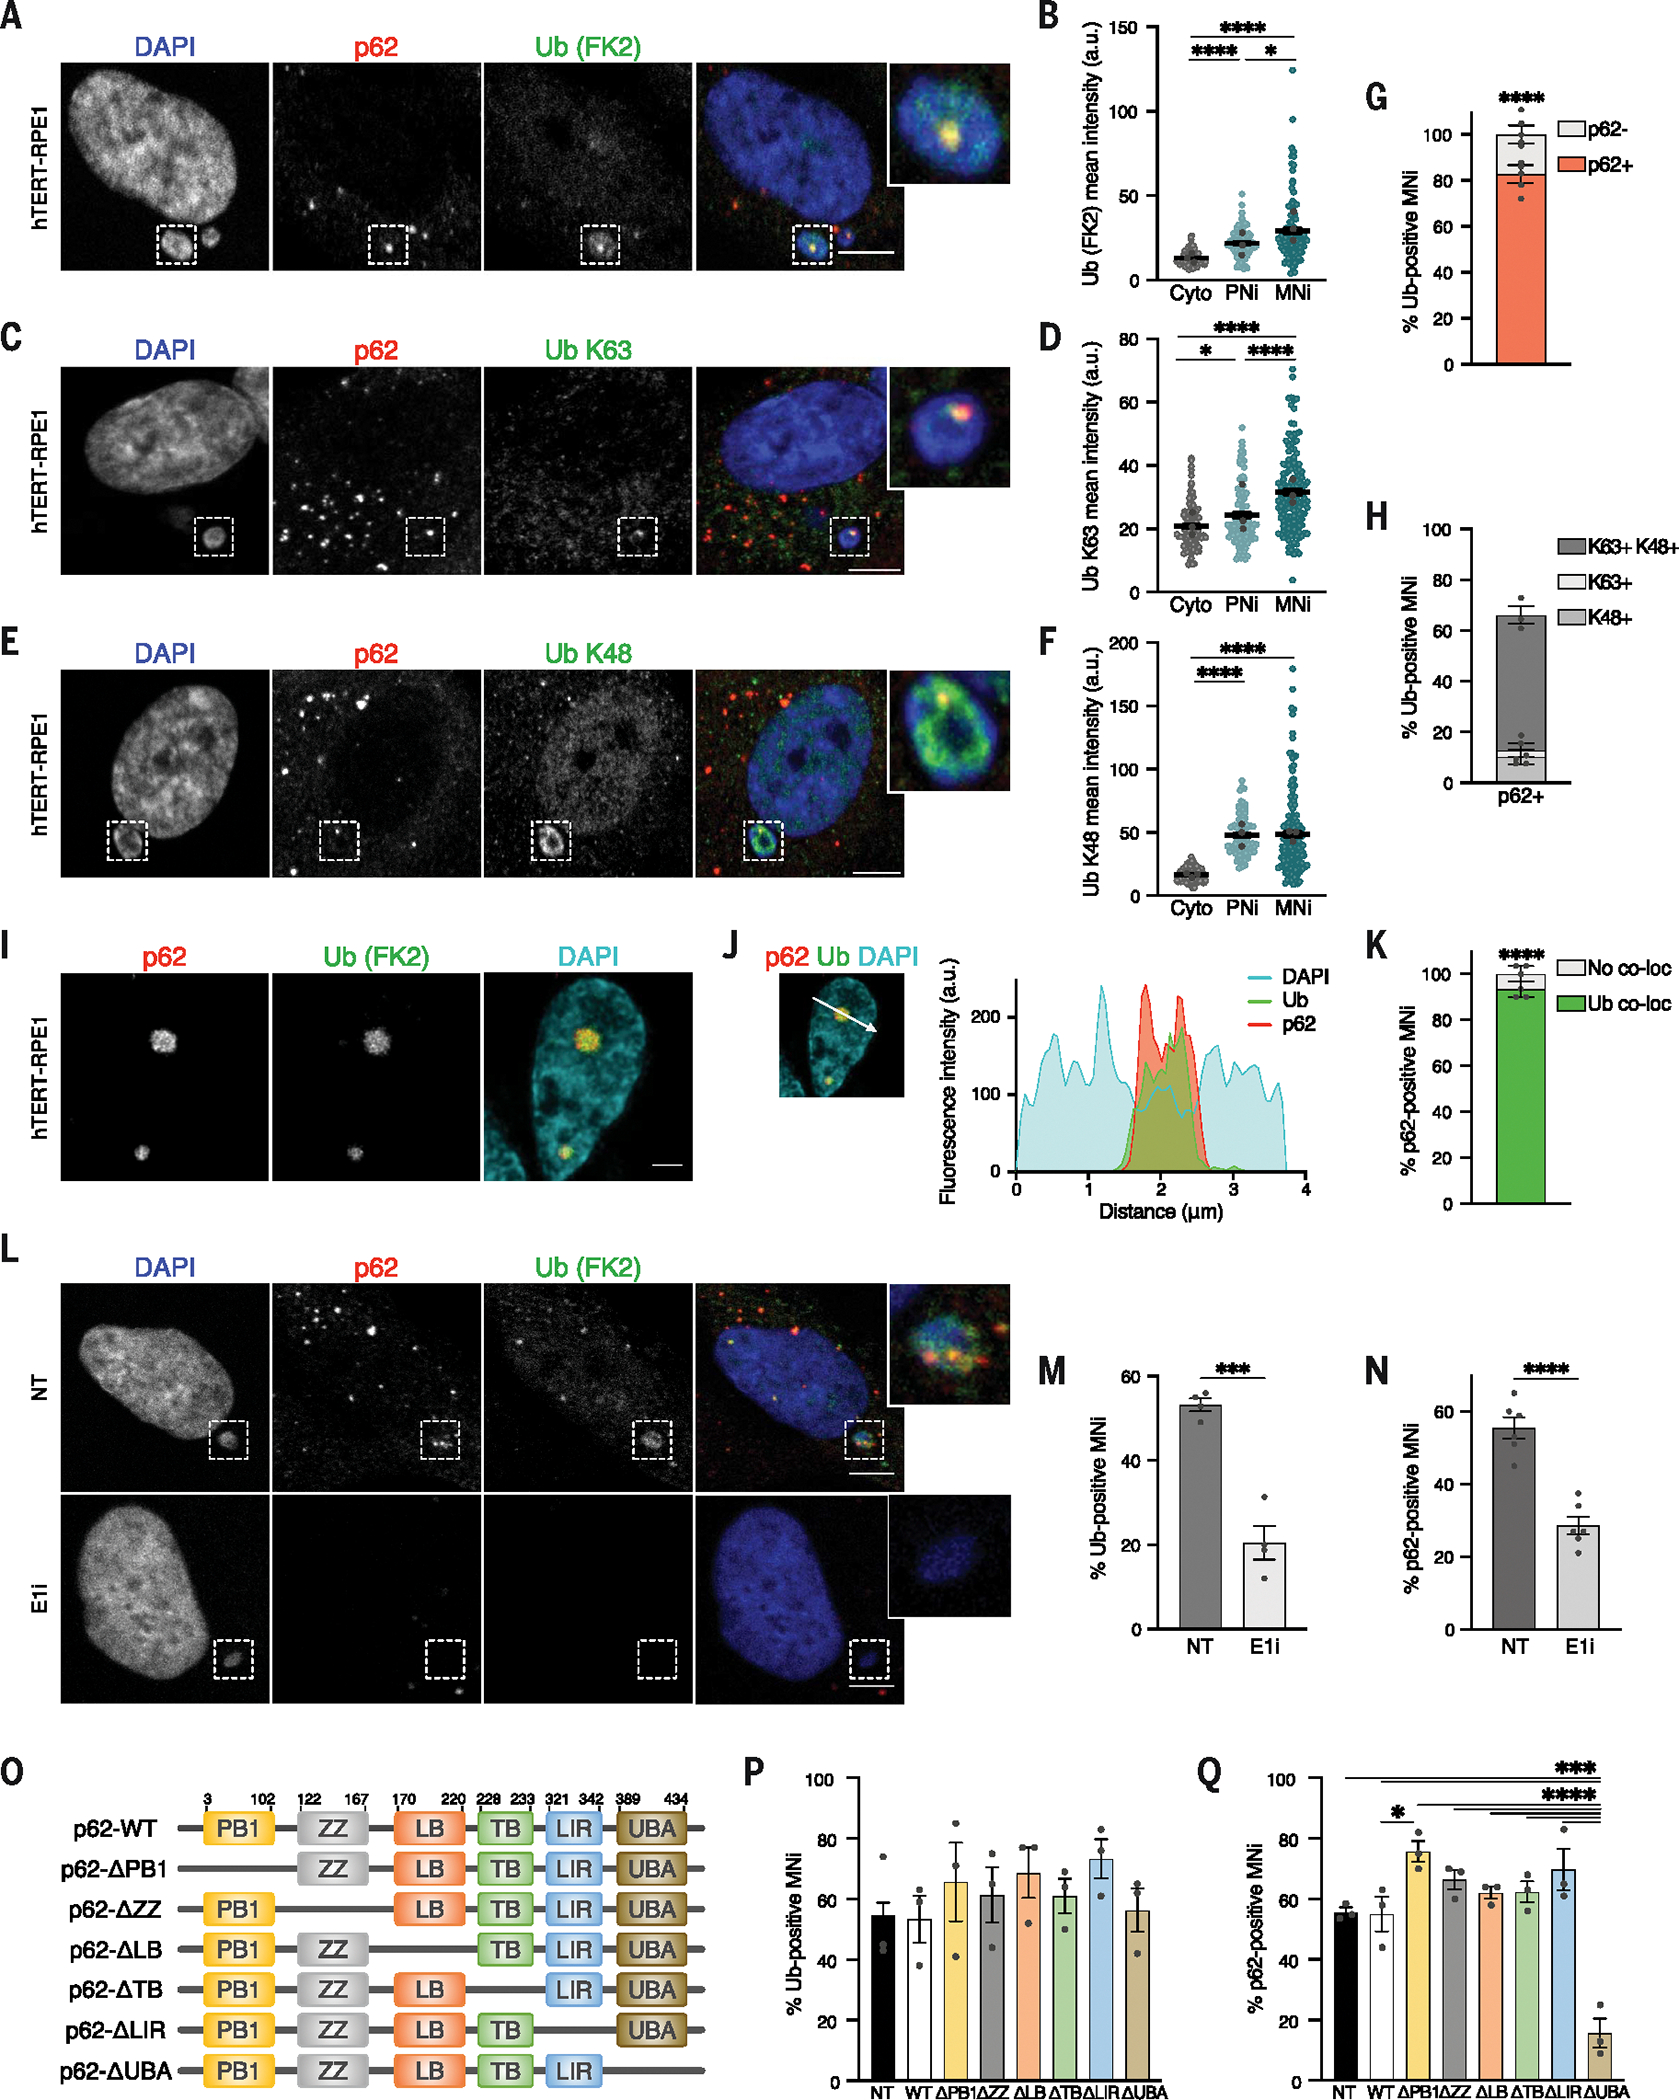
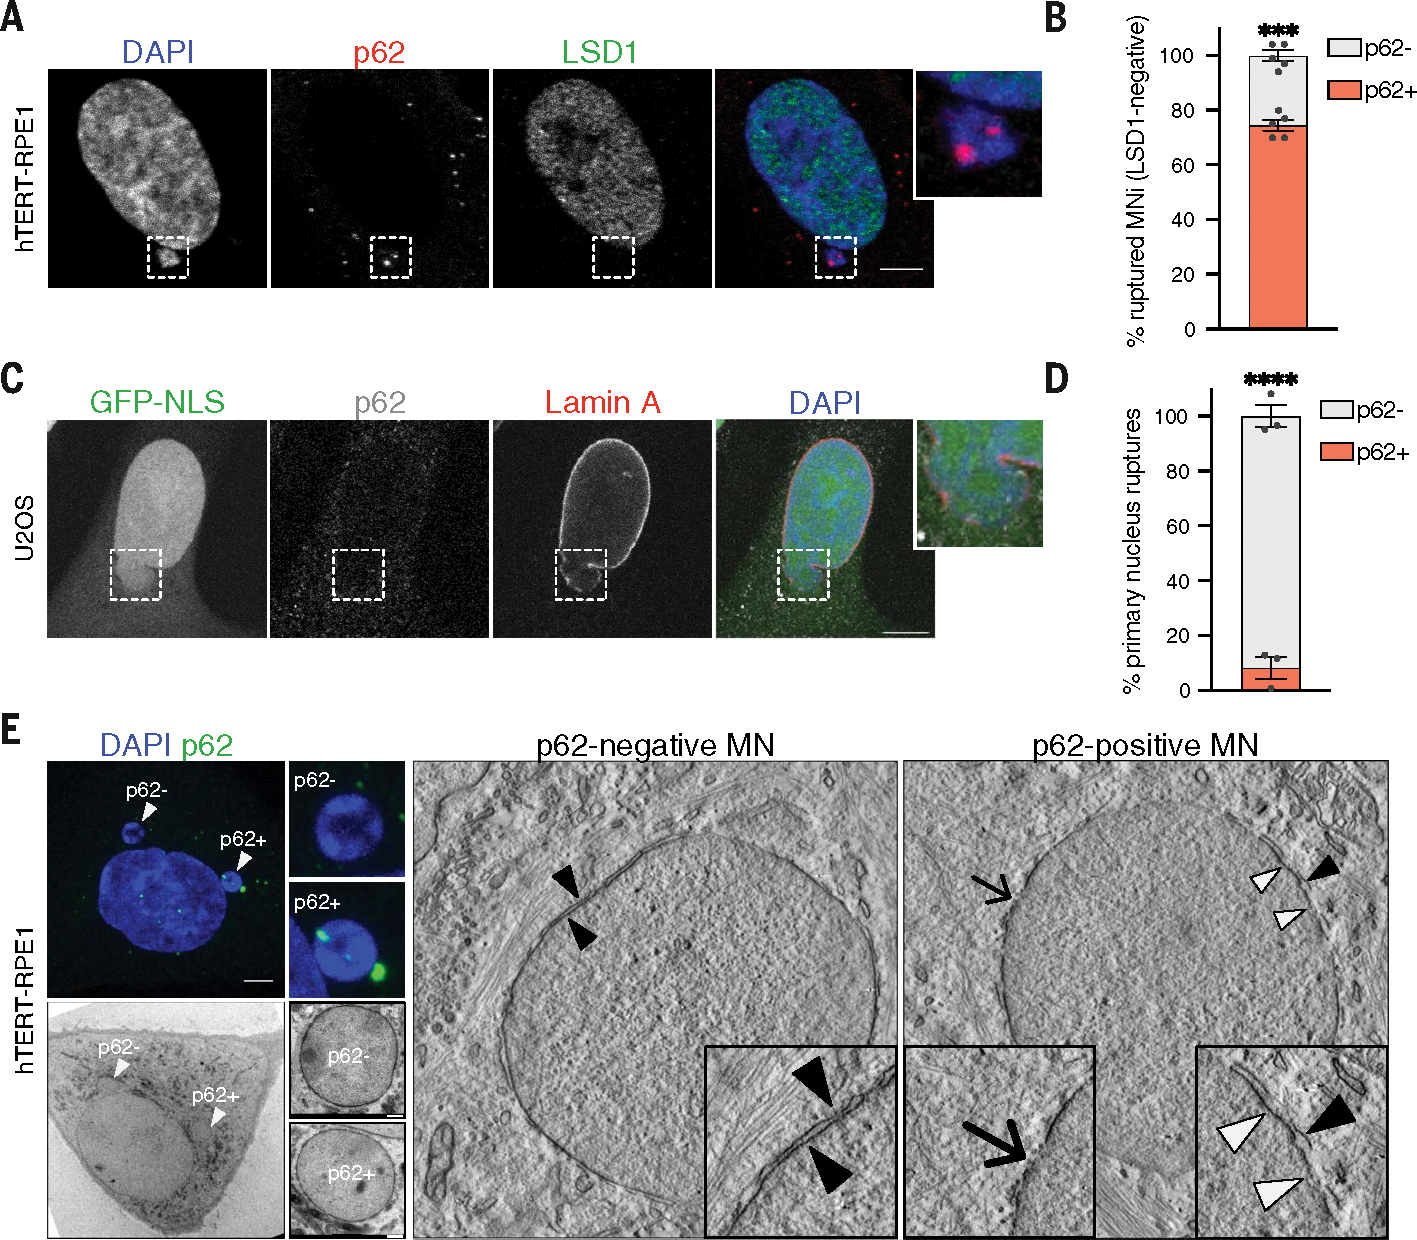
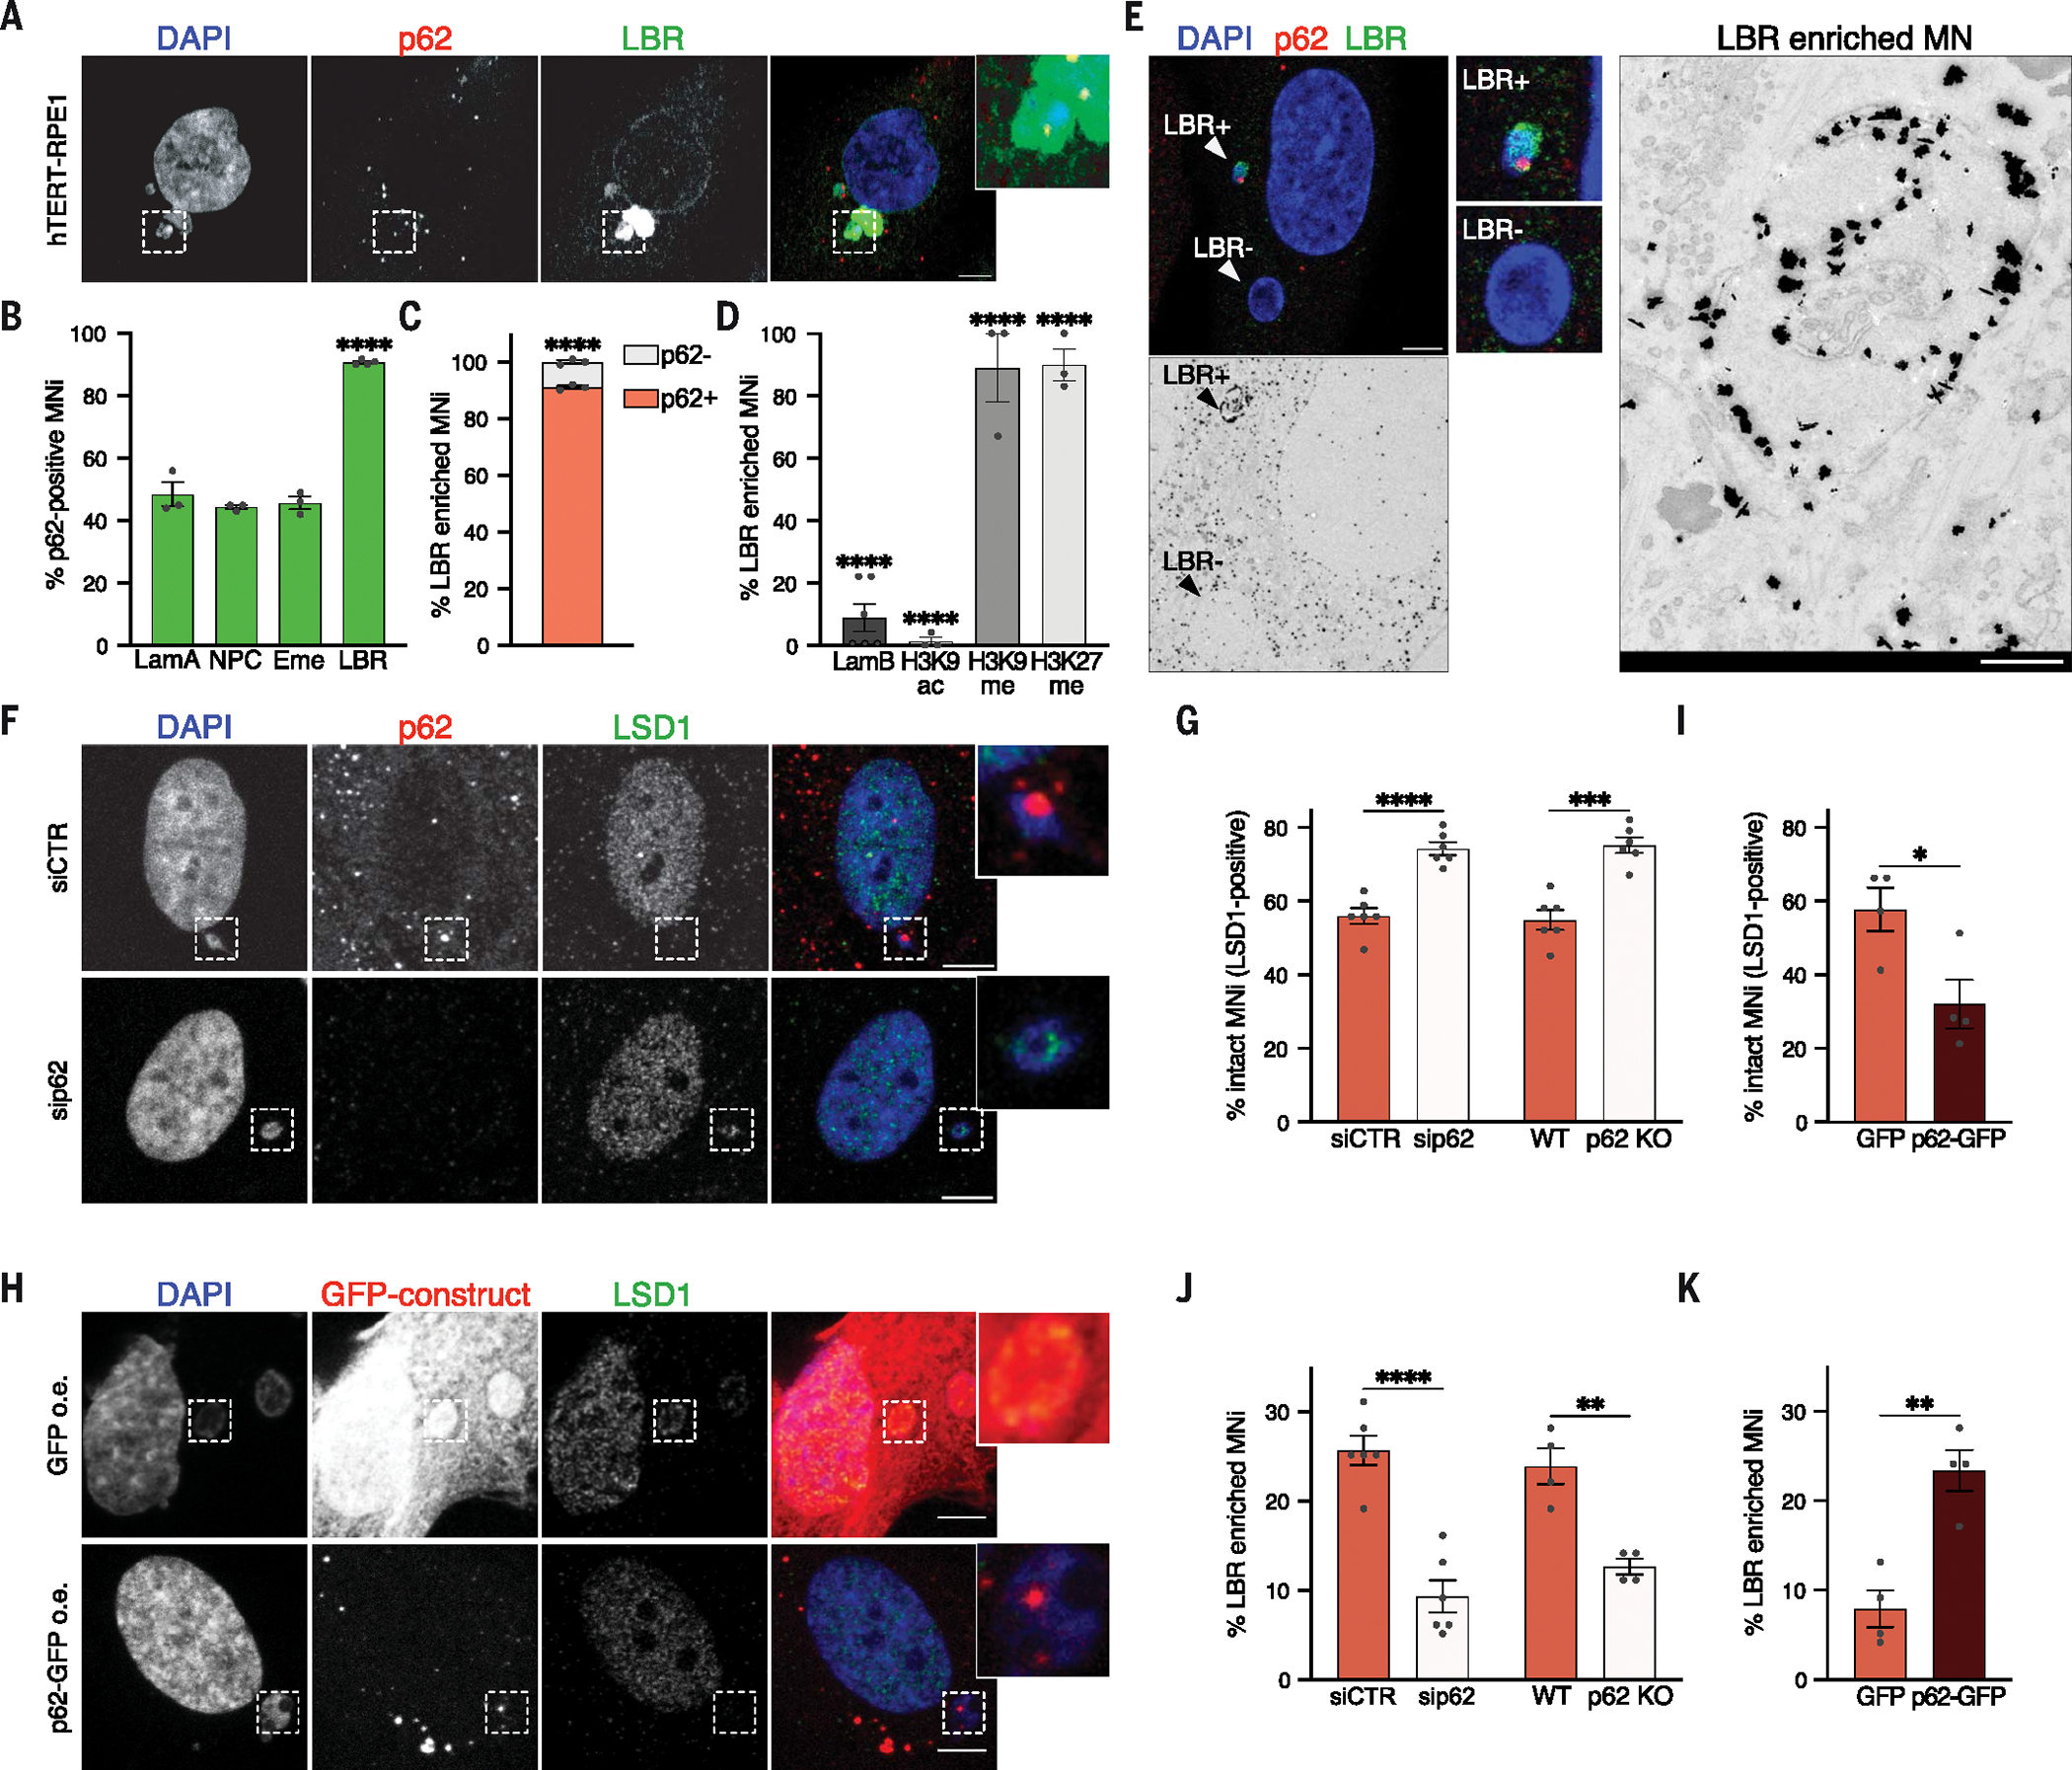
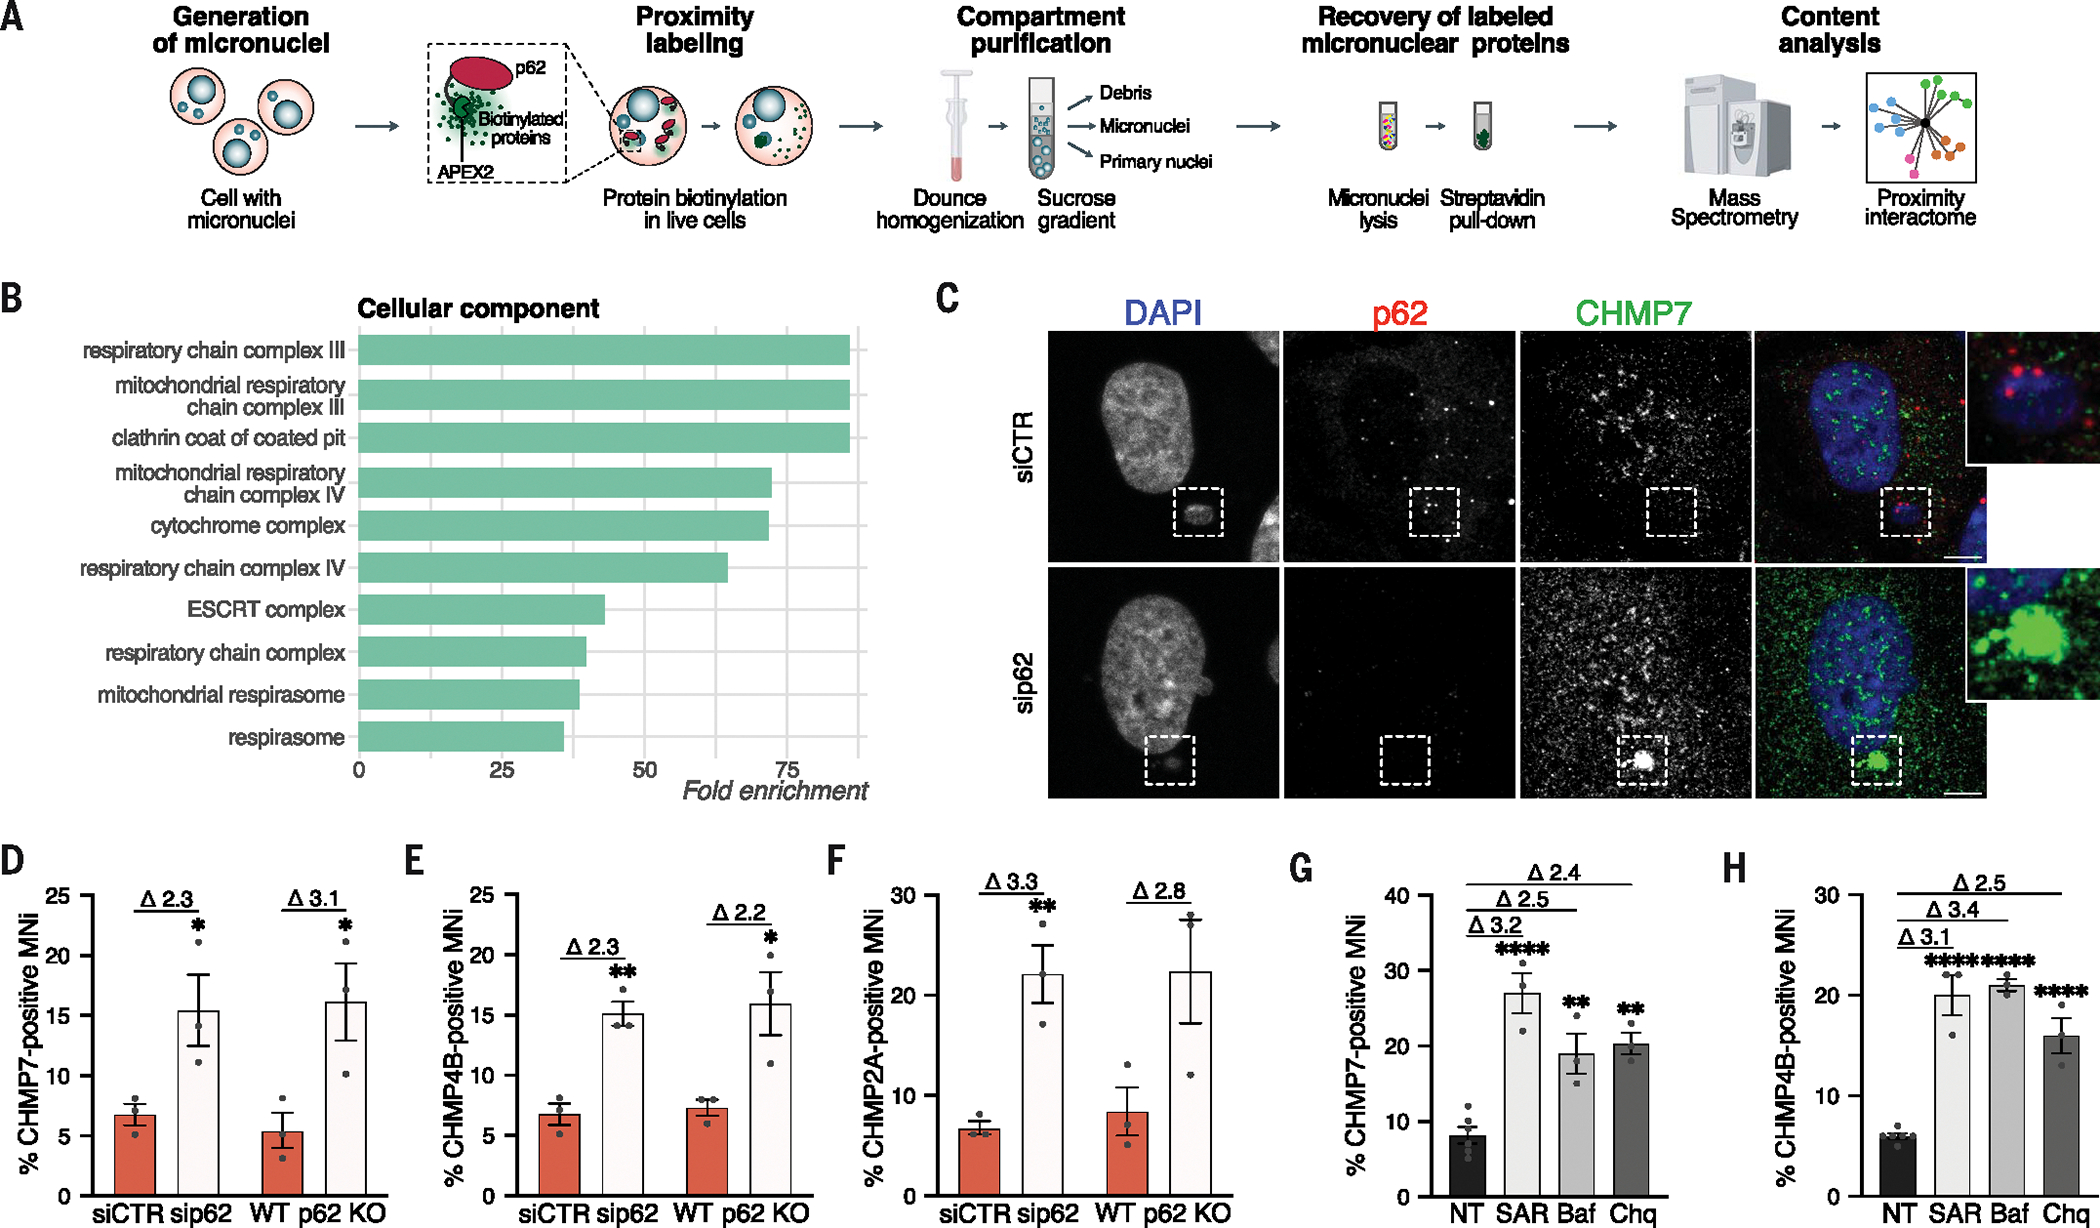
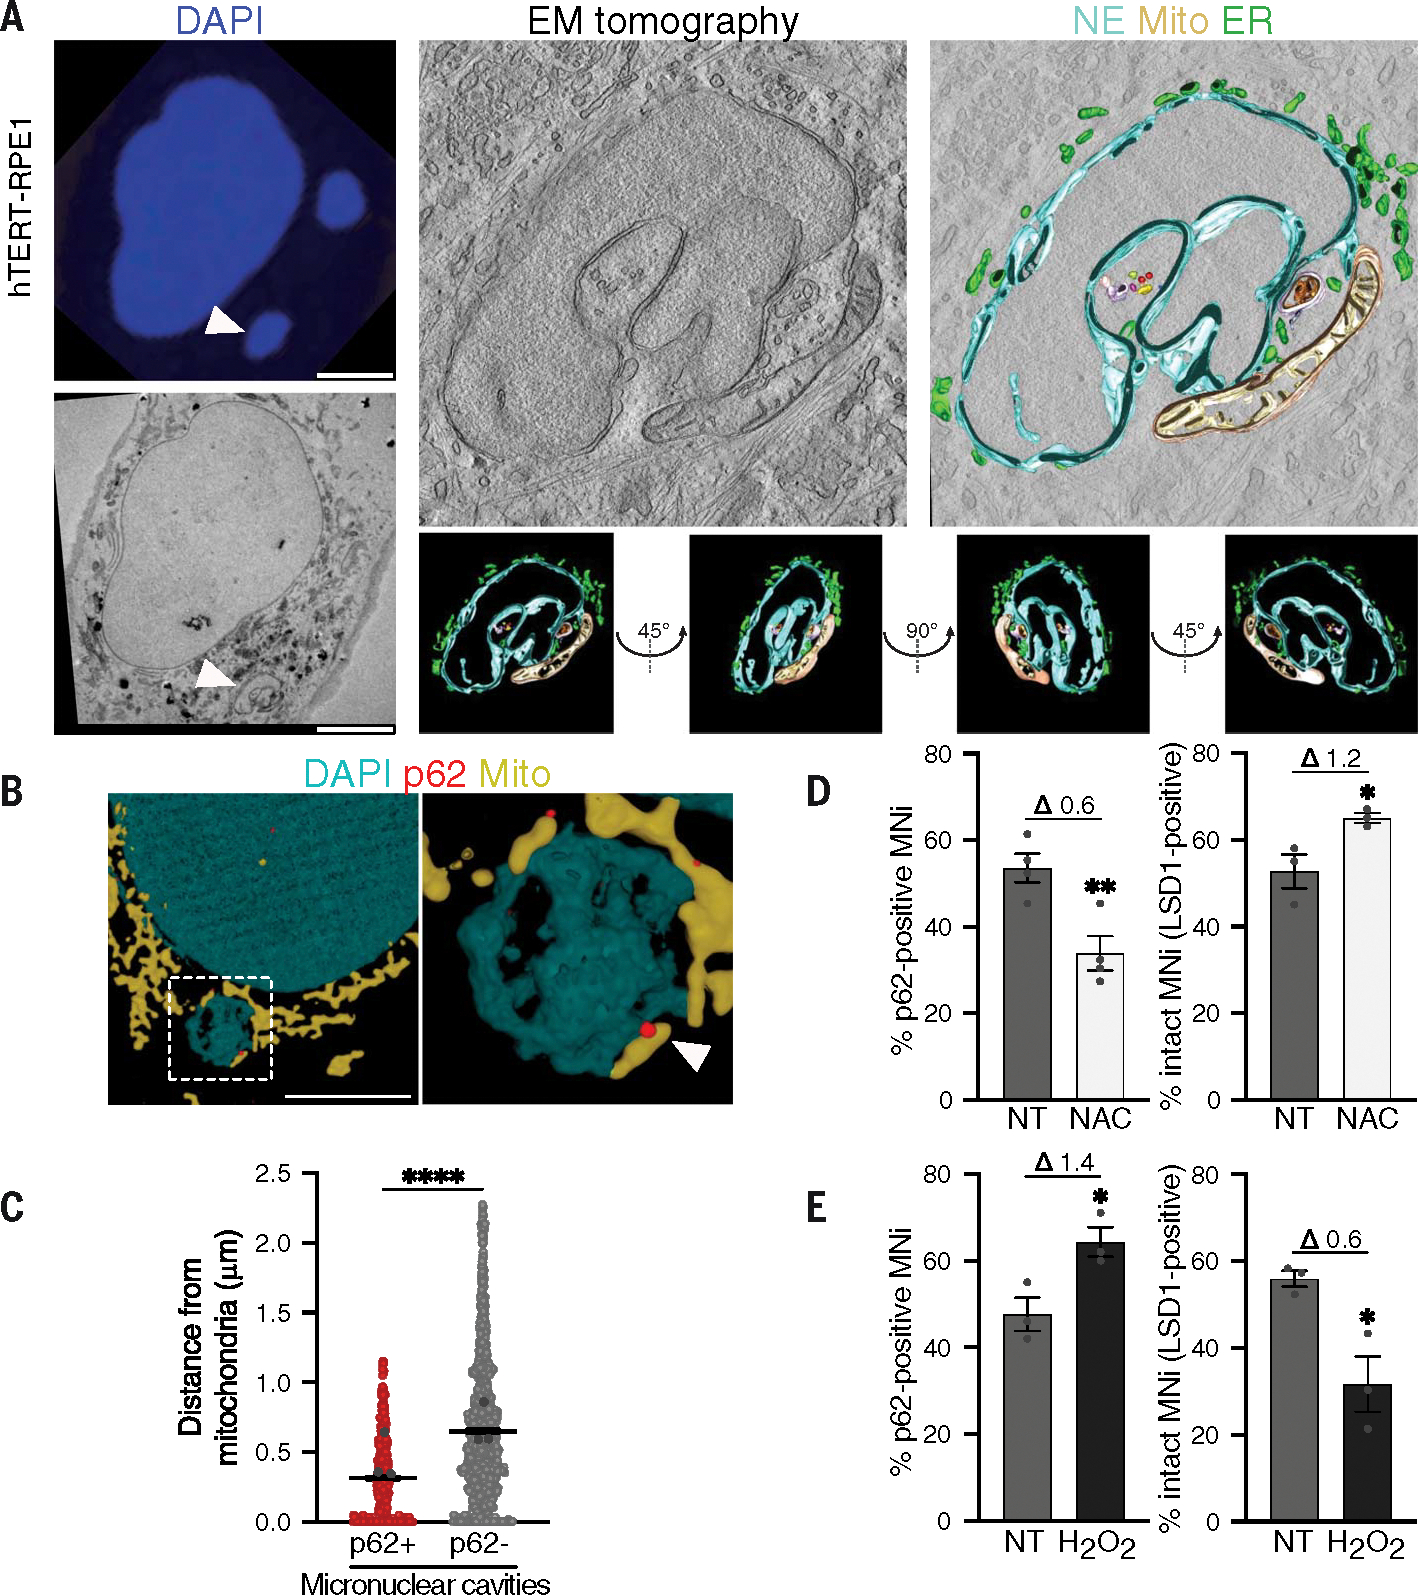
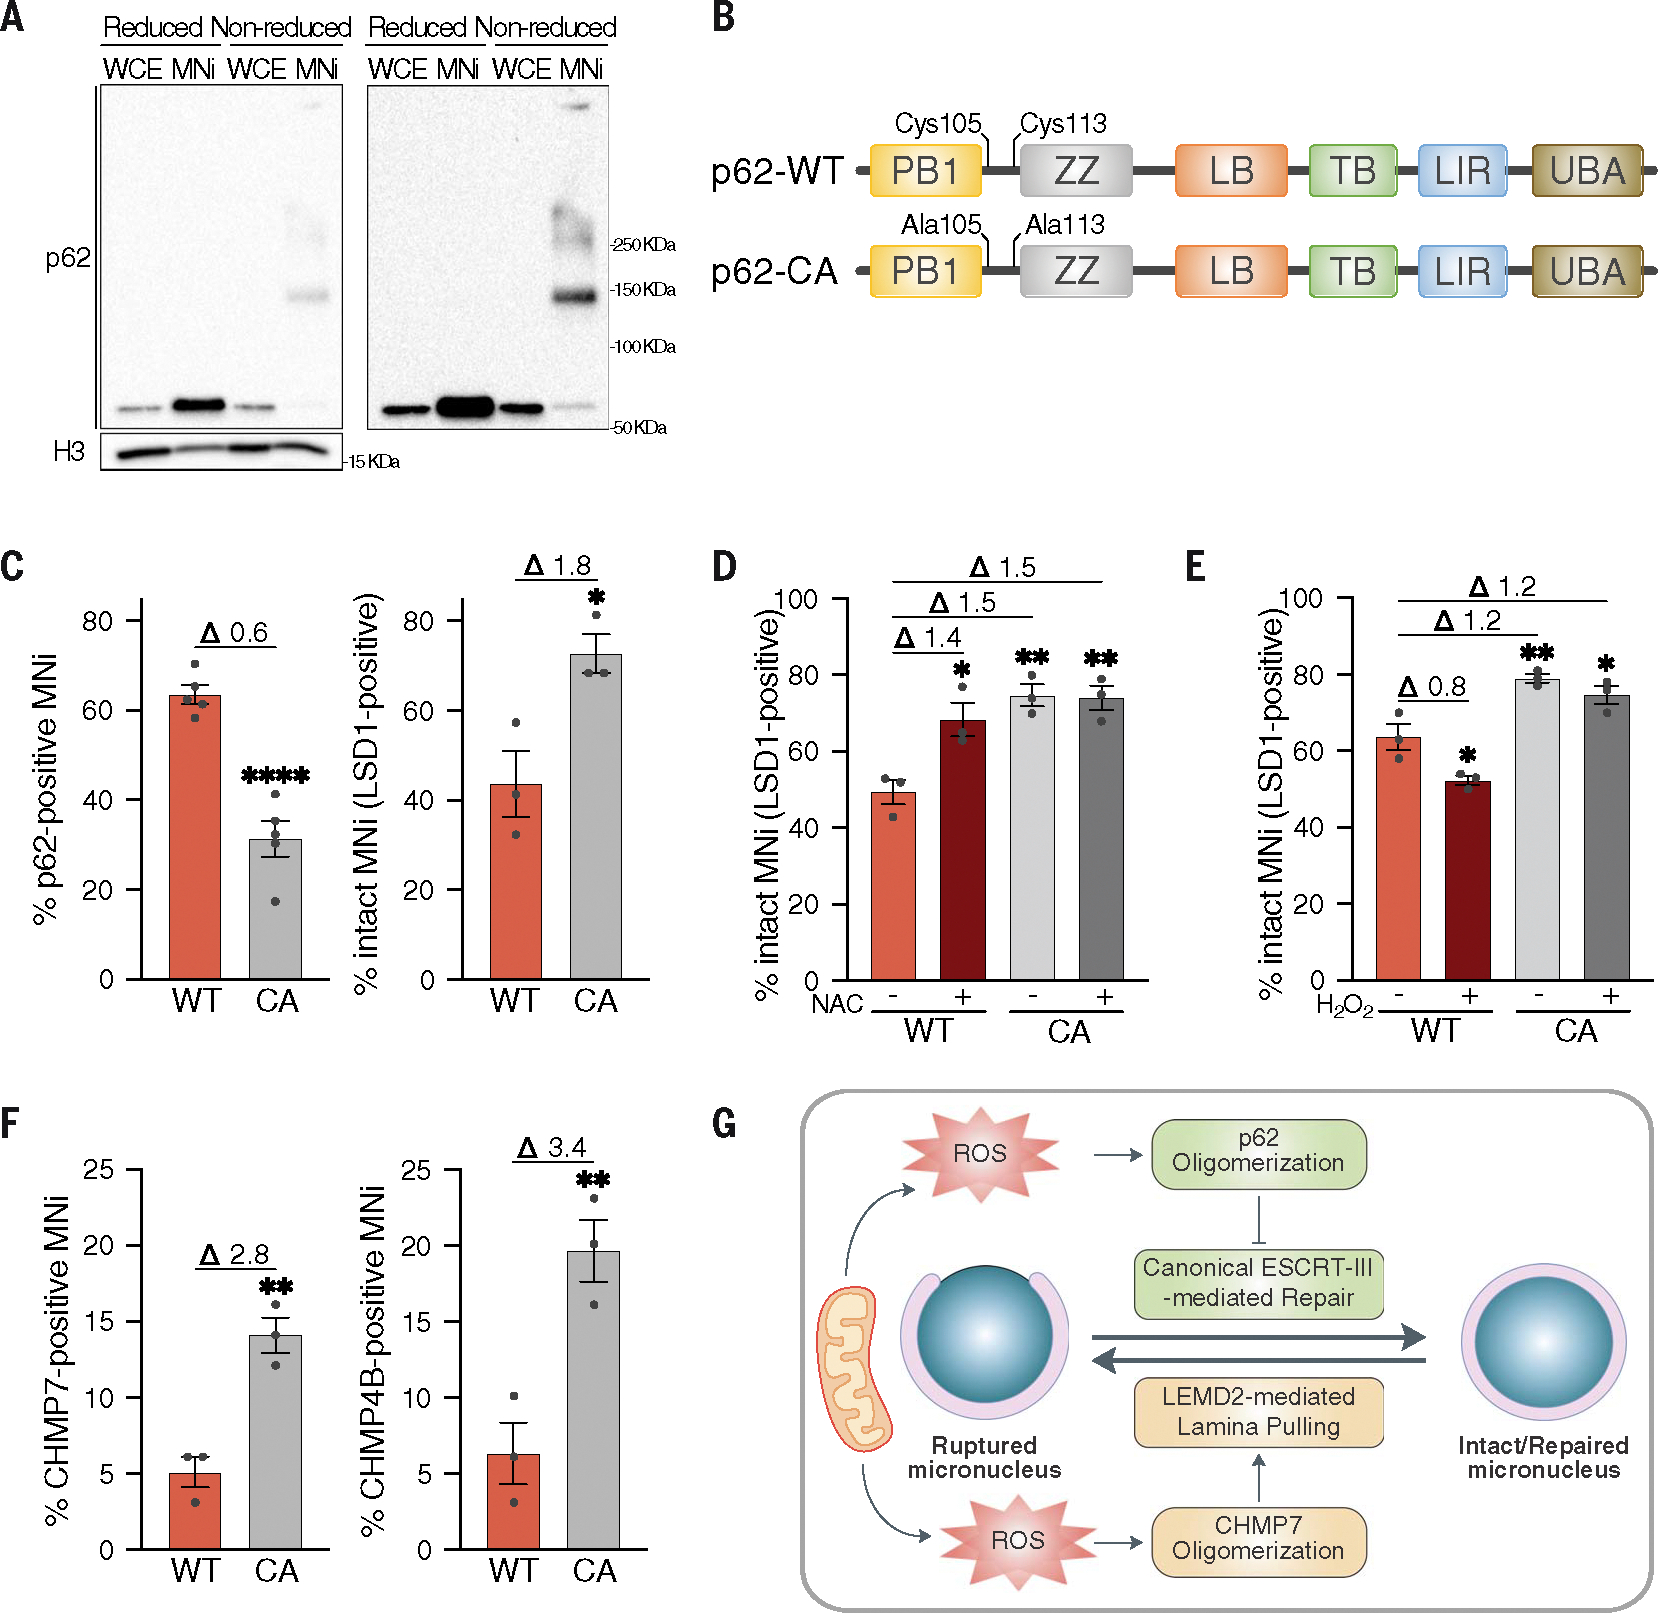
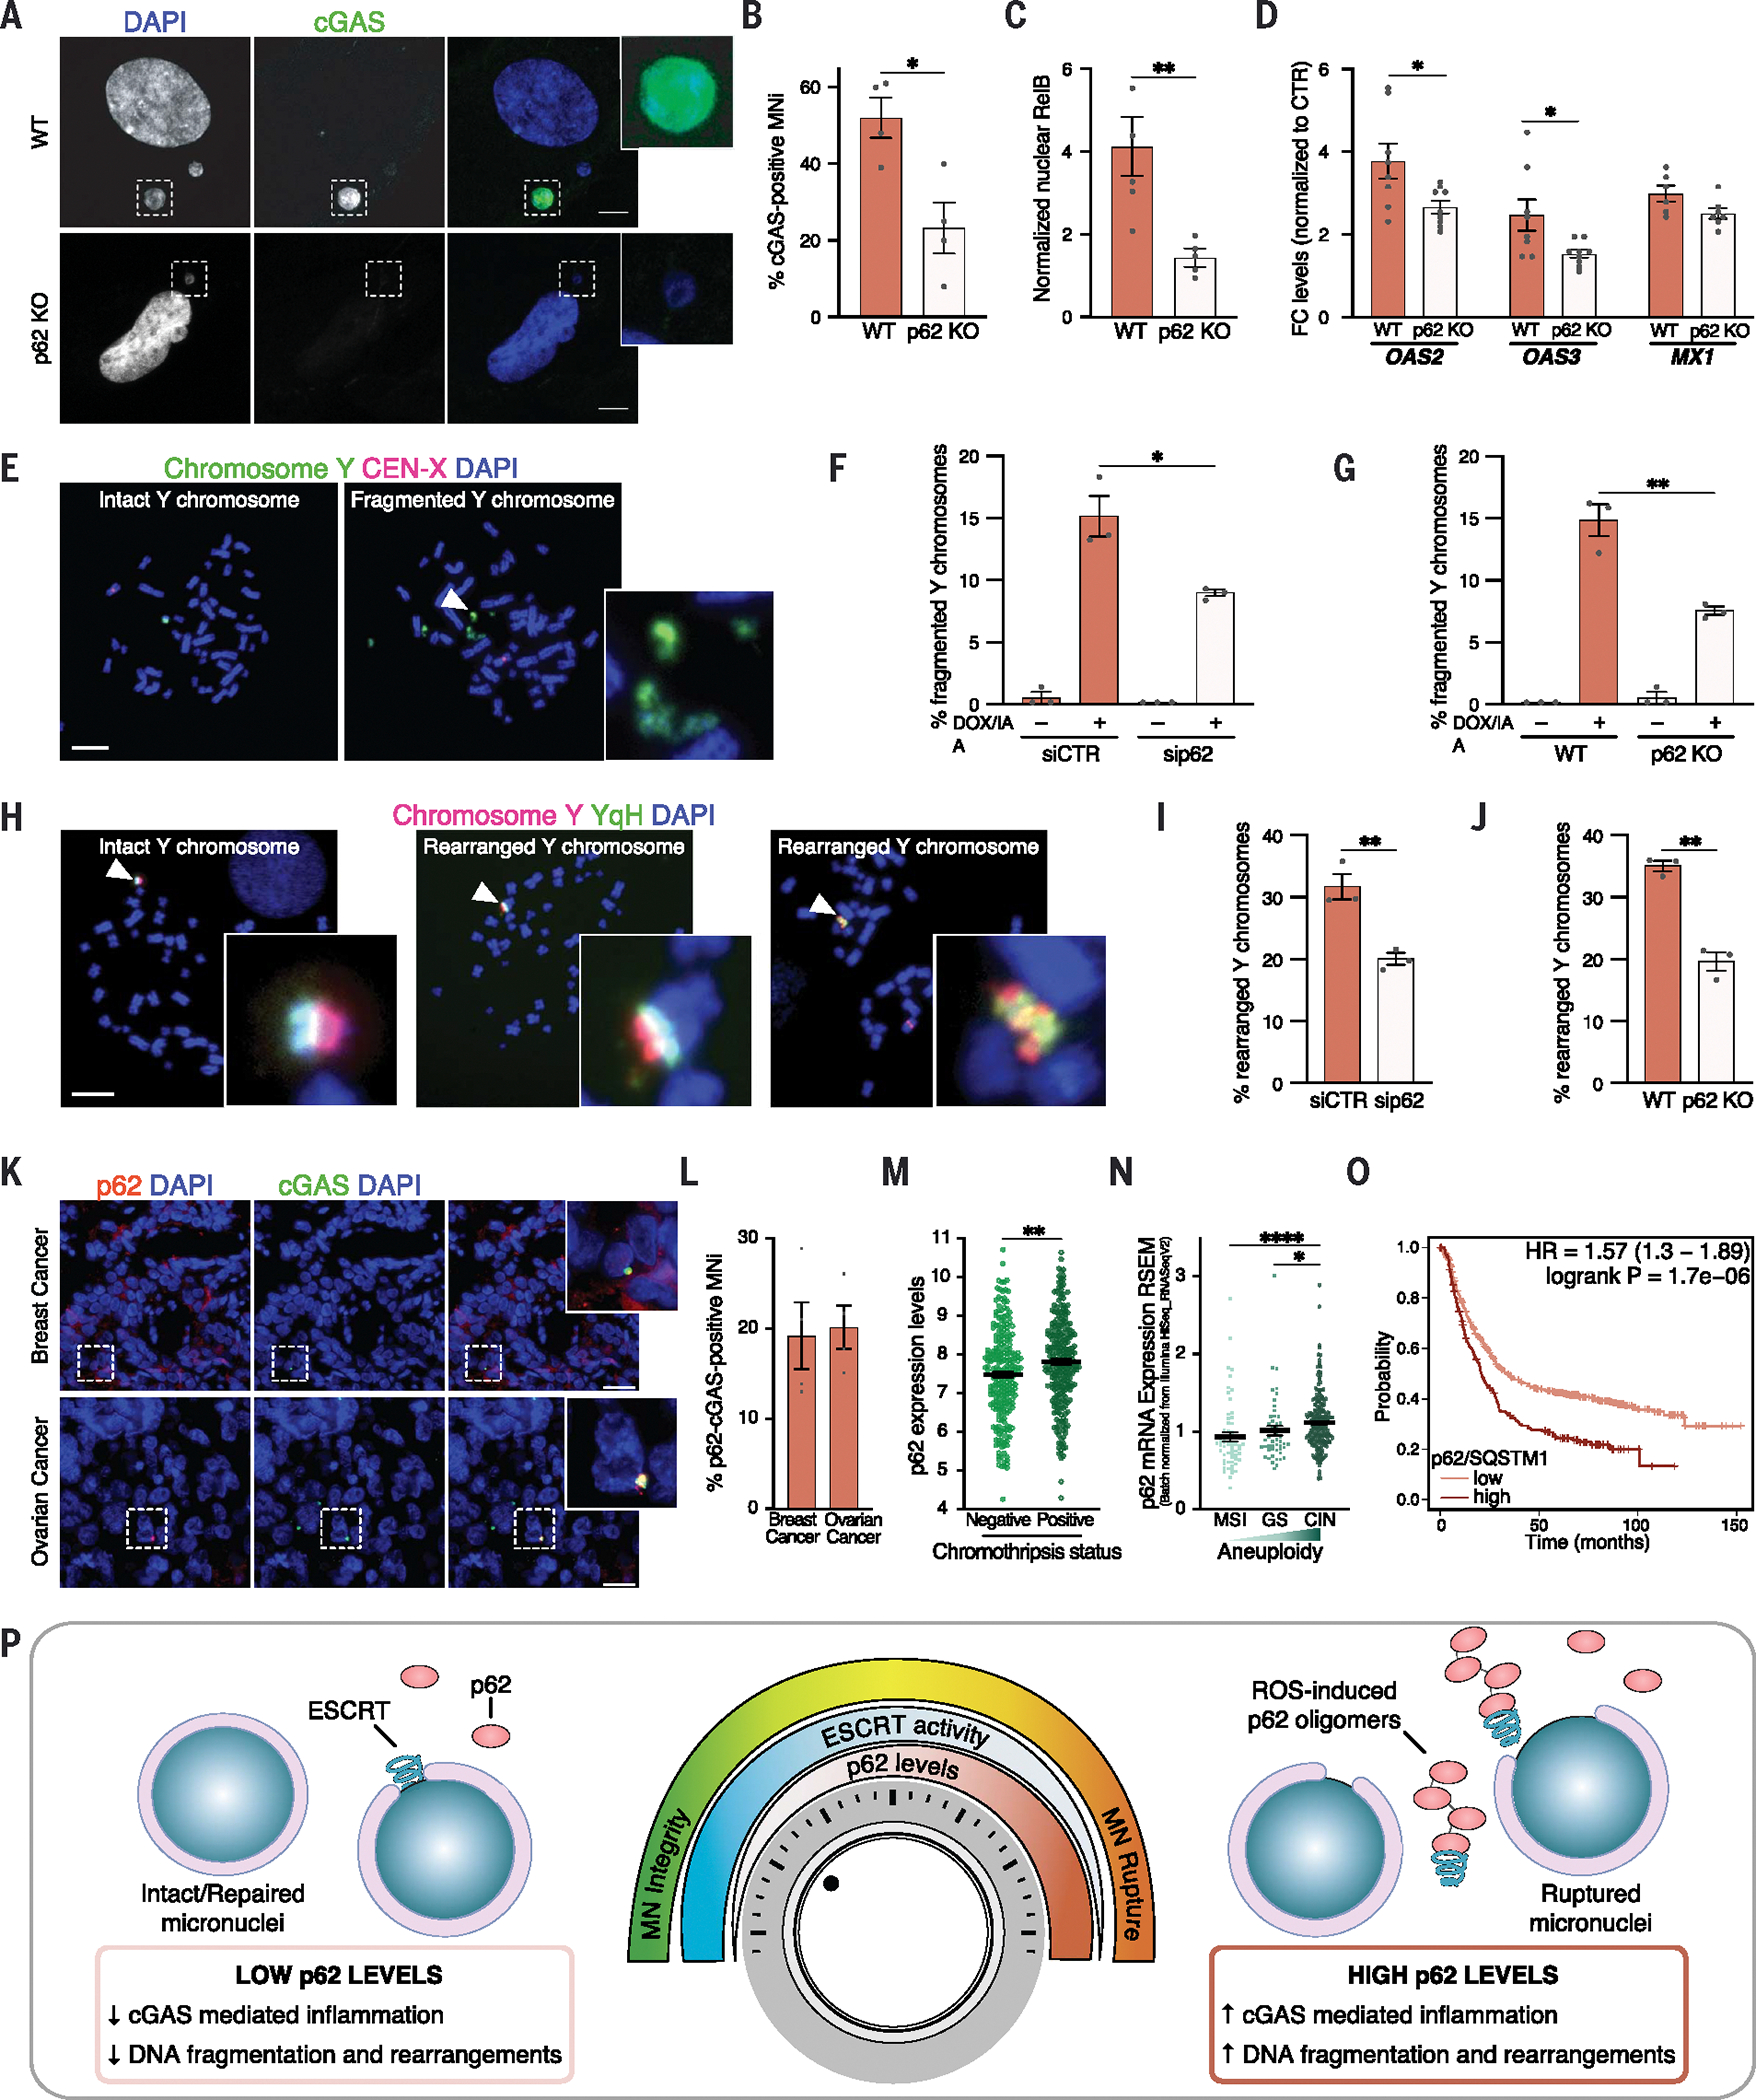
Chromosomal instability (CIN) generates micronuclei-aberrant extranuclear structures that catalyze the acquisition of complex chromosomal rearrangements present in cancer. Micronuclei are characterized by persistent DNA damage and catastrophic nuclear envelope collapse, which exposes DNA to the cytoplasm. We found that the autophagic receptor p62/SQSTM1 modulates micronuclear stability, influencing chromosome fragmentation and rearrangements. Mechanistically, proximity of micronuclei to mitochondria led to oxidation-driven homo-oligomerization of p62, limiting endosomal sorting complex required for transport (ESCRT)-dependent micronuclear envelope repair by triggering autophagic degradation. We also found that p62 levels correlate with increased chromothripsis across human cancer cell lines and with increased CIN in colorectal tumors. Thus, p62 acts as a regulator of micronuclei and may serve as a prognostic marker for tumors with high CIN.


Conflict of interest statement

Competing interests: S.F.B. owns equity in, receives compensation from, serves as a consultant to, and serves on the scientific advisory board and board of directors of Volastra Therapeutics. U.B.-D. receives consulting fees from Accent Therapeutics. The authors declare no other competing interests.

Figures

Fig. 1.
Fig. 1.. The autophagic receptor p62 recognizes micronuclear structures.
(A) Experimental workflow for the analysis of micronuclei (MNi) and primary nuclei (PNi) in HEK293T cells. (B) Top 10 enriched terms among up-regulated proteins by comparing MNi and PNi proteomes (enrichment analysis cutoff: FDR 0.05). (C) Experimental setup for the generation and analysis of MNi. (D) Representative confocal images of a cell harboring p62-positive (p62+, top) and p62-negative (p62, bottom) MNi. Scale bar, 5 μm. (E and F) Quantification of p62+ MNi generated with Mps1i (E) or spontaneously forming (F). N ≥ 100 MNi; three biological replicates indicated by data points. Data are means ± SEMs. (G) Representative super-resolution images of a p62+ MN. Scale bar, 1 μm. N = 8 MNi; two biological replicates. (H) Line scan graph of DAPI (micronuclear DNA) and p62 fluorescence intensities (a.u., arbitrary units), respective to a single Z stack of the MN represented in (G). The arrow indicates the directionality of the x axis of the graph. Line scan is representative of 8 MNi analyzed (two biological replicates). (I) Representative super-resolution 3D visualization of a p62+ MN. N = 8 MNi; two biological replicates. (J) (Top) CLEM representative images of a p62+ MN: confocal image of brightfield coupled with DAPI and p62 staining (left) and electron microscopy (EM) image after immunogold labeling of p62 (right). Scale bar, 5 μm. (Bottom) Magnified EM image showing the micronuclear DNA and p62 visualized as black dots (indicated by white arrowheads) within a micronuclear cavity (left), then recolored to highlight micronuclear DNA (blue) and the micronuclear cavity (red). N = 10 MNi; two biological replicates. (K and L) Quantification of cumulative recruitment of p62 to MNi during its formation (K) and with respect to its collapse (L) in H2B-RFP/p62-GFP hTERT-RPE1 cells. Three biological replicates are indicated by data points. Data are means ± SEMs. Chi-squared test, P < 0.0001.
Fig. 2.
Fig. 2.. Molecular characterization of p62 binding to micronuclei.
(A to F) Representative images [(A), (C), and (E)] and their quantifications [(B), (D), and (F)] of p62+ and pan-ubiquitin–positive (Ub) (A), Ub poly-Lys K63–positive (C), and Ub poly-Lys K48–positive (E) MNi. Scale bars, 5 μm. Three biological replicates; colored data points indicate the mean of a biological replicate. Data are means ± SEMs. Mann-Whitney test: (B) cytoplasm (Cyto) versus PNi and Cyto versus MNi, P < 0.0001, and PNi versus MNi, P = 0.0327; (D) Cyto versus MNi and PNi versus MNi, P < 0.0001, and Cyto versus PNi P = 0.0323; (F) Cyto versus PNi and Cyto versus MNi, P < 0.0001. (G and H) Quantification of p62 and p62+ MNi within pan-Ub (FK2)–positive ones (G) (N ≥ 170 MNi, five biological replicates; Chi-squared test, P < 0.0001) or of Ub poly-Lys K63–positive and poly-Lys K48–positive MNi among the p62+ ones (H) (N ≥ 100 MNi analyzed, three biological replicates). Replicates are indicated by data points. Data are means ± SEMs. (I and J) Super-resolution (I) and line scan graph (J) of p62 and pan-Ub (FK2) colocalization to a MN. Scale bar, 1 μm. N = 6 MNi analyzed; two biological replicates. (K) Quantification of colocalization of pan-Ub with p62 within p62+ MNi. N ≥ 100 MNi; three biological replicates indicated by data points. Data are means ± SEMs. Chi-squared test, P < 0.0001. (L to N) Representative images (L) and quantification [(M) and (N)] of p62 and pan-Ub signals of MNi in untreated (NT; DMSO) or E1i-treated (bottom) hTERT-RPE1. Scale bars, 5 μm. N ≥ 140 MNi, from at least four biological replicates indicated by data points. Data are means ± SEMs. Unpaired Student’s t test: (M) P = 0.0003; (N) P < 0.0001. (O) Domain organization of p62-deleted constructs. (P and Q) Quantification of pan-Ub–positive (P) and p62+ (Q) MNi in hTERT-RPE1 expressing the indicated constructs [non-transfected (NT)]. N ≥ 100 micronuclei; three biological replicates indicated by data points. Data are means ± SEMs. One-way analysis of variance (ANOVA) and Tukey’s multiple comparison test: NT versus ΔUBA, P = 0.0001; WT versus ΔPB1, P = 0.0491; WT versus ΔUBA, P = 0.0001; ΔPB1, ΔZZ, ΔLB, ΔT, ΔLIR versus ΔUBA, P < 0.0001.
Fig. 3.
Fig. 3.. p62-positive micronuclei have lost their envelope integrity.
(A and B) Representative image of a cell harboring a p62+ ruptured MN (LSD1) in hTERT-RPE1 cells (A) and quantification of p62 and p62+ MNi within the ruptured ones (B). Scale bar, 5 μm. N ≥ 170 MNi; five biological replicates indicated by data points. Data are means ± SEMs. Chi-squared test, P = 0.0005. (C and D) Representative image of a p62 herniation relative to a ruptured PN in fixed shRNA–lamin B1 NLS-GFP U2OS cells treated with hydroxyurea (C) and quantification of p62 and p62+ herniations (D). Scale bar, 10 μm. N ≥ 100 MNi analyzed; three biological replicates indicated by data points. Data are means ± SEMs. Chi-squared test, P < 0.0001. (E) (Left) Representative images of a hTERT-RPE1 cell harboring p62 and p62+ MNi selected for CLEM analysis: confocal image of DAPI and p62 staining (top) and EM image (bottom). Scale bar, 5 μm. (Right) Electron tomography representative images of p62 and p62+ MNi. In p62-negative micronucleus, black arrowheads point at the intact double layer of the nuclear envelope (NE). In p62-positive micronucleus, black arrowhead indicates a double layer of NE, white arrowheads point at the absent outer membrane of NE, and the arrow points at the point of rupture of NE. Images are representative of seven micronuclei analyzed from two biological replicates. Confocal images scale bar, 5 μm, EM images scale bar, 500 nm.
Fig. 4.
Fig. 4.. p62 levels regulate micronuclear integrity.
(A) Representative images of a cell with a p62+ LBR-enriched MN. Scale bar, 5 μm. (B) Quantification of p62+ MNi within lamin A–positive (LamA), NPC-positive, emerin-positive (Eme), and LBR-positive ones. N ≥ 100 MNi; at least three biological replicates (N = 3, 3, 3, 4). Chi-squared test: LBR, P < 0.0001. (C) Quantification of p62 and p62+ MNi within LBR-enriched ones in hTERT-RPE1 cells. N ≥ 100 MNi; three biological replicates. Chi-squared test, P < 0.0001. (D) Quantification of LBR-enriched MNi within lamin B– (LamB), H3K9ac-, H3K9me3-, and H3K27me2me3-positive ones in hTERT-RPE1 cells. N ≥ 100 MNi; at least three biological replicates (N = 6, 3, 3, 3). Chi-squared test, all P < 0.0001. (E) (Left) Representative images of a hTERT-RPE1 cell harboring an LBR-enriched (LBR+), p62+ MN and an LBR, p62 MN selected for CLEM. (Top) Confocal image of DAPI, LBR, and p62. (Bottom) EM image after immunogold labeling of LBR (black dots), magnified on the right. N = 6 MNi; two biological replicates. Scale bars: confocal, 5 μm; EM, 500 nm. (F and G) Representative images of ruptured (LSD1) and intact (LSD1+) MNi upon ± sip62 (F) and quantification of intact MNi in hTERT-RPE1 ± sip62 or ± p62 KO (G). Scale bar, 5 μm. N ≥ 200 MNi; six biological replicates. Unpaired t test: siRNA, P < 0.0001; KO, P = 0.0001. (H and I) Representative images of an intact (LSD1+) and a ruptured (LSD1) MN (H) and quantification of intact MNi (I) upon overexpression (o.e.) of GFP and p62-GFP in hTERT-RPE1 cells. Scale bar, 5 μm. N ≥ 100 MNi; four biological replicates. Unpaired t test, P = 0.0270. (J and K) Quantification of collapsed MNi (LBR-enriched) in hTERT-RPE1 cells ± sip62 or ± p62 KO (J) or ± p62 o.e. (K). N ≥ 100 MNi, from at least four biological replicates (N = 6, 4, 4). Unpaired t test: siRNA, P < 0.0001; KO, P = 0.0022; o.e., P = 0.0024. In (B), (C), (D), (G), (I), (J), and (K), each data point indicates a biological replicate. Data are means ± SEMs.
Fig. 5.
Fig. 5.. p62 controls peri-micronuclear autophagic degradation of ESCRT components.
(A) Experimental workflow for the mass spectrometry analysis of p62 proximity-proteome of MNi in HEK293T cells. (B) Top 10 enriched GO cellular component terms in the up-regulated proteins from p62 proximity-proteome of MNi (enrichment analysis cutoff: FDR 0.05). (C and D) Representative images showing a CHMP7 p62+ MN upon siCTR and a CHMP7+ MN upon sip62 (C) and quantification of CHMP7+ MNi (D) in hTERT-RPE1 cells upon ± sip62 or ± p62 KO. Scale bars, 5 μm. Unpaired t test: siRNA, P = 0.0486; KO, P = 0.0390. (E) Quantification of CHMP4B+ MNi in hTERT-RPE1 cells upon ± sip62 or ± p62 KO. Unpaired t test: siRNA, P = 0.0033; KO, P = 0.0337. (F) Quantification of CHMP2A+ MNi in hTERT-RPE1 cells upon ± sip62 or ± p62 KO. Unpaired t test: siRNA, P = 0.0066. (G and H) Quantification of CHMP7+ (G) or CHMP4B+ (H) MNi in hTERT-RPE1 cells upon treatment with SAR405 (SAR) or Baf-A1 (Baf) or chloroquine (Chq) or not treated (NT). Ordinary one-way ANOVA test followed by Tukey’s multiple comparison test (all versus NT). In (G): NT versus SAR405, P < 0.0001; NT versus Baf-A1, P = 0.0028; NT versus chloroquine, P = 0.0012. In (H): all P < 0.0001. In (D) to (H), fold changes upon normalization to relative controls are shown above the graphs. N ≥ 100 MNi; at least three biological replicates indicated by data points. Data are means ± SEMs.
Fig. 6.
Fig. 6.. p62 localizes to micronuclear cavities proximal to mitochondria.
(A) (Left) Representative CLEM analysis: confocal (top) and EM images (bottom). (Right) Representative electron tomography analysis of mitochondria proximity to the MN and tomography reconstruction (z-slices, gray; mitochondria, yellow; NE, cyan; ER, green). In total, 131 images were acquired (from −65° to +65°, acquisition every 1°) with the reconstructed tomogram encompassing a total of 200-nm depth; z-slices are shown from different directions (bottom). N = 8 MNi; two biological replicates. Scale bars, 5 μm. (B) Representative images of DeepSIM reconstruction of a p62+ MN showing mitochondria (visualized by mito-tracker) in proximity in hTERT-RPE1. Scale bar, 5 μm. (C) Quantification of the distance between mitochondria and p62+ or p62 cavities of MNi in hTERT-RPE1. Three biological replicates; each colored data point indicates the mean of a biological replicate. Data are means ± SEMs. Two-sided Mann-Whitney test, P < 0.0001. (D) Quantification of p62+ MNi and intact (LSD1+) MNi in hTERT-RPE1 cells ± NAC treatment (NT, not treated), labeled with DAPI, p62, and LSD1. Unpaired t test: p62-pos, P = 0.0088; LSD1-pos, P = 0.0395. (E) Quantification of p62+ MNi and intact (LSD1+) MNi in hTERT-RPE1 cells ± H2O2 treatment (NT, not treated). Unpaired t test: p62-pos, P = 0.0312; LSD1-pos, P = 0.0216. In (D) and (E), fold changes upon normalization to the relative controls are displayed above the graphs. N ≥ 100 MNi; three biological replicates. Each data point indicates a biological replicate. Data are means ± SEMs.
Fig. 7.
Fig. 7.. Micronuclei-mitochondria proximity leads to oxidation-driven homo-oligomerization of p62.
(A) Reduced and nonreduced Western blot analysis of p62 homo-oligomerization in whole cell extracts (WCEs) and MNi isolated from HEK293T cells, showing low (left) and high (right) p62 exposure. H3 used as loading control. Four biological replicates. (B) Schematic representation of p62-CA mutant showing protein domains and mutated residues. (C) Quantification of p62+ MNi and intact (LSD1+) MNi in hTERT-RPE1 p62 KO stably expressing FLAG-tagged p62-WT or p62-CA mutant. Unpaired t test: p62+, P < 0.0001; LSD1+, P = 0.0270. (D) Quantification of intact (LSD1+) MNi in hTERT-RPE1 p62 KO stably expressing FLAG-tagged p62-WT or p62-CA mutant upon ± NAC treatment. Ordinary one-way ANOVA test followed by Tukey’s multiple comparison test (all versus WT NT): WT NT versus WT NAC, P = 0.0119; WT NT versus CA NT, P = 0.0022; WT NT versus CA NAC, P = 0.0026. (E) Quantification of intact (LSD1+) MNi in hTERT-RPE1 p62 KO stably expressing FLAG-tagged p62-WT or p62-CA mutant upon ± H2O2 treatment, labeled with DAPI, FLAG, and LSD1. Ordinary one-way ANOVA test followed by Tukey’s multiple comparison test (all versus WT NT): WT NT versus WT NAC, P = 0.0195; WT NT versus CA NT, P = 0.0036; WT NT versus CA NAC, P = 0.0226. (F) Quantification of CHMP7+ and CHMP4B+ MNi in hTERT-RPE1 p62 KO stably expressing FLAG-tagged p62-WT or p62-CA mutant. Unpaired t test: CHMP7+, P = 0.0041; CHMP4B+, P = 0.0097. (G) Schematic model showing p62 and ROS functioning in modulating micronuclear integrity via inhibiting ESCRT-III–mediated repair activity. See text for more details. In (C) to (F), fold changes upon normalization to the relative controls are displayed above the graphs. N ≥ 100 MNi; at least three biological replicates indicated by data points. Data are means ± SEMs.
Fig. 8.
Fig. 8.. p62 drives micronuclear catastrophe.
(A and B) Representative images (A) and quantification (B) of cGAS+ MNi in WT and p62 KO cells in MDA-MB-231 cells. Scale bars, 5 μm. N ≥ 140 MNi; four biological replicates. Unpaired t test, P = 0.0145. (C) Quantification of RelB translocation into PN in MDA-MB-231 cells ± p62 KO. N ≥ 200 cells; three biological replicates. Unpaired t test, P = 0.0072. (D) Quantification of OAS2, OAS3, and MX1 levels in MDA-MB-231 cells ± p62 KO, normalized to the respective controls (DMSO). GAPDH used as loading control. N = 8, 9, 8, 9, 6, 7. Unpaired t test: OAS2, P = 0.0197; OAS3, P = 0.0228. (E to J) Representative metaphase spreads of intact, fragmented (E) and rearranged (H) Y chromosomes in DLD-1 cells after 3 days of DOX/IAA treatment and G418 selection labeled with DAPI and with FISH probes targeting the Y chromosome and X centromere (E) or the euchromatic (red) and heterochromatic (YqH, green) regions of the Y chromosome (H). Quantification of fragmented [(F) and (G)] and rearranged [(I) and (J)] Y chromosomes in ± sip62 [(F) and (I)] or ± p62KO [(G) and (J)]. Scale bars, 10 μm. N ≥ 120 metaphases; three biological replicates. Unpaired t test: (F), P = 0.0203; (G), P = 0.0053; (I), P = 0.0067; (J), P = 0.0080. (K and L) Representative images of breast and ovarian tumor tissues harboring p62+ cGAS+ MNi, labeled with DAPI, p62, and cGAS (K) and quantification of p62+-cGAS+ double-positive MNi (L). Scale bars, 100 μm. Four case studies for each tumor are indicated by data points. Data are means ± SEMs. (M) p62 mRNA levels [log2(TPM +1)] of 517 cancer cell lines. Data are means ± SEMs. Two-sided Mann-Whitney test, P = 0.001. (N) p62 mRNA levels in colorectal adenocarcinoma (COAD) classified by subtype. Data are means ± SEMs. Kruskal-Wallis test followed by Dunn’s multiple comparison test: MSI versus CIN, P < 0.0001; GS versus CIN, P = 0.0312. (O) Kaplan-Meier plot of gastric tumors stratified for p62 expression. Hazard ratio (HR) = 1.57; P = 1.7 × 10⁻⁶. (P) Schematic model illustrating p62 as a rheostat in regulating micronuclear integrity. See text for more details. In (B), (C), (D), (F), (G), (I), and (J), each data point indicates a biological replicate. Data are means ± SEMs.

Comment in

References

    1. Holland AJ, Cleveland DW, Boveri revisited: Chromosomal instability, aneuploidy and tumorigenesis. Nat. Rev. Mol. Cell Biol. 10, 478–487 (2009). doi: 10.1038/nrm2718; - DOI - PMC - PubMed
    1. Bakhoum SF, Cantley LC, The Multifaceted Role of Chromosomal Instability in Cancer and Its Microenvironment. Cell 174, 1347–1360 (2018). doi: 10.1016/j.cell.2018.08.027; - DOI - PMC - PubMed
    1. Ippolito MR et al., Gene copy-number changes and chromosomal instability induced by aneuploidy confer resistance to chemotherapy. Dev. Cell 56, 2440–2454.e6 (2021). doi: 10.1016/j.devcel.2021.07.006; - DOI - PubMed
    1. Lukow DA et al., Chromosomal instability accelerates the evolution of resistance to anti-cancer therapies. Dev. Cell 56, 2427–2439.e4 (2021). doi: 10.1016/j.devcel.2021.07.009; - DOI - PMC - PubMed
    1. Trakala M et al., Clonal selection of stable aneuploidies in progenitor cells drives high-prevalence tumorigenesis. Genes Dev. 35, 1079–1092 (2021). doi: 10.1101/gad.348341.121; - DOI - PMC - PubMed

Publication types

MeSH terms

Substances