. 2024 Aug 29;20(8):e1012408.
doi: 10.1371/journal.pcbi.1012408. eCollection 2024 Aug.

Identification of a serum proteomic biomarker panel using diagnosis specific ensemble learning and symptoms for early pancreatic cancer detection

Affiliations

Identification of a serum proteomic biomarker panel using diagnosis specific ensemble learning and symptoms for early pancreatic cancer detection

Alexander Ney et al. PLoS Comput Biol. .

Abstract

Background: The grim (<10% 5-year) survival rates for pancreatic ductal adenocarcinoma (PDAC) are attributed to its complex intrinsic biology and most often late-stage detection. The overlap of symptoms with benign gastrointestinal conditions in early stage further complicates timely detection. The suboptimal diagnostic performance of carbohydrate antigen (CA) 19-9 and elevation in benign hyperbilirubinaemia undermine its reliability, leaving a notable absence of accurate diagnostic biomarkers. Using a selected patient cohort with benign pancreatic and biliary tract conditions we aimed to develop a data analysis protocol leading to a biomarker signature capable of distinguishing patients with non-specific yet concerning clinical presentations, from those with PDAC.

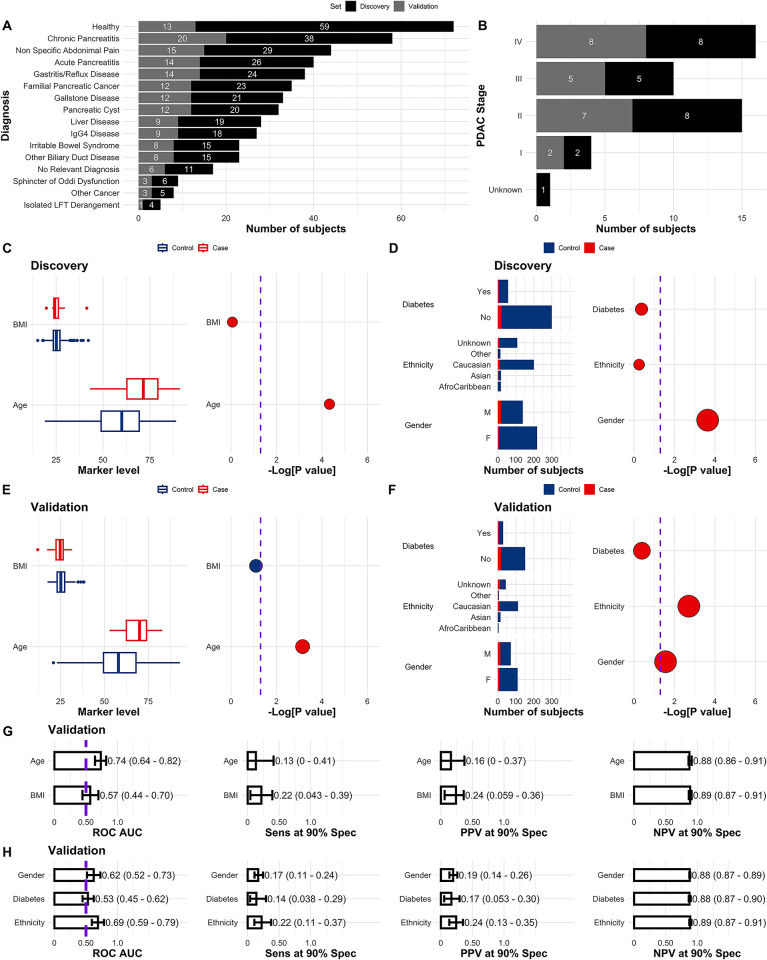
Methods: 539 patient serum samples collected under the Accelerated Diagnosis of neuro Endocrine and Pancreatic TumourS (ADEPTS) study (benign disease controls and PDACs) and the UK Collaborative Trial of Ovarian Cancer Screening (UKCTOCS, healthy controls) were screened using the Olink Oncology II panel, supplemented with five in-house markers. 16 specialized base-learner classifiers were stacked to select and enhance biomarker performances and robustness in blinded samples. Each base-learner was constructed through cross-validation and recursive feature elimination in a discovery set comprising approximately two thirds of the ADEPTS and UKCTOCS samples and contrasted specific diagnosis with PDAC.

Results: The signature which was developed using diagnosis-specific ensemble learning demonstrated predictive capabilities outperforming CA19-9, the only biomarker currently accepted by the FDA and the National Comprehensive Cancer Network guidelines for pancreatic cancer, and other individual biomarkers and combinations in both discovery and held-out validation sets. An AUC of 0.98 (95% CI 0.98-0.99) and sensitivity of 0.99 (95% CI 0.98-1) at 90% specificity was achieved with the ensemble method, which was significantly larger than the AUC of 0.79 (95% CI 0.66-0.91) and sensitivity 0.67 (95% CI 0.50-0.83), also at 90% specificity, for CA19-9, in the discovery set (p = 0.0016 and p = 0.00050, respectively). During ensemble signature validation in the held-out set, an AUC of 0.95 (95% CI 0.91-0.99), sensitivity 0.86 (95% CI 0.68-1), was attained compared to an AUC of 0.80 (95% CI 0.66-0.93), sensitivity 0.65 (95% CI 0.48-0.56) at 90% specificity for CA19-9 alone (p = 0.0082 and p = 0.024, respectively). When validated only on the benign disease controls and PDACs collected from ADEPTS, the diagnostic-specific signature achieved an AUC of 0.96 (95% CI 0.92-0.99), sensitivity 0.82 (95% CI 0.64-0.95) at 90% specificity, which was still significantly higher than the performance for CA19-9 taken as a single predictor, AUC of 0.79 (95% CI 0.64-0.93) and sensitivity of 0.18 (95% CI 0.03-0.69) (p = 0.013 and p = 0.0055, respectively).

Conclusion: Our ensemble modelling technique outperformed CA19-9, individual biomarkers and indices developed with prevailing algorithms in distinguishing patients with non-specific but concerning symptoms from those with PDAC, with implications for improving its early detection in individuals at risk.


Conflict of interest statement

I have read the journal’s policy and the authors of this manuscript have the following competing interests: UM reports stock ownership in Abcodia UK between 2011 and 2021; UM has received grants from the Medical Research Council (MRC), Cancer Research UK, the National Institute for Health Research (NIHR), the India Alliance, NIHR Biomedical Research Centre at University College London Hospital, and The Eve Appeal; UM currently has research collaborations with iLOF, RNA Guardian and Micronoma, with funding paid to UCL; UM holds patent number EP10178345.4 for Breast Cancer Diagnostics; AG currently has research collaborations with Micronoma and iLoF, with the research funding awarded to UCL. The other authors have declared that no competing interests exist.

Figures

Fig 1
Fig 1. Characteristics of the discovery and validation sets.
Number of controls across the discovery and validation sets (A), number of PDAC cases per stage (B), and association of BMI, Age, Diabetes, Ethnicity and Gender with PDAC status (C-F). In C, D, E and F dot sizes correspond to odds ratios and are colour coded according to their respective values, i.e., blue if OR<1 and red if OR>1. p values were calculated according to a logistic regression model with a bias reduction method. Purple dashed lines correspond to -Log[0.05]. G Receiver Operating Characteristic (ROC) Area Under the Curve (AUC), Sensitivity (Sens), Positive Predictive Value (PPV) and Negative Predictive Value (NPV) at 90% Specificity (Spec) performance of single marker models, i.e. BMI and Age, in the validation set. H Similar to A but for Gender, Ethnicity and Diabetes. Performances were calculated with the respective single feature models developed in the discovery set. The ROC AUC significance threshold is also represented by a purple dashed line at 0.5. Error bars in figures corresponding to the validation set are the 95% Confidence Intervals (CI), calculated by stratified bootstrapping 2000 times. See Statistical Analysis in Materials and methods for further details and Tables A, B and N in S1 Appendix.
Fig 2
Fig 2. Performance of individual base-learner classifiers, stack ensemble and state-of-the art algorithms.
A Base-learners performance in the discovery set. Each base-learner classifier was developed by training with a recursive feature elimination technique (RFE) and logistic regression (glm) in samples belonging to each specific diagnosis class against the same 24 PDACs in the discovery set. The performance reported in A is, nevertheless, of each classifier in the whole discovery set. The performances reported in B correspond to the base-learners developed in the discovery set but applied to the whole validation set. In C and D the performance of the ensemble stack based on the base-learners presented in A and B, as well as of state-of-the-art algorithms (xgbTree, RRF and RFE glm) is reported in the discovery and held-out validation sets, respectively. xgbTree, RRF and RFE glm were trained in the whole discovery set, which contrasts with the ensemble algorithm. Receiver Operating Characteristic (ROC) Area Under the Curve (AUC), Sensitivity (Sens), Positive Predictive Value (PPV) and Negative Predictive Value (NPV) at 90% Specificity (Spec).
Fig 3
Fig 3. Features selected per diagnosis class (base-learner classifiers).
The scaled importance is calculated within each base-learner (Fig 2A). Selected features are ranked from left to right according to the average scaled importance across base learners. See Fig 1 and Tables B, C and D in S1 Appendix for the univariate predictive performances of each of the markers in the discovery and validation sets. See Materials and methods section for details on model-agnostic algorithm for feature importance calculation. See S1 Data file for the underlying data for the figure.
Fig 4
Fig 4. Association between symptoms and PDAC.
A Number of subjects with each symptom according to PDAC status, case or control. B Association of symptoms with PDAC status, p values were calculated according to a logistic regression model with a bias reduction method. Purple dashed lines correspond to -Log [0.05]. In B dot sizes correspond to odds ratios and are colour coded according to their respective values, i.e., blue if OR<1 and red if OR>1. See also Table I in S1 Appendix. Only samples belonging to the ADEPTS cohort were used as no information about symptoms was available for the UKCTOCS set of samples.
Fig 5
Fig 5. Receiver operating characteristic curves for selected models in symptomatic patients.
A Only CA19-9. B Full index signature. C Reduced index signature. The probability values used to calculate the performance metrics were generated with each model developed in the discovery set and reported in the main text. Probability values for symptomatic patients belonging to the discovery set and validation set were concatenated to generate the ROC curves. Only ADEPTS samples had symptoms information. A. L. Derang.: Asymptomatic LFT Derangement. B. Pain: Back Pain. C. B. Habit: Change in Bowel Habit. W. Loss: Weight Loss. See also Table 2 for numerical values for area under the curve and other metrics.
Fig 6
Fig 6. Prediction of PDAC in patients with specific symptoms and according to QCancer score values.
The ensemble stack was selected as the best model according to Fig 2. A Performance of the stack in participants for which a Qscore had been calculated or above a specific threshold, bigger than 2, 2.5 or 3.0. B Performance of the Qscore taken as the predictor of PDAC risk in participants for which a Qscore had been calculated or above a specific threshold, bigger than 2, 2.5 or 3.0. C Number of subjects that had a calculated Qscore or are above a specific threshold, bigger than 2, 2.5 or 3.0. D Correlation between QCancer score and odds ratio of PDAC according to the stacked ensemble. D is in log scale and R stands for the Person correlation coefficient and p for the p-value calculated with a t-test. The QCancer score is identified as Qscore in the figure panels. Receiver Operating Characteristic (ROC) Area Under the Curve (AUC), Sensitivity (Sens), Positive Predictive Value (PPV) and Negative Predictive Value (NPV) at 90% Specificity (Spec).

References

    1. Kamisawa T, Wood LD, Itoi T, Takaori K. Pancreatic cancer. The Lancet. 2016;388:73–85. doi: 10.1016/S0140-6736(16)00141-0 - DOI - PubMed
    1. Sung H, Ferlay J, Siegel RL, Laversanne M, Soerjomataram I, Jemal A, et al. Global Cancer Statistics 2020: GLOBOCAN Estimates of Incidence and Mortality Worldwide for 36 Cancers in 185 Countries. CA: A Cancer Journal for Clinicians. 2021;71:209–49. doi: 10.3322/caac.21660 - DOI - PubMed
    1. Carioli G, Malvezzi M, Bertuccio P, Boffetta P, Levi F, Vecchia CL, et al. European cancer mortality predictions for the year 2021 with focus on pancreatic and female lung cancer. Annals of Oncology. 2021;32:478–87. doi: 10.1016/j.annonc.2021.01.006 - DOI - PubMed
    1. Marchegiani G, Andrianello S, Malleo G, De Gregorio L, Scarpa A, Mino-Kenudson M, et al. Does Size Matter in Pancreatic Cancer?: Reappraisal of Tumour Dimension as a Predictor of Outcome Beyond the TNM. Annals of Surgery. 2017;266(1). doi: 10.1097/SLA.0000000000001837 - DOI - PubMed
    1. Zerboni G, Signoretti M, Crippa S, Falconi M, Arcidiacono PG, Capurso G. Systematic review and meta-analysis: Prevalence of incidentally detected pancreatic cystic lesions in asymptomatic individuals. Pancreatology. 2019;19:2–9. doi: 10.1016/j.pan.2018.11.014 - DOI - PubMed

Substances