. 2024 Nov 12;8(21):5467-5478.
doi: 10.1182/bloodadvances.2024013546.

Thrombomodulin (p.Cys537Stop) is released from cells by an unusual membrane insertion/leakage mechanism

Affiliations

Thrombomodulin (p.Cys537Stop) is released from cells by an unusual membrane insertion/leakage mechanism

Clara Bernard et al. Blood Adv. .

Abstract

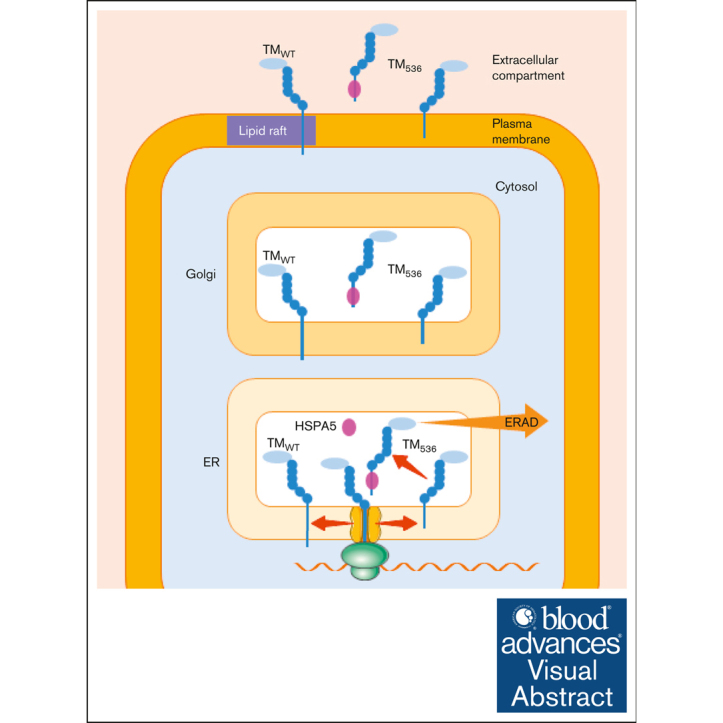
Expression of the thrombomodulin (TM) variant c.1611C>A (p.Cys537Stop) leads to the synthesis of a protein with no cytoplasmic tail and a transmembrane domain shortened by 3 amino acids (TM536). However, little is known regarding the release mechanism and properties of TM536. Using umbilical vein endothelial cells and peripheral blood-derived endothelial colony-forming cells from a heterozygous carrier of the TM536 variant as well as overexpression cell models, we demonstrated that TM536 is released from cells by an unusual mechanism. First, TM536 is inserted into the endoplasmic reticulum (ER) membrane, then, because of the low hydrophobicity of its intramembrane domain, it escapes from it and follows the conventional secretory pathway to be released into the extracellular compartment without the involvement of proteolysis. This particular secretion mechanism yields a soluble TM536, which is poorly modified by chondroitin sulfate glycosaminoglycan compared with conventionally secreted soluble forms of TM, and therefore has a suboptimal capacity to mediate thrombin-dependent activation of protein C (PC). We also showed that TM536 cellular trafficking was altered, with retention in the early secretory pathway and increased sensitivity to ER-associated degradation. As expected, activation of ER-associated degradation increased TM536 degradation and reduced its release. The expression of TM536 at the cell surface was low, and its distribution in lipid raft-like membrane microdomains was altered, resulting in low thrombin-dependent PC activation on the cell surface.


Conflict of interest statement

Conflict-of-interest disclosure: The authors declare no competing financial interests.

Figures

None
Graphical abstract
Figure 1.
Figure 1.
Patients’ description. (A) Pedigrees of the affected family. Squares denote males; circles denote females; slash denote deceased family member; solid red and black symbols represent family members with a history of bleeding and heterozygous carriers of the THBD variant (c.1611C>A giving TM536), respectively. The arrow indicates the proband. Plasma sTM concentrations were measured by enzyme-linked immunosorbent assay (ELISA; normal value <10 ng/mL). rFIIa was measured in the serum derived from the coagulation of plasma (normal value <30%). (B) FIIa generation assays were performed in PPP and PRP plasma from a control participant and 4 family members affected by the TM536 mutation. PPP, platelet-poor plasma; PRP, platelet-rich plasma; rFIIa, residual FIIa.
Figure 2.
Figure 2.
Expression and release of TM536. TMWT and TM536 were overexpressed in HEK293 cells then (A) TM was measured by ELISA in cell CM after 17 hours of accumulation and in cell lysates (CM/lysate ratio reflects TM release capacity) and (B) TM cell-surface expression was measured by flow cytometry. (C) Cells were homogenized for DRM preparation, and TM and Cav1 (DRM marker) were detected by immunoblot in each fraction of the sucrose density gradient. Densitometric analysis of the immunoblots (right panels) shows TM and Cav1 distribution in the gradient as a percentage of their total amount. (D) Immunoblot detection of TM and endogenous IR in lysates of cells overexpressing TMWT and TM536 and on their surfaces after biotinylation and enrichment of cell-surface–exposed proteins (d- indicates the position of TM homodimers). The enrichment of cell-surface–exposed proteins is attested by the detection of IR. The proIR is intracellular and only detected in cell lysates, whereas its mature form (IR) is exposed at the cell surface. (E) Lysates from cells overexpressing TMWT or TM536 were left untreated (−) or deglycosylated with EndoH (+), and TM was detected using immunoblot. Values are mean ± standard deviation (SD) expressed as fold change relative to TMWT. Statistical analyses were performed using unpaired t test in panels A,B. ∗∗∗P < .001. CaV1, Caveolin 1; IR, insulin receptor; proIR, proform of IR.
Figure 3.
Figure 3.
Expression and release of TM from HUVEC. (A) TM was measured by ELISA in HUVEC and HUVEC536 CM and lysates (CM/lysate ratio reflects TM release capacity). (B) TM contained in the CM of HUVEC and HUVEC536 was concentrated by Con A or FIIa affinity purification and run on SDS-PAGE alongside sTM produced by HEK293 cells overexpressing TM536, then TM was detected by immunoblot. (C) Expression of TM on the surface of HUVEC and HUVEC536 was measured using flow cytometry. (D) Immunoblot detection of TM and GAPDH (loading control) in lysates of HUVEC and HUVEC536. (E) TM was detected in the lysates of HUVEC and HUVEC536 submitted (+) or not (−) to EndoH deglycosylation. Value are mean ± SD expressed as fold change relative to TMWT or HUVEC. Statistical analyses were performed using an unpaired t test for panel A or Mann-Whitney test for panel C. ∗P < .05; ∗∗∗P < .001. Con A, Concanavalin A; GAPDH, glyceraldehyde-3-phosphate dehydrogenase; OE, overexposed blot.
Figure 4.
Figure 4.
Characterization of released sTM536. (A) HEK293 cells overexpressing TMWT and TM536 were treated with TMI-5 (+; 5 μM; 17 hours), and TM was measured by ELISA in CM and cell lysates. (B) TMWT and TM536 were overexpressed together with inactive (−) or active (+) RHBDL2, and TM was measured by ELISA, as in panel A (inset shows RHBDL2 expression in cell lysates; Ø, no RHBDL2). (C) CS-TM536 was overexpressed together with inactive (−) or active (+) RHBDL2, and sTM536 in CM was detected by immunoblot. (D) Immunoblot detection of TM536 and Flot1 (used as a cell lysate marker) contained in CM and cell lysate. Values are mean ± SD, expressed as fold change relative to TMWT-overexpressing cells. Statistical analyses were performed using an unpaired t test for panel A or Mann-Whitney test for panel B. ∗∗P < .01; ∗∗∗P < .001. CS-TM536, CS-devoid TM536; Flot1, Flotilin 1.
Figure 5.
Figure 5.
Mechanism of TM536 release from cells. (A) CM from TM536-overexpressing cells were left untreated (−) or deglycosylated with EndoH or PNGaseF (+), then TM was detected by immunoblot. Enzyme’s ability to deglycosylate TM536 was confirmed using TM536 from the cell lysate. (B) The indicated forms of TM536 were overexpressed in HEK293 cells, then TM was measured by ELISA in the CM and cell lysates (CM/lysate ratio reflects TM release capacity). The inset shows the hydropathy scores (ΔG) of IMD. Values are mean ± SD, expressed as fold change compared with TM536. Statistical analyses were performed using analysis of variance (ANOVA) followed by Dunnett multiple comparison tests (vs TM536): ∗P < .05; ∗∗∗P < .001. (C) Immunoblot detection of soluble forms of TM536C527S contained in the CM of HEK293 cells overexpressing the inactive (−) or active form (+) of RHBDL2. (D) GPMV was prepared from HEK293 cells overexpressing TMWT and TM536 and incubated for 5 hours. TM in CM (sTM) and GPMV lysates (mTM) was measured by ELISA. The release of TM from GPMVs is shown by the ratios of sTM/mTM from 3 independent experiments (Exp 1-3). (E) Intracellular vesicles prepared from HEK293 and HELA cells overexpressing TMWT and TM536 were disrupted by incubation in Na2CO3 or saponin, and soluble TM (sTM) and mTM levels were measured by ELISA. The release of TM in the lumen of intracellular vesicles is shown by the ratios of sTM/mTM from 5 independent experiments (Exp 1-5). Exp, experiment; mTM, membrane TM.
Figure 6.
Figure 6.
Degradation of TM536 by ERAD. (A) His-tagged CS-TM536 was overexpressed with inactive (−) or active (+) RHBDL2, soluble TM was purified by immobilized metal affinity chromatography from CM, and TM and HSPA5 were detected by immunoblot. (B) The TM-HSPA5 complex was detected by ELISA in the plasma from TM536 patients (patients) and healthy participants (controls). (C) Cells overexpressing TMWT or TM536 were treated or not with MG (5 μM; 17 hours) then TM in cell lystates was detected by immunoblot. (D) Cells overexpressing TM536 were treated with MG, cell lysates were deglycosylated with EndoH, and TM was detected by immunoblot. (E) TM detected by immunoblot in lysates of HUVEC and HUVEC536 treated with MG (5 μM; 17 hours; GAPDH, loading control). (F) Cells overexpressing TMWT or TM536 were treated with CL (10 μM; 17 hours) and MG, and TM was detected by immunoblot of cell lysates. (G) Cells overexpressing TMWT or TM536 were treated with CL, and then TM in CM and cell lysates were measured by ELISA. Values are mean ± SD expressed as fold change compared with TMWT without CL. Statistical analyses were performed using the Mann-Whitney test. ∗∗P < .01. Arrowheads on overexposed blots (OE) indicate bands that appear with MG132 treatment. MG, MG132.
Figure 7.
Figure 7.
Cofactor activity of TM. (A) PC activation measured on the surfaces of HUVEC and HUVEC536. (B) HEK293 cells expressing EPCR and TMWT or TM539 were treated (+) or not (−) with 10 mM MβCD for 20 minutes before starting the PC activation protocol, and PC activity was measured. (C) Immunoblot detection of the indicated sTM and their CS-devoid counterparts accumulated in the CM. TMCS+ indicates the position of the CS-modified TM, and Ø indicates the absence of the TM. (D) FIIa-dependent PC activation measured in vitro in the presence of the same amount of the indicated sTM. (E) Immunoblot detection of soluble CS-TM536 and CS-TM514 and their efficacy as cofactors in PC activation. Relative PC activities (mean ± SD) obtained after 30 to 50 minutes of PC substrate conversion are shown. Statistical analyses were performed using unpaired t test. ∗P < .05; ∗∗P < .01; ∗∗∗P < .001. CS-TM, CS-devoid TM; MβCD, methyl-β-cyclodextrin.

References

    1. Loghmani H, Conway EM. Exploring traditional and nontraditional roles for thrombomodulin. Blood. 2018;132(2):148–158. - PubMed
    1. Stearns-Kurosawa DJ, Kurosawa S, Mollica JS, Ferrell GL, Esmon CT. The endothelial cell protein C receptor augments protein C activation by the thrombin-thrombomodulin complex. Proc Natl Acad Sci U S A. 1996;93(19):10212–10216. - PMC - PubMed
    1. Mulder AB, Smit JW, Bom VJ, Blom NR, Halie MR, van der Meer J. Association of endothelial tissue factor and thrombomodulin with caveolae. Blood. 1996;88(9):3667–3670. - PubMed
    1. Chen P-K, Chang B-I, Kuo C-H, et al. Thrombomodulin functions as a plasminogen receptor to modulate angiogenesis. FASEB J. 2013;27(11):4520–4531. - PubMed
    1. Bae J-S, Yang L, Rezaie AR. Receptors of the protein C activation and activated protein C signaling pathways are colocalized in lipid rafts of endothelial cells. Proc Natl Acad Sci U S A. 2007;104(8):2867–2872. - PMC - PubMed

Publication types

MeSH terms