. 2024 Aug 29;20(8):e1012505.
doi: 10.1371/journal.ppat.1012505. eCollection 2024 Aug.

Apobec-mediated retroviral hypermutation in vivo is dependent on mouse strain

Affiliations

Apobec-mediated retroviral hypermutation in vivo is dependent on mouse strain

Hyewon Byun et al. PLoS Pathog. .

Abstract

Replication of the complex retrovirus mouse mammary tumor virus (MMTV) is antagonized by murine Apobec3 (mA3), a member of the Apobec family of cytidine deaminases. We have shown that MMTV-encoded Rem protein inhibits proviral mutagenesis by the Apobec enzyme, activation-induced cytidine deaminase (AID) during viral replication in BALB/c mice. To further study the role of Rem in vivo, we have infected C57BL/6 (B6) mice with a superantigen-independent lymphomagenic strain of MMTV (TBLV-WT) or a mutant strain that is defective in Rem and its cleavage product Rem-CT (TBLV-SD). Compared to BALB/c, B6 mice were more susceptible to TBLV infection and tumorigenesis. Furthermore, unlike MMTV, TBLV induced T-cell tumors in B6 μMT mice, which lack membrane-bound IgM and conventional B-2 cells. At limiting viral doses, loss of Rem expression in TBLV-SD-infected B6 mice accelerated tumorigenesis compared to TBLV-WT in either wild-type B6 or AID-knockout mice. Unlike BALB/c results, high-throughput sequencing indicated that proviral G-to-A or C-to-T mutations were unchanged regardless of Rem expression in B6 tumors. However, knockout of both AID and mA3 reduced G-to-A mutations. Ex vivo stimulation showed higher levels of mA3 relative to AID in B6 compared to BALB/c splenocytes, and effects of agonists differed in the two strains. RNA-Seq revealed increased transcripts related to growth factor and cytokine signaling in TBLV-SD-induced tumors relative to TBLV-WT-induced tumors, consistent with another Rem function. Thus, Rem-mediated effects on tumorigenesis in B6 mice are independent of Apobec-mediated proviral hypermutation.


Conflict of interest statement

The authors have declared that no competing interests exist.

Figures

Fig 1
Fig 1. Diagram of Rem and clonal infectious TBLV proviruses.
(A) Domain organization of Rem and its cleavage products SP and Rem-CT. The arrow indicates the position of Rem cleavage by signal peptidase. (B) Diagram of infectious TBLV-WT and TBLV-SD proviruses and their mRNA transcripts. The relative positions of genes are indicated on the proviral DNA. Both TBLV-WT and TBLV-SD have a T-cell enhancer that consists of a deletion and triplication of sequences flanking the deletion within the LTRs (red bars) compared to MMTV [37,52]. The LTR alteration leads to elimination of Sag expression, which is required for MMTV transmission and mammary tumorigenesis, but allows development of T-cell tumors [39]. The splice donor (SD) and acceptor (SA) sites are indicated on the provirus. TBLV-WT transcripts are shown by black arrows, and introns are designated by V shapes. Red arrows indicate primer positions for production of env-LTR fragments as well as shorter fragments containing LTR enhancer repeats. The TBLV-SD provirus has a mutation (marked by an “X”) in SD site 2 (SD2), which prevents the synthesis of the doubly spliced rem mRNA [83] and sag transcripts from the intragenic promoter. Since TBLV does not have a functional sag open reading frame, TBLV-WT and TBLV-SD differ only by the production of rem mRNA.
Fig 2
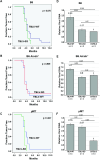
Fig 2. T-cell tumor development after high-dose infection reveals that TBLV infection does not require mature B-2 cells.
(A-C) Wild-type B6, Aicda-/-, or μMT mice (panels A to C, respectively) were injected with TBLV-WT or TBLV-SD (20–22 animals for each virus/strain combination) and followed for tumor development, including enlarged thymus, spleen, and lymph nodes. The results were analyzed by Kaplan-Meier plots. Only μMT mice showed a significant difference between T-cell lymphoma development by TBLV-WT and TBLV-SD at this viral inoculum (p<0.05) as determined by Mantel-Cox log-rank tests. TBLV-SD tumors were accelerated in μMT mice relative to the other two strains, but survival plots did not differ for TBLV-WT among the three strains. (D-F) Proviral loads were assessed in three tumors from each viral strain by semi-quantitative PCR, which allowed quantitation relative to the three diploid copies of endogenous Mtvs in B6 mice (panels D to F, respectively). Proviral load appeared to be lowest in Aicda-/- mice, yet proviral copies did not correlate with tumor latency. In some cases, acquired proviruses (haploid copies) could not be detected above the level of endogenous Mtvs (diploid copies). The relative proviral copy numbers appeared to be highest for TBLV-SD in μMT mice that lack mature B-2 cells.
Fig 3
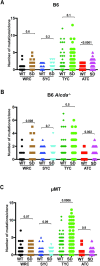
Fig 3. Apobec-associated proviral mutations in tumors induced by high doses of TBLV-WT and TBLV-SD.
Independent cloned sequences were obtained from three tumors in different animals. The number of cytidine mutations within different motifs on either proviral strand is given for each clone. WRC and SYC-motif mutations have been associated with AID expression, whereas TYC and ATC-motif mutations have been linked to mA3 expression. Statistical significance by non-parametric Mann-Whitney tests is indicated on the scatter plots. (A) Comparison of the distribution of mutations within the proviral envelope gene from TBLV-WT or TBLV-SD-induced tumors from wild-type B6 mice. (B) Comparison of the distribution of mutations within the proviral envelope gene in TBLV-WT or TBLV-SD-induced tumors from Aicda-/- mice. (C) Comparison of the distribution of mutations within the proviral envelope gene from TBLV-WT or TBLV-SD-induced tumors from μMT mice lacking mature B cells. Between 50–55 independent clones were analyzed for each virus/strain combination.
Fig 4
Fig 4. Low-dose infections in either wild-type or Aicda-/- B6 mice reveal accelerated tumorigenesis by TBLV in the absence of Rem expression.
(A) Kaplan-Meier plots of tumors induced by the same low dose of TBLV-WT or TBLV-SD in wild-type mice on the B6 background. This dose was 20-fold lower than that used for results shown in Fig 2. (B) Kaplan-Meier plots of tumors induced by the same low dose of TBLV-WT or TBLV-SD in Aicda-/- B6 mice. The p-values were calculated by Mantel-Cox log-rank tests. (C) Sanger sequencing of individual TBLV proviral clones from low-dose tumors in wild-type B6 mice. Differences in the distribution of cytidine mutations within the envelope gene of cloned proviruses (~25 clones from three different tumors) were compared for WRC, SYC, TYC, and ATC motifs using scatter plots. The p-values were calculated by non-parametric Mann-Whitney tests. The most prevalent mutations were in the TYC motif typical of mA3. (D) Sanger sequencing of individual TBLV proviral clones from low-dose tumors in Aicda-/- B6 mice. Comparisons were performed as described in panel C.
Fig 5
Fig 5. High-throughput sequencing of proviruses from B6 tumors induced by infections of TBLV-WT and TBLV-SD.
(A) MiSeq sequencing of the env-LTR proviral junction fragments obtained by PCR using DNA from TBLV-WT or TBLV-SD-induced thymic lymphomas of infected wild-type (dark orange and light orange, respectively) or AID (Aicda)-knockout mice (dark blue and light blue, respectively). Tumors were obtained after high-dose injections. Each bar represents results from three independent tumors. The average number of mutations above a 3% threshold are plotted for each position relative to the cloned TBLV sequence. Pairwise comparisons between groups showed no statistical differences. (B) Nanopore sequencing of the env-LTR proviral junction fragments obtained by PCR using DNA from the env-LTR proviral junction fragments obtained by PCR using DNA from TBLV-WT or TBLV-SD-induced thymic lymphomas of infected wild-type (dark orange and light orange, respectively), AID-knockout mice (dark blue and light blue, respectively) or mA3-AID (Aicda) double-knockout mice (dark green and light green, respectively). Each bar represents results from three independent tumors obtained after low-dose injections. Statistical differences between virus/strain combinations are shown as *p<0.05, **p<0.01, or ***p<0.001. (C) Nanopore sequencing of the PCR products derived from virion RNA extracted from low-dose TBLV-WT or SD-induced thymic lymphomas. The numbers of mutations in virion RNAs extracted from each tumor were given separately due to the wide variation in the values observed. The color scheme is the same as in panel A. The mutational variability observed among the triplicate samples prevented statistical analysis.
Fig 6
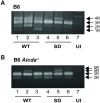
Fig 6. LTR enhancer repeats within TBLV proviruses obtained from low-dose tumors induced in wild-type and Aicda-/- mice.
(A) Analysis of LTR enhancer repeats in tumors induced by TBLV-WT (WT) and TBLV-SD (SD) in wild-type B6 mice. PCRs were performed on three tumors from each viral strain prior to agarose gel electrophoresis. The positions of LTRs containing 1 (1R), 2 (2R), 3 (3R), 4 (4R), or 5 (5R) copies of the 62-bp sequence in the TBLV enhancer [53] are indicated. The infectious TBLV-WT and TBLV-SD clones both have a 3R enhancer [39]. (B) Analysis of LTR enhancer repeats in tumors induced by TBLV-WT and TBLV-SD in Aicda-/- mice on the B6 background. UI = DNA from uninfected mice. Faint background bands are observed in DNA from uninfected mice, presumably due to homology of the primers to the endogenous Mtvs.
Fig 7
Fig 7. Expression of mAID and mA3 differs in B6 and BALB/c splenocytes after external ligand stimulation.
(A) Splenocyte responses to IL-4 plus LPS. Splenocytes from uninfected BALB/c or B6 mice were used for whole cell lysate preparation prior to culture with IL-4 plus LPS for 4 h (lanes 2 and 7), 18 h (lanes 3 and 8), 48 h (lanes 4 and 9), or 96 h (lanes 5 and 10). Uncultured splenocyte lysates (NS = non-stimulated) are shown in lanes 1 and 6. Lysates were used for Western blotting and incubation with antibodies specific for mA3 (top), murine AID (mAID) (middle) or Gapdh (bottom). Note that BALB/c mice express two isoforms of mA3 mRNA (with and without exon 5), whereas B6 express predominantly the isoform without exon 5 [54,72]. (B) Quantitation of mA3 levels after stimulation with IL-4 and LPS in three independent experiments. Each experiment (shown with dots of different colors) represents pooled splenocytes from 5 animals. Means are shown by horizontal lines, whereas standard deviations are shown by vertical bars in one direction. (C) Splenocyte responses to Concanavalin A (ConA). Splenocytes from uninfected BALB/c or B6 mice were used for whole cell lysate preparation prior to culture with ConA for 4 h (lanes 2 and 7), 18 h (lanes 3 and 8), 48 h (lanes 4 and 9), or 96 h (lanes 5 and 10). Uncultured splenocyte lysates are shown in lanes 1 and 6. Lysates were used for Western blotting and incubation with antibodies specific for mA3 (top) or Gapdh (bottom). (D) Quantitation of mA3 levels after stimulation with ConA in three independent experiments. Each experiment (shown with dots of different colors) represents pooled splenocytes from 5 animals. Means are shown by horizontal lines, whereas standard deviations are shown by vertical bars in one direction. (E) Treatment with IFNβ gives similar signaling responses in BALB/c and B6 splenocytes. Lysates from splenocytes treated with or without 1000 U/ml IFNβ for 5 h were used for Western blotting with antibodies specific for phosphorylated Stat1 (p-Stat1) or Gapdh. Two bands observed with p-Stat1 antibody correspond to phosphorylated Stat1α and Stat1β isoforms and are expressed similarly in BALB/c and B6 mice.
Fig 8
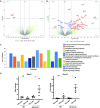
Fig 8. RNA-seq analysis indicates increased immune-related transcripts in the absence of Rem and AID expression.
(A) Volcano plot comparing different transcripts from TBLV-WT and TBLV-SD-infected tumors from B6 mice. The false discovery rate (FDR) (-log10) was plotted versus the log2-fold change (FC) in mRNA abundance. Blue dots indicate transcripts that were significantly different in TBLV-SD-induced tumors. Red dots indicate transcripts that were significantly different in TBLV-SD-induced tumors and were changed more than 2-fold. Non-significant differences are shown by gray dots. The identities of some transcripts are provided. (B) Volcano plot comparing different transcripts from TBLV-WT and TBLV-SD-infected tumors from B6 Aicda-/- mice. (C) PANTHER analysis of differentially expressed genes in tumors induced by TBLV-SD relative to TBLV-WT. (D) Validation of Stat1 and Socs3 mRNAs expressed in wild-type and AID-deficient B6 mice in tumors induced by TBLV-WT and TBLV-SD (4 tumors each). Each symbol represents RNA from a single tumor. Mean and range of values obtained by RT-qPCR are shown. NS = non-significant.

Update of

References

    1. Temin HM. THE PARTICIPATION OF DNA IN ROUS SARCOMA VIRUS PRODUCTION. Virology. 1964;23: 486–494. doi: 10.1016/0042-6822(64)90232-6 - DOI - PubMed
    1. Harris RS, Dudley JP. APOBECs and virus restriction. Virology. 2015;479–480: 131–145. doi: 10.1016/j.virol.2015.03.012 - DOI - PMC - PubMed
    1. Strebel K. HIV accessory proteins versus host restriction factors. Curr Opin Virol. 2013;3: 692–699. doi: 10.1016/j.coviro.2013.08.004 - DOI - PMC - PubMed
    1. Xu WK, Byun H, Dudley JP. The Role of APOBECs in Viral Replication. Microorganisms. 2020;8. doi: 10.3390/microorganisms8121899 - DOI - PMC - PubMed
    1. Dudley JP. APOBECs: Our fickle friends? PLOS Pathogens. 2023;19: e1011364. doi: 10.1371/journal.ppat.1011364 - DOI - PMC - PubMed

MeSH terms

Substances

LinkOut - more resources