. 2024 Sep 17;5(9):101700.
doi: 10.1016/j.xcrm.2024.101700. Epub 2024 Aug 28.

Gemcitabine therapeutically disrupts essential SIRT1-mediated p53 repression in atypical teratoid/rhabdoid tumors

Affiliations

Gemcitabine therapeutically disrupts essential SIRT1-mediated p53 repression in atypical teratoid/rhabdoid tumors

Dennis S Metselaar et al. Cell Rep Med. .

Abstract

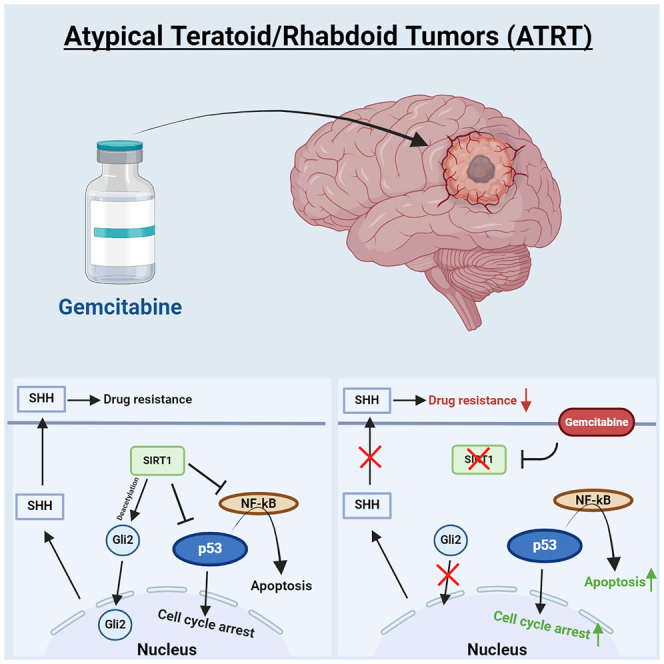
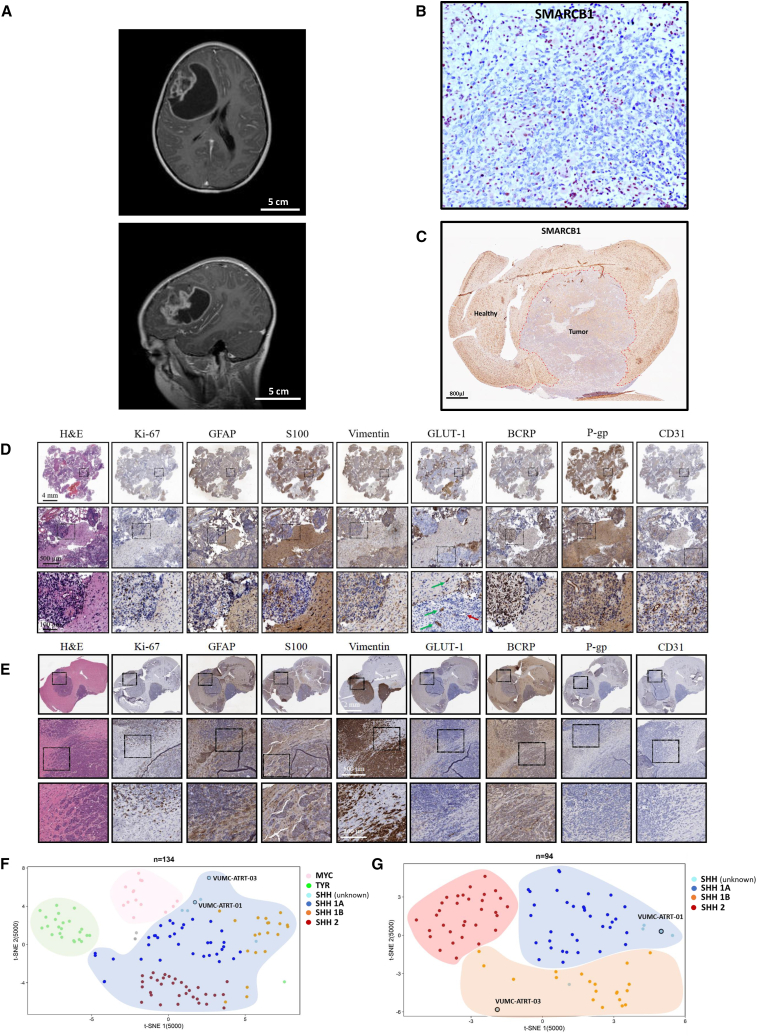
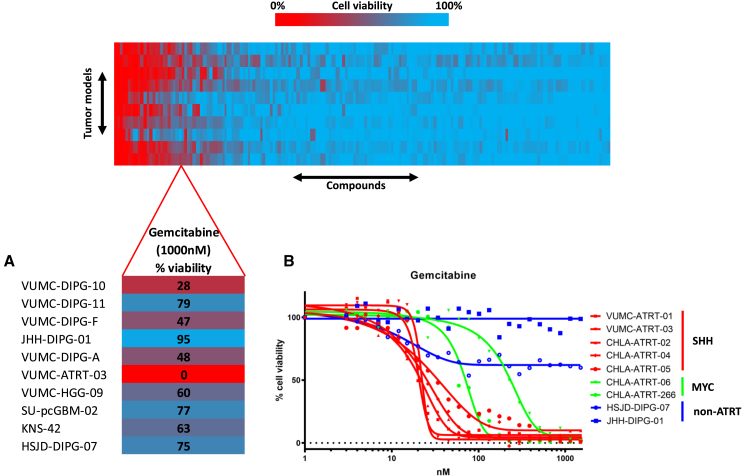
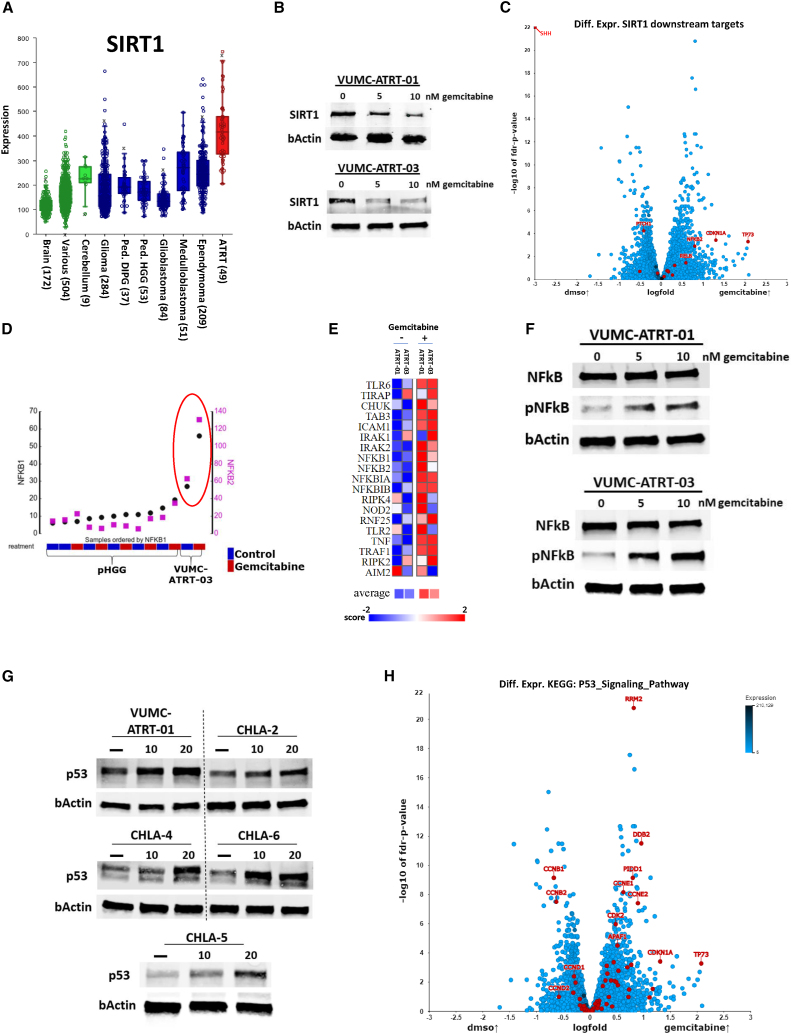
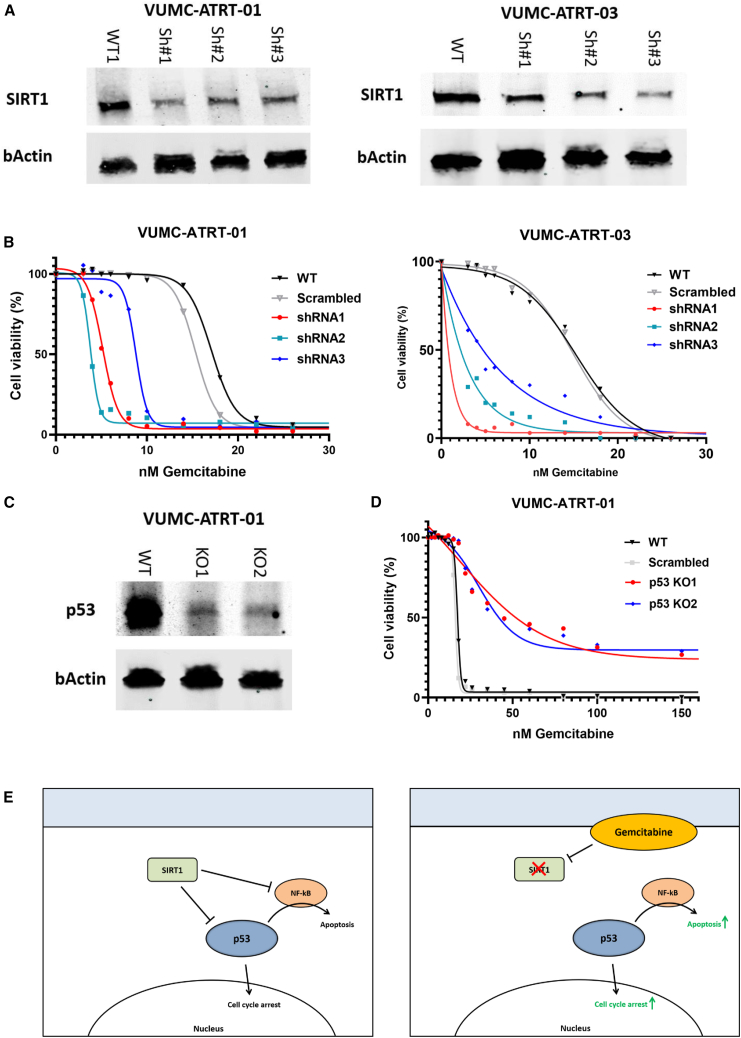
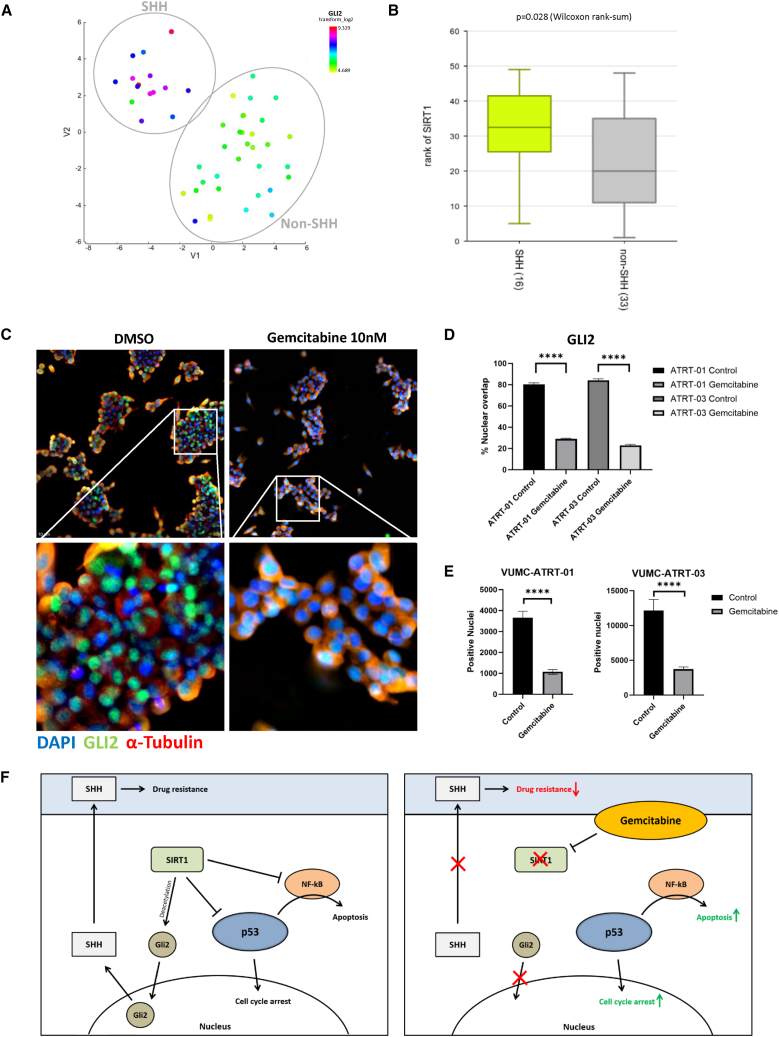
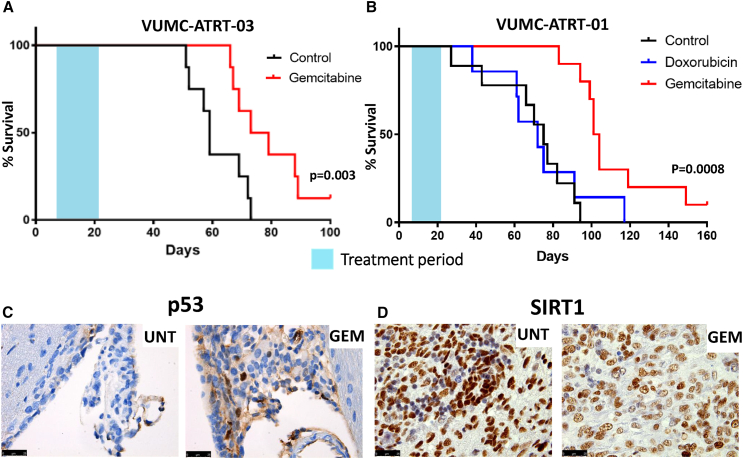
Atypical teratoid/rhabdoid tumors (ATRTs) are highly malignant embryonal tumors of the central nervous system with a dismal prognosis. Using a newly developed and validated patient-derived ATRT culture and xenograft model, alongside a panel of primary ATRT models, we found that ATRTs are selectively sensitive to the nucleoside analog gemcitabine. Gene expression and protein analyses indicate that gemcitabine treatment causes the degradation of sirtuin 1 (SIRT1), resulting in cell death through activation of nuclear factor κB (NF-κB) and p53. Furthermore, we discovered that gemcitabine-induced loss of SIRT1 results in a nucleus-to-cytoplasm translocation of the sonic hedgehog (SHH) signaling activator GLI2, explaining the observed additional gemcitabine sensitivity in SHH-subtype ATRT. Treatment of ATRT xenograft-bearing mice with gemcitabine resulted in a >30% increase in median survival and yielded long-term survivors in two independent patient-derived xenograft models. These findings demonstrate that ATRTs are highly sensitive to gemcitabine treatment and may form part of a future multimodal treatment strategy for ATRTs.

Keywords: ATRT; atypical teratoid/rhabdoid tumor; gemcitabine; neuro oncology; p53; patient-derived models; pediatric oncology; sirtuin 1; therapy development.


Conflict of interest statement

Declaration of interests The authors declare no competing interests.

Figures

None
Graphical abstract
Figure 1
Figure 1
Establishment of a novel patient-derived SHH-ATRT culture and xenograft model (A) Diagnostic T2-weighted MRI of the patient from which VUMC-ATRT-03 was derived (top, coronal plane; bottom, sagittal plane). (B) Immunohistochemistry of patient-derived resection material depicting SMARCB1 expression in brown, revealing typical loss of nuclear SMARCB1 exclusively in tumor cells. The positive nuclei of non-neoplastic and microvascular cells serve as a positive internal control. (C) Immunohistochemistry for SMARCB1 in a mouse brain carrying a VUMC-ATRT-03 xenograft confirming the absence of SMARCB1 in the nuclei of tumor cells. (D) Panel of immunohistochemical images depicting ATRT hallmarks in patient-derived resection material (high proliferation: Ki-67; patches of multilineage differentiation: GFAP, S100, vimentin, and keratin; loss of BBB integrity: GLUT-1, BCRP, P-gp, and CD31). Loss of GLUT1 (indicated by the red arrow) indicates intratumor vascular malformations and loss of BBB integrity. (E) Panel of immunohistochemical images depicting ATRT hallmarks in a mouse brain carrying VUMC-ATRT-03 xenografts (high proliferation: Ki-67; patches of multilineage differentiation: GFAP, S100, vimentin, and keratin; loss of BBB integrity: GLUT-1, BCRP, P-gp, and CD31). (F) Unsupervised t-distributed stochastic neighbor embedding (t-SNE) clustering of DNA methylation profiles of 134 ATRT samples. Cases are annotated based on previously described subgrouping analysis. VUMC-ATRT-01 and VUMC-ATRT-03 methylation profiles annotate to the SHH cluster. (G) Unsupervised t-SNE clustering of DNA methylation profiles of 94 SHH-ATRT samples. Here, VUMC-ATRT-01 clusters with the SHH-A1 group and the VUMC-ATRT-03 with the SHH-1B group.
Figure 2
Figure 2
Epigenetic compound screening identifies gemcitabine as an effective therapeutic in ATRT (A) Compound library screen cell viability readout in a panel of primary pediatric CNS tumor models. Lower: the gemcitabine-treated cell viability readout is highlighted, revealing that the only ATRT model among the panel shows a complete loss of viability upon gemcitabine treatment (1,000 nM, 96 h). (B) Cell viability IC50 curves of gemcitabine treatment in a panel of seven primary ATRT culture models; two pediatric high-grade glioma (HGG) cell cultures are used as controls. SHH-subtype ATRT models show higher gemcitabine sensitivity compared to an MYC-subtype ATRT model, while controls show no sensitivity.
Figure 3
Figure 3
ATRT-specific SIRT1 upregulation suppresses NF-κB and p53 activity, which can be reversed through gemcitabine treatment (A) mRNA expression levels of SIRT1 in normal brain, cerebellum, and various tissues (in green, GSE: 11882, GSE: 3526, GSE: 7307) compared to adult and pediatric CNS tumor tissues (in blue, GSE: 7696, GSE: 16011, GSE: 26576, GSE: 19578, GSE: 74195, GSE: 64415) and ATRT tissues (in red, GSE: 70678). (B) Western blot analysis depicting SIRT1 expression in VUMC-ATRT-01 and VUMC-ATRT-03 cells after gemcitabine treatment (0, 5, and 10 nM) for 24 h. (C) Volcano plot depicting −log10 false discovery rate (FDR)-corrected p value of differential expressed genes between DMSO (n = 6) and gemcitabine-treated (n = 6) ATRT cell cultures VUMC-ATRT-01, VUMC-ATRT-03, CHLA-02, CHLA-05, CHLA-06, and CHLA-266. Downstream targets of SIRT1 (SHH, PTCH1, TP73, CDKN1A, NFKB2, RELB, RELA, NFKB1, FOXO3, TP53, E2F1, XRCC6, FOXO1, PPARG, LXR, and PPARGC1A) are marked in red. (D) Untreated (blue) vs. gemcitabine (red)-treated mRNA expression of NFKB1 (black) and NFKB2 (magenta) in VUMC-ATRT-03 and a panel of pediatric HGG models. (E) Heatmap representation illustrating mRNA expression of the KEGG NF-κB gene set in VUMC-ATRT-01 and VUMC-ATRT-03 cells before and after gemcitabine treatment (PAGE FDR p < 0.05). (F) Western blot analysis depicting p65-NF-κB and phospho-p65-NF-κB (pNF-κB) expression in VUMC-ATRT-01 and VUMC-ATRT-03 cells after gemcitabine treatment (0, 5, and 10 nM) for 24 h. (G) Western blot analysis depicting p53 expression in VUMC-ATRT-01, VUMC-ATRT-03, CHLA-ATRT-02, CHLA-ATRT-04, CHLA-ATRT-05, and CHLA-ATRT-06 cells after gemcitabine treatment (0, 10, and 20 nM) for 24 h. (H) Volcano plot depicting −log10 FDR-corrected p value of differential expressed genes between DMSO (n = 6) and gemcitabine-treated (n = 6) ATRT cell cultures VUMC-ATRT-01, VUMC-ATRT-03, CHLA-02, CHLA-05, CHLA-06, and CHLA-266. All 69 genes of the “KEGG p53_signaling_pathway” are highlighted in red.
Figure 4
Figure 4
Gemcitabine treatment induces p53-mediated cell death, through SIRT1 depletion in ATRT (A) Western blot analysis depicting SIRT1 expression in VUMC-ATRT-01 and VUMC-ATRT-03 cells transduced with a variety of SIRT1 shRNA (Sh#1, 2, and 3) or a control construct (wild type [WT]). (B) IC50 viability curves of VUMC-ATRT-01 and VUMC-ATRT-03 cells transduced with control (scrambled) or one of three SIRT1 shRNA treated with different gemcitabine concentrations for 96 h. (C) Western blot analysis depicting p53 expression in VUMC-ATRT-01 WT and p53 knockout cells (KO1 and KO2), as established through CRISPR-Cas9. (D) IC50 viability curves of CRISPR-Cas9-modified VUMC-ATRT-01 WT, scrambled, and p53 knockout cells, treated with different gemcitabine concentration for 96 h. (E) Illustration of the proposed mechanism through which gemcitabine causes tumor toxicity in ATRT.
Figure 5
Figure 5
Gemcitabine deactivates SHH signaling in SHH-ATRTs through loss of SIRT1, increasing SHH-ATRT-specific drug sensitivity (A) t-SNE clustering of 49 individual tumor samples of patients with ATRT (dataset GSE: 70678) based on overall mRNA expression profiles (perplexity: 12). SHH subgroup is shown as a distinct group from other ATRT samples in upper-left corner as confirmed by overall high GLI2 expression (blue to red) versus low GLI2 expression in the non-SHH ATRT (yellow to green). (B) mRNA expression levels of SIRT1 in SHH ATRT (n = 16) versus non-SHH ATRT (n = 33) (Wilcoxon rank-sum: p = 0.028). (C) Immunofluorescent stainings of GLI2 (green), α-tubulin (red), and DAPI (blue) in VUMC-ATRT-03 cells treated with 20 nM gemcitabine for 24 h show the loss of nuclear localization of GLI2. Upper: an average depiction of all wells. Lower: zoomed depictions of the indicated area in the upper panels. (D) Quantification of percentage nuclear (DAPI) overlap with GLI2 between DMSO and gemcitabine-treated VUMC-ATRT-01 (n = 20) and VUMC-ATRT-03 cells (n = 20) (one-way ANOVA: ∗∗∗∗p < 0.0001). (E and F) Quantification of total GLI2-positive nuclei per well between DMSO and gemcitabine-treated VUMC-ATRT-01 (n = 20) and VUMC-ATRT-03 cells (n = 20) (one-way ANOVA: ∗∗∗∗p < 0.0001). (F) Illustration of the proposed mechanism through which gemcitabine causes tumor toxicity in ATRT, including the mechanisms that cause extra sensitivity in SHH-subgroup ATRT.
Figure 6
Figure 6
Gemcitabine treatment reveals prolonged survival in two SHH-ATRT xenograft models (A) Survival analysis of VUMC-ATRT-03 orthotopic xenograft-bearing mice treated with vehicle (black line, n = 8) and gemcitabine (red line, n = 8). The gemcitabine-treated group shows significant survival benefit over vehicle-treated mice (p = 0.003, log rank test). (B) Survival analysis of VUMC-ATRT-01 orthotopic xenograft-bearing mice treated with vehicle (black line, n = 9), doxorubicin (blue line, n = 7), and gemcitabine (red line, n = 10). The gemcitabine-treated group shows significant benefit over vehicle and doxorubicin-treated mice (p = 0.0008, log rank test). (C) p53 immunohistochemical staining (in brown) in VUM-ATRT-01 xenograft patches, isolated at final day of treatment. Gemcitabine-treated mice show a higher ratio of p53-positive nuclei in their tumors compared to vehicle-treated animals. (D) SIRT1 immunohistochemical staining (in brown) in VUM-ATRT-01 xenograft patches, isolated at final day of treatment. Gemcitabine-treated mice show lower SIRT1 expression compared to vehicle-treated animals.

References

    1. Reddy A.T., Strother D.R., Judkins A.R., Burger P.C., Pollack I.F., Krailo M.D., Buxton A.B., Williams-Hughes C., Fouladi M., Mahajan A., et al. Efficacy of High-Dose Chemotherapy and Three-Dimensional Conformal Radiation for Atypical Teratoid/Rhabdoid Tumor: A Report From the Children's Oncology Group Trial ACNS0333. J. Clin. Oncol. 2020;38:1175–1185. doi: 10.1200/jco.19.01776. - DOI - PMC - PubMed
    1. Chi S.N., Zimmerman M.A., Yao X., Cohen K.J., Burger P., Biegel J.A., Rorke-Adams L.B., Fisher M.J., Janss A., Mazewski C., et al. Intensive multimodality treatment for children with newly diagnosed CNS atypical teratoid rhabdoid tumor. J. Clin. Oncol. 2009;27:385–389. doi: 10.1200/jco.2008.18.7724. - DOI - PMC - PubMed
    1. Ginn K.F., Gajjar A. Atypical teratoid rhabdoid tumor: current therapy and future directions. Front. Oncol. 2012;2:114. doi: 10.3389/fonc.2012.00114. - DOI - PMC - PubMed
    1. Slavc I., Chocholous M., Leiss U., Haberler C., Peyrl A., Azizi A.A., Dieckmann K., Woehrer A., Peters C., Widhalm G., et al. Atypical teratoid rhabdoid tumor: improved long-term survival with an intensive multimodal therapy and delayed radiotherapy. The Medical University of Vienna Experience 1992-2012. Cancer Med. 2014;3:91–100. doi: 10.1002/cam4.161. - DOI - PMC - PubMed
    1. Frühwald M.C., Hasselblatt M., Nemes K., Bens S., Steinbügl M., Johann P.D., Kerl K., Hauser P., Quiroga E., Solano-Paez P., et al. Age and DNA methylation subgroup as potential independent risk factors for treatment stratification in children with atypical teratoid/rhabdoid tumors. Neuro Oncol. 2020;22:1006–1017. doi: 10.1093/neuonc/noz244. - DOI - PMC - PubMed

MeSH terms

Supplementary concepts