. 2024 Sep 17;5(9):101699.
doi: 10.1016/j.xcrm.2024.101699. Epub 2024 Aug 28.

Proteo-metabolomics and patient tumor slice experiments point to amino acid centrality for rewired mitochondria in fibrolamellar carcinoma

Affiliations

Proteo-metabolomics and patient tumor slice experiments point to amino acid centrality for rewired mitochondria in fibrolamellar carcinoma

Donald Long Jr et al. Cell Rep Med. .

Abstract

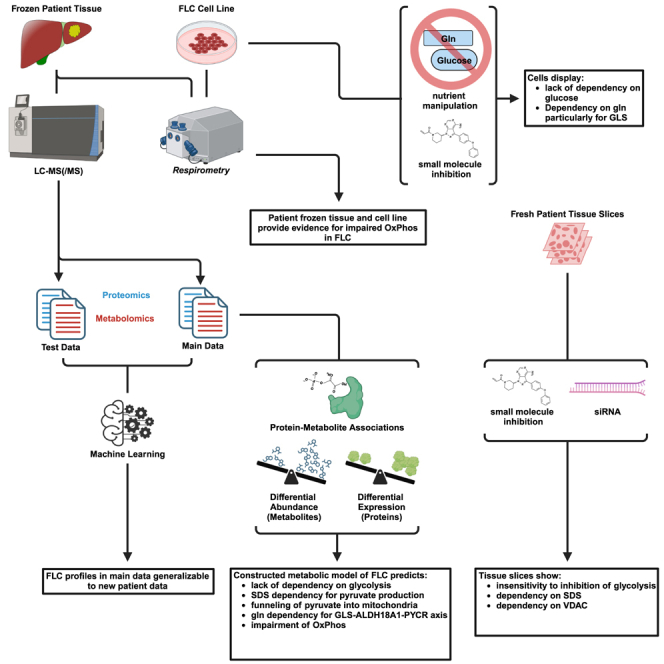
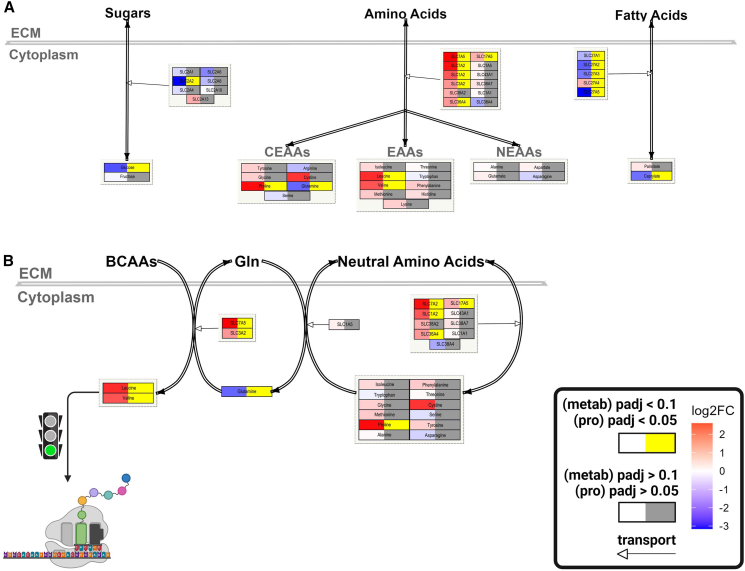
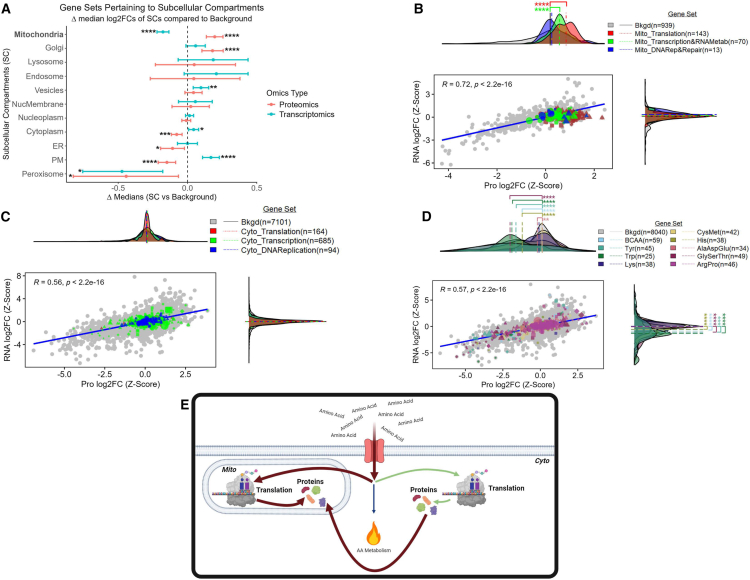
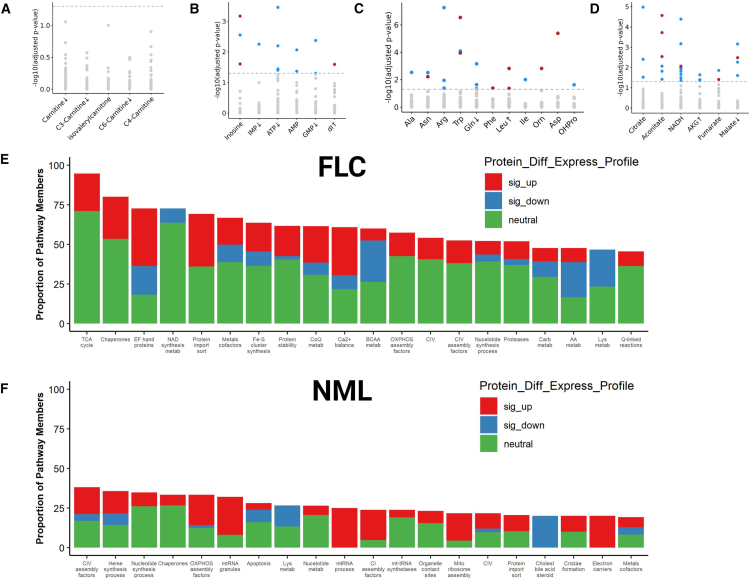
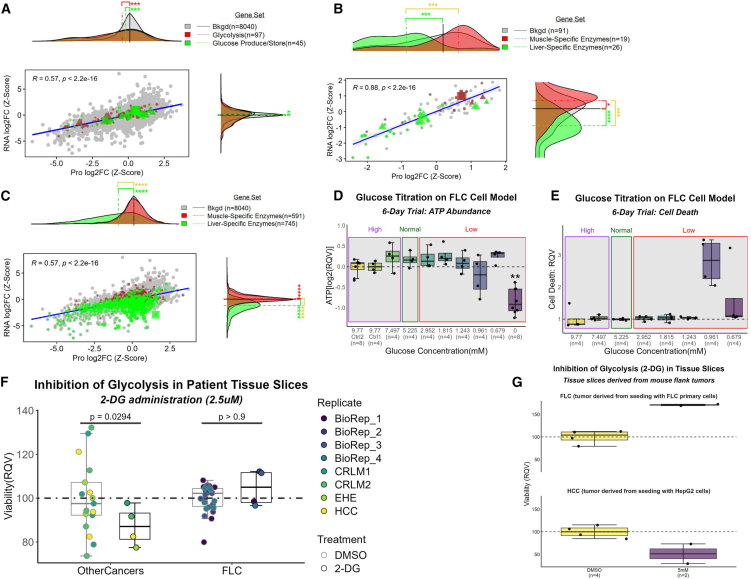
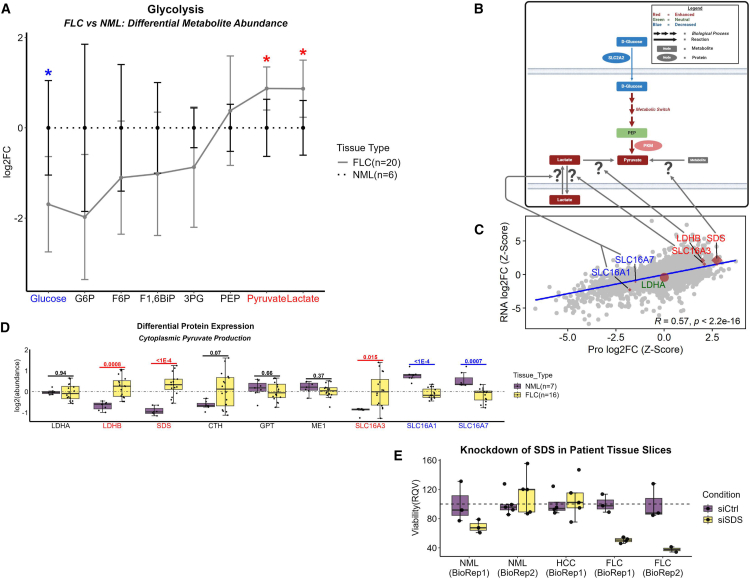
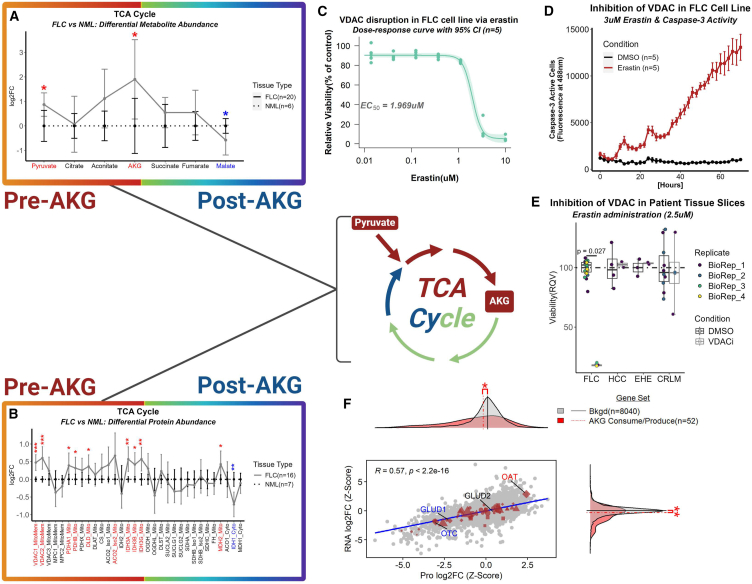
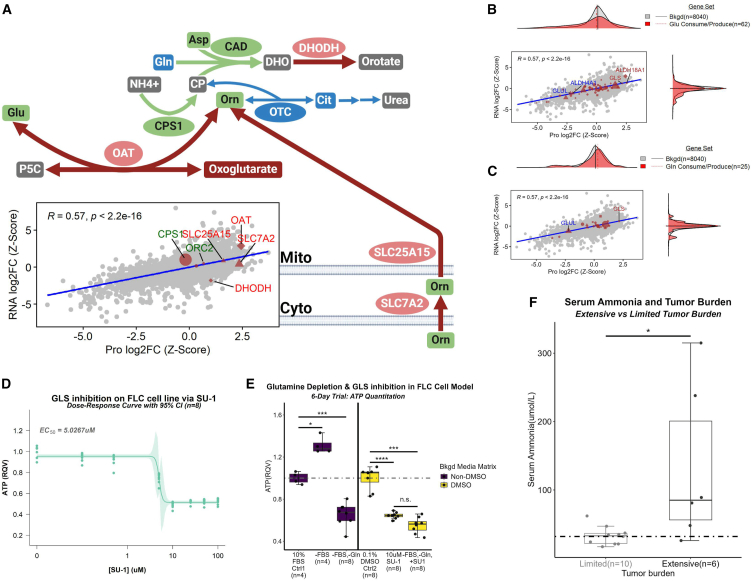
Fibrolamellar carcinoma (FLC) is a rare, lethal, early-onset liver cancer with a critical need for new therapeutics. The primary driver in FLC is the fusion oncoprotein, DNAJ-PKAc, which remains challenging to target therapeutically. It is critical, therefore, to expand understanding of the FLC molecular landscape to identify druggable pathways/targets. Here, we perform the most comprehensive integrative proteo-metabolomic analysis of FLC. We also conduct nutrient manipulation, respirometry analyses, as well as key loss-of-function assays in FLC tumor tissue slices from patients. We propose a model of cellular energetics in FLC pointing to proline anabolism being mediated by ornithine aminotransferase hyperactivity and ornithine transcarbamylase hypoactivity with serine and glutamine catabolism fueling the process. We highlight FLC's potential dependency on voltage-dependent anion channel (VDAC), a mitochondrial gatekeeper for anions including pyruvate. The metabolic rewiring in FLC that we propose in our model, with an emphasis on mitochondria, can be exploited for therapeutic vulnerabilities.

Keywords: alpha-ketoglutarate; fibrolamellar carcinoma; glucose; glutamine; metabolomics; mitochondria; proline; proteomics; pyruvate; serine.


Conflict of interest statement

Declaration of interests The authors declare no competing interests.

Figures

None
Graphical abstract
Figure 1
Figure 1
Amino acid transport may be favored in FLC and diverted into translation (A) Descriptive model embedded with omics data depicting transport of sugars, amino acids, and fatty acids in FLC. Proteomics data—n = 23 samples; metabolomics data—n = 26 samples. (B) Descriptive model depicting the potential relationship between amino acid transport and protein translation in FLC. (A and B) Left side of each node—gradient red is increasing log2FC (FLC vs. NML) and gradient blue is decreasing log2FC; Right side of each node—gray is not significant and yellow is significant (proteins—FDR-adj p < 0.05; metabolites—FDR-adj p < 0.1); nodes associated with edges that have open arrowheads, proteins; double-line edges, transport; nodes associated with double-line edges, metabolites; SLC, solute carrier; CEAAs, conditionally essential amino acids; EAAs, essential amino acids; NEAAs, non-essential amino acids; BCAAs, branched-chain amino acids; ECM, extracellular matrix; green traffic light, stimulation.
Figure 2
Figure 2
Enhanced transcription and translation of mitochondrial genes (A) Dot plot where each dot represents the difference (x axis) between the median log2FC (FLC vs. NML) of the background set and a gene set that represents a subcellular compartment (y axis). Error bars represent 95% confidence intervals. (B–D) Comparison of log2FCs (FLC vs. NML; z-scaled) at the protein (x axis) and RNA (y axis) level. Density plots represent the distribution of the log2FCs associated with proteins (x axis) and transcripts (y axis). (E) Descriptive model of amino acid utilization in FLC. Gene sets were identified as members of (A) subcellular compartments, (B) the mitochondrial central dogma, (C) the cytoplasmic central dogma, and (D) amino acid metabolism. Background sets (bkgd) are (A and D) all genes identified in both the transcriptomic and proteomic datasets, (B) all genes related to the mitochondrion, and (C) all genes not related to the mitochondrion. (B–D) Lines associated with density plots represent the median. (A–C) MitoCarta3.0 and (A, C, and D) Protein Atlas were used to identify gene sets. (A–D) Gene sets (transcriptomic—n = 27 samples, proteomics—n = 23 samples) were compared to bkgd using Mann-Whitney (∗FDR-adj p < 0.05; ∗∗FDR-adj p < 0.01; ∗∗∗FDR-adj p < 0.001; ∗∗∗∗FDR-adj p < 0.0001). (B–D) For gene sets (excluding bkgd)—circles, genes with no significant log2FCs at either RNA or protein level; diamonds, genes with significant log2FCs at both the RNA and protein level; triangles, genes with significant log2FCs at the protein level only; squares, genes with significant log2FCs at the RNA level only; shape size, average expression values (from transcriptomic data). (A–D) Cyto, cytosol; Mito, mitochondria; DNARep&Repair, DNA replication and repair; BCAA, branched-chain amino acids; ER, endoplasmic reticulum; Lyso, lysosome; NucMem, nuclear membrane; Nucplasm, nucleoplasm; PM, plasma membrane; Perox, peroxisome.
Figure 3
Figure 3
Proteo-transcriptomic signature of mitochondrial respiration suggests an enhanced TCA cycle (A–F) Concordance analysis in FLC patient tissue (n = 17 omics-matched sample pairs, 13 of which are FLC) between protein expression of (A–D) mitochondrial small-molecule transporters (data points) and metabolites (x axis labels) composed of (A) FA/carnitine conjugates, (B) nucleotides, (C) amino acids, and (D) TCA cycle intermediates. (A–D) Highlighted data points denote protein-metabolite pairs that are significantly (−log10(FDR-adj p) > 1.3) concordant (red) or discordant (blue) in FLC. Arrows adjacent to labels denote direction of significant alterations in the abundance of metabolites (x axis labels; FDR-adj p < 0.1) in FLC compared to NML. Gray data points indicate protein-metabolite pairs that were not statistically significant in concordance or discordance. Level of agreement between mitochondrial content (measured by Mitochondria Deep Tracker Red Fluorescent Intensity—MTDR F.I.) and protein abundance of all genes related to the mitochondria in (E) FLC (nmatchedpairs = 3; nrandompairs = 3) and (F) NML (nmatchedpairs = 4; nrandompairs = 2). Bars represent the top twenty mitochondrial pathways (x axis) with the highest percentage (y axis) of protein members whose abundance (proteomics) was significantly associated with mitochondrial content in (E) FLC and (F) NML. (E and F) Colors correspond to percentage of protein members that are significantly upregulated (sig_up, red), significantly downregulated (sig_down, blue), or unchanged (neutral, green) in FLC compared to NML. Protein_Diff_Express_Profile, protein differential expression profile; sig_up, significantly up; sig_down, significantly down; Carb, carbohydrate; BCAA, branched-chain amino acids; AA, amino acids; metab, metabolism; Cholest, cholesterol. (E and F) MitoCarta3.0 was used to identify gene sets.
Figure 4
Figure 4
Suggestive decoupling of glycolysis from pyruvate production (A–C) Comparison of log2FCs (FLC vs. NML; z-scaled) at the protein (n = 23 samples) and RNA (n = 27 samples) level. Gene sets were identified that (a) participate in glycolysis as well as glucose production/storage and have (B and C) tissue specificity to liver or muscle. Background set (bkgd) is (B) all genes that participate in glycolysis and (A and C) all genes identified in both omics’ datasets. (A–C) Protein Atlas database was used to identify gene sets. Six-day glucose titration assay on FLC cell line measuring (D) ATP abundance (n = 8 samples for Ctrl 2 and zero concentration; n = 4 samples each for remaining concentrations) and (E) cell death (n = 4 samples per concentration). (D–G) High, Normal, and Low indicate glucose concentrations above, within, and below normal physiological range, respectively. Inhibition of glycolysis via 2-deoxyglucose (2-DG) on fresh tissue slices from (F) patients afflicted with FLC (n = 4 biological replicates) or other cancers and (G) NOD scid gamma (NSG) mouse flank tumors seeded by either HepG2 or FLC primary cells. (F) BioRep, biological replicate; DMSO, control condition; CRLM, colorectal liver metastases; EHE, epithelioid hemangioendothelioma; HCC, hepatocellular carcinoma. (D–F) RQV, relative quantitative value. Mann-Whitney used for statistical assessment of (A–C) (∗FDR-adj p < 0.05; ∗∗FDR-adj p < 0.01; ∗∗∗FDR-adj p < 0.001; ∗∗∗∗FDR-adj p < 0.0001). (A–C) For gene sets (excluding bkgd), circles, genes with no significant log2FCs at either RNA or protein level; diamonds, genes with significant log2FCs at both the RNA and protein level; triangles, genes with significant log2FCs at the protein level only; squares, genes with significant log2FCs at the RNA level only; shape size, average expression values (from transcriptomic data).
Figure 5
Figure 5
Serine may be a major contributor to pyruvate generation for the TCA cycle (A) Line plot of metabolomic data mapping metabolites along the trajectory of glycolysis in FLC (solid line; n = 20 samples) compared to NML (dashed line; n = 6 samples). Colored labels denote metabolites that are significantly depleted (blue) or enriched (red) in FLC. Data points and error bars represent mean abundance and standard deviation, respectively; ∗ FDR-adj p value < 0.1. (B and C) Schematic that depicts inputs to pyruvate production. Excluding gray arrows, arrow size is directly associated with arrow color. Node size is arbitrary. Question marks refer to (C) genes that are suspected to be involved in contributing to the pyruvate pool. Background (bkgd; gray data points) is all genes identified in both omics’ datasets (transcriptomics—n = 27 samples; proteomics—n = 23 samples). (D) Protein abundance profile of suspected contributors to pyruvate pool in FLC (n = 16 samples) compared to NML (n = 7 samples). (E) Knockdown of SDS in fresh tissue slices derived from non-malignant liver tissue (n = 2 biological replicates) and tumors of patients afflicted with FLC (n = 2 biological replicates) or HCC (n = 1 biological replicate). HCC, hepatocellular carcinoma; BioRep, biological replicate. (C) For the highlighted genes, circles, genes with no significant log2FCs at either RNA or protein level; diamonds, genes with significant log2FCs at both the RNA and protein level; triangles, genes with significant log2FCs at the protein level only; squares, genes with significant log2FCs at the RNA level only; shape size, average expression values (from transcriptomic data). Coloration of labels correspond to genes with a significant increase (red) or decrease (blue) in log2FC at least at the protein level. A green label indicates no significant alteration at the protein level.
Figure 6
Figure 6
Rewiring of the TCA cycle is associated with bottleneck of AKG in FLC (A and B) Line plot of (A) metabolomic and (B) proteomic data mapping the trajectory of the TCA cycle in FLC (solid line; proteomics—n = 16 samples; metabolomics—n = 20 samples) compared to NML (dashed line; proteomics—n = 7 samples; metabolomics—n = 6 samples). Colored labels denote (A) metabolites and (B) proteins that are significantly decreased (blue) or increased (red) in abundance in FLC compared to NML. Data points and error bars represent log2FC and standard deviation, respectively—(A) ∗FDR-adj p value < 0.1 and (B) ∗FDR-adj p value < 0.05; ∗∗FDR-adj p value < 0.01; ∗∗∗FDR-adj p value < 0.001. (C) Dose-response curve measuring viability of FLC cell line (n = 5) with administration of erastin. EC50 = 1.969 μM; control, DMSO. Light-shaded green area around curve represents 95% confidence interval. (D) Caspase-3 activity in FLC cell line incubated with 3 μM of either DMSO (ctrl; n = 5) or erastin (n = 5) for 72 h. All time points were significant after 8 h. Wilcox used for statistical analysis. Data points and error bars represent mean fluorescent intensity and standard deviation, respectively. (E) Inhibition of VDAC via erastin (six-day trial) on fresh tissue slices from patients afflicted with FLC (n = 4 biological replicates) and other liver tumors (n = 1 biological replicate for each tumor type with the exception of CRLM in which n = 2 biological replicates). EHE, epithelioid hemangioendothelioma; HCC, hepatocellular carcinoma; CRLMs, colorectal cancer liver metastases; BioRep, biological replicate; DMSO, control condition. (F) Comparison of log2FCs (FLC vs. NML; z-scaled) at protein (n = 23 samples) and RNA (n = 27 samples) level. Gene sets were identified that participate in alpha-ketoglutarate (AKG) consumption and production (Human Metabolome Database or HMDB used for identification). Background set (bkgd) is all genes identified in both omics’ datasets.
Figure 7
Figure 7
Glutamine likely serves as a critical substrate for proline production in FLC (A–C) (A) Schematic (top) and correlation plot (bottom) depicting OAT nexus in FLC. Coloration of labels in correlation plot and nodes in schematic correspond to proteins and metabolites with a significant increase (red) or decrease (blue) in log2FC in FLC (proteomics—n = 16 samples; metabolomics—n = 20 samples) compared to NML (proteomics—n = 7 samples; metabolomics—n = 6 samples). Green coloration indicates no significant alteration. Comparison of log2FCs (FLC vs. NML; z-scaled) at protein (n = 23 samples) and RNA (n = 27 samples) level for genes that participate in the consumption or production of (B) glutamate (Glu) or (C) glutamine (Gln). (D) Dose-response curve of FLC cell viability with varying concentrations (n = 8 replicates per concentration) of SU-1, a pan-glutaminase inhibitor. EC50 = 5.0267 μM. Light-shaded green area around curve represents 95% confidence interval. (E) FLC cell viability under glutamine depletion and/or GLS inhibition. Mann-Whitney was used for statistical analysis. ∗ FDR-adj p < 0.05; ∗∗∗ FDR-adj p < 0.001; ∗∗∗∗ FDR-adj p < 0.0001; n.s., not significant. (F) Serum ammonia levels in patients afflicted with FLC comparing limited (n = 10) and extensive (n = 6) tumor burden using Mann-Whitney test (∗FDR-adj p < 0.05). JHU, John Hopkins University. Dotted line indicates the upper limit for serum ammonia. (A) For schematic, arrow size is directly associated with arrow color. Node size is arbitrary. Red, increase; green, neutral; blue, decrease; gray, no data; elliptical node, protein; square node, metabolite; arrow, reaction; broken arrows, series of reactions. (B and C) Human Metabolome Database was used to identify gene sets. (B and C) Gene sets were compared to bkgd using Mann-Whitney test (∗FDR-adjusted p < 0.05; ∗∗FDRFDR-adjusted p < 0.01; ∗∗∗adjusted p < 0.001; ∗∗∗∗adjusted p < 0.0001). (A–C) Background set (bkgd) is all genes identified in both omics’ datasets. For the gene sets (excluding bkgd), circles, genes with no significant log2FCs at either RNA or protein level; diamonds, genes with significant log2FCs at both the RNA and protein level; triangles, genes with significant log2FCs at protein level; squares, genes with significant log2FCs at RNA level; shape size, average gene expression values (from transcriptomic data). (E) Bkgd, Background; RQV, relative quantitative value; Ctrl, control; FBS, fetal bovine serum; Gln, glutamine.

References

    1. Dinh T.A., Utria A.F., Barry K.C., Ma R., Abou-Alfa G.K., Gordan J.D., Jaffee E.M., ’Sco’t J.D., Zucman-Rossi J., O'Neill A.F., et al. A framework for fibrolamellar carcinoma research and clinical trials. Nat. Rev. Gastroenterol. Hepatol. 2022;19:328–342. doi: 10.1038/s41575-022-00580-3. - DOI - PMC - PubMed
    1. Lalazar G., Simon S.M. Fibrolamellar Carcinoma: Recent Advances and Unresolved Questions on the Molecular Mechanisms. Semin. Liver Dis. 2018;38:51–59. doi: 10.1055/s-0037-1621710. - DOI - PMC - PubMed
    1. O'Neill A.F., Church A.J., Perez-Atayde A.R., Shaikh R., Marcus K.J., Vakili K. Fibrolamellar carcinoma: An entity all its own. Curr. Probl. Cancer. 2021;45:100770. doi: 10.1016/j.currproblcancer.2021.100770. - DOI - PubMed
    1. Stipa F., Yoon S.S., Liau K.’H., Fong Y., Jarnagin W.R., D'Angelica M., Abou-Alfa G., Blumgart L.H., DeMatteo R.P. Outcome of patients with fibrolamellar hepatocellular carcinoma. Cancer. 2006;106:1331–1338. doi: 10.1002/cncr.21703. - DOI - PubMed
    1. Ramai D., Ofosu A., Lai J.K., Gao Z.H., Adler D.G. Fibrolamellar Hepatocellular Carcinoma: A Population-Based Observational Study. Dig. Dis. Sci. 2021;66:308–314. doi: 10.1007/s10620-020-06135-3. - DOI - PubMed

MeSH terms

Substances

Supplementary concepts