. 2024 Sep 19;84(18):3455-3468.e6.
doi: 10.1016/j.molcel.2024.08.009. Epub 2024 Aug 28.

Genome access is transcription factor-specific and defined by nucleosome position

Affiliations

Genome access is transcription factor-specific and defined by nucleosome position

Ralph Stefan Grand et al. Mol Cell. .

Abstract

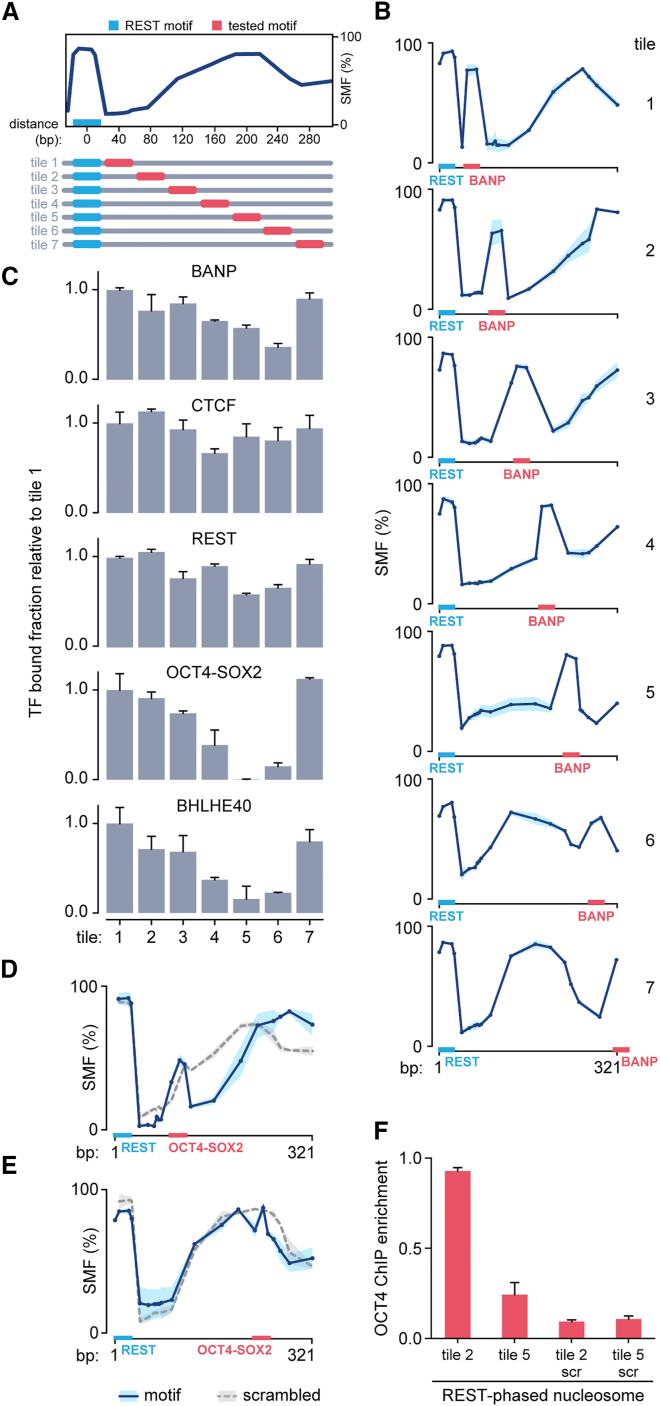
Mammalian gene expression is controlled by transcription factors (TFs) that engage sequence motifs in a chromatinized genome, where nucleosomes can restrict DNA access. Yet, how nucleosomes affect individual TFs remains unclear. Here, we measure the ability of over one hundred TF motifs to recruit TFs in a defined chromosomal locus in mouse embryonic stem cells. This identifies a set sufficient to enable the binding of TFs with diverse tissue specificities, functions, and DNA-binding domains. These chromatin-competent factors are further classified when challenged to engage motifs within a highly phased nucleosome. The pluripotency factors OCT4-SOX2 preferentially engage non-nucleosomal and entry-exit motifs, but not nucleosome-internal sites, a preference that also guides binding genome wide. By contrast, factors such as BANP, REST, or CTCF engage throughout, causing nucleosomal displacement. This supports that TFs vary widely in their sensitivity to nucleosomes and that genome access is TF specific and influenced by nucleosome position in the cell.

Keywords: accessibility; chromatin; genome; nucleosome; pioneer factors; transcription factors.


Conflict of interest statement

Declaration of interests The authors declare no competing interests.

Figures

None
Graphical abstract
Figure 1
Figure 1
A comprehensive survey of motifs for their individual ability to recruit TFs (A) Schematic overview of single-molecule footprinting (SMF): following targeted genomic integration of single-TF-motif occurrences, nuclei are isolated and treated with the GpC methyltransferase M. CviPI. Footprinted DNA is bisulfite converted and sequenced, enabling the quantification of TF and nucleosome occupancy on individual DNA molecules. (B) Top: footprint detected over the REST motif compared with the scrambled control. SMF signal is displayed as a percentage of reads being unmethylated at each individual GCH position. Mean of biological replicates is plotted (dots) and interpolated (lines) together with SEM (shaded area). Bottom: mean footprint of combined biological replicates displayed in a heatmap format (n = 2). (C) Left: footprints detected at single-motif occurrences for TFs expressed in mESCs (see STAR Methods, n = 107). Motifs’ names indicate the annotated cognate TF on JASPAR. Data are sorted by footprint amplitude (SMF score) and interpolated mean of biological replicates is plotted (n = 2). Right: line plots show average SMF signal of respective clusters. Red bar indicates location of TF motif. (D) Tissue specificity of TFs in each SMF cluster (see STAR Methods). (E) Expression level (log2 RPKM) of TFs in different clusters. Black lines correspond to median, boxes to first and third quartiles, and whiskers to the maximum and minimum values of each distribution (n = 2). (F) Length of motifs in the different clusters. Black lines correspond to median, boxes to first and third quartiles, and whiskers to the maximum and minimum values of the distribution. Number of motifs per cluster: cluster 1 = 10; cluster 2 = 14; cluster 3 = 83. n.s., not significant, ∗∗∗p < 0.001 (two-tailed, unpaired Mann-Whitney U test). See also Figure S1.
Figure 2
Figure 2
TF-assisted positioning of a nucleosome in the context of the cell (A) Top left: nucleosome positioning at the W601 sequence measured by SMF following targeted genomic integration (brown bar: minimal 601) (n = 3, mean ± SEM is plotted as in Figure 1B). Bottom left: protected and accessible regions observed on individual DNA molecules from SMF data. Right: average profile of nucleosome occupancy and position in the individual single-molecule clusters and relative quantification (% of all single molecules, n = 1000). (B) Left: nucleosome positioning and REST binding at a REST-bound site in the genome, as measured by MNase-seq and ChIP-seq, respectively. Right: average profile of REST footprint and adjacent phased nucleosome of the highlighted region, as measured by SMF (n = 2, mean ± SEM is plotted as in Figure 1B). (C) Top left: average profile of the REST footprint and adjacent phased nucleosome when the REST motif (blue bar) was inserted upstream of the unphased nucleosome positioning sequence used in the motif screen (n = 3, mean ± SEM is plotted as in Figure 1B). Bottom left: protected and accessible regions observed on individual DNA molecules from SMF data. Right: average profiles of REST and nucleosome occupancy and position in the individual clusters and relative quantification (% of all single molecules, n = 1000). See also Figure S2.
Figure 3
Figure 3
Differential occupancy of tested TF motifs at a non-nucleosomal versus a nucleosomal site (A) Top: average profile of the REST footprint and adjacent phased nucleosome when the REST motif (blue bar) was inserted 67 bp upstream of the tested motif (red bar) in the unphased nucleosome positioning sequence used in the motif screen (n = 3, mean is plotted as in Figure 1B). Bottom: heatmap of the SMF detected at single-motif occurrences for selected TFs (n = 17) in the non-nucleosomal region of the REST-phased nucleosome context (non-nucleosomal motifs). SMF is plotted relative to the maximum SMF signal over the REST motif (see STAR Methods). Data are sorted by footprint amplitude (SMF score) and interpolated mean of biological replicates is plotted (n ≥ 2). (B) Top: average profile of the REST footprint and adjacent phased nucleosome when the REST motif (blue rectangle) was inserted 137 bp upstream of the tested motif (red rectangle) in the unphased nucleosome positioning sequence used in the motif screen (n = 3, mean is plotted as in Figure 1B). Bottom: heatmap of the SMF detected at single-motif occurrences for selected TFs (n = 17) in the nucleosomal region of the REST-phased nucleosome context (nucleosomal motifs). Data are plotted as in (B) (n ≥ 2). (C) Quantification of the footprint for each tested TF motif when placed in the non-nucleosomal or nucleosomal region (the upstream REST motif was not used to compute the SMF score) (n ≥ 2, mean ± SEM). See also Figure S3.
Figure 4
Figure 4
Motif position along the nucleosome influences occupancy in a TF-specific fashion (A) Scheme illustrating motif tiling throughout the REST-phased nucleosome construct. (B) Average profiles of SMF data over the BANP motif across the seven motif positions illustrating that BANP can bind to all positions (n = 3, mean ± SEM is plotted as in Figure 1B). (C) Quantification of the TF-bound fraction at each motif position in the REST-phased nucleosome construct for five different motifs (n ≥ 2, mean ± SEM). (D and E) Average profiles of SMF data over the OCT4-SOX2 motif in a non-nucleosomal (D, tile 2) or nucleosomal (E, tile 5) tile compared with scrambled controls illustrating reduced binding at the dyad (n ≥ 2, mean ± SEM is plotted as in Figure 1B). (F) Chromatin immunoprecipitation followed by quantitative PCR of OCT4 at a non-nucleosomal (tile 2) or nucleosomal (tile 5) motif position. ChIP enrichment is relative to an OCT4-bound endogenous region (n = 2, mean ± SEM). scr, scrambled motif. See also Figure S4.
Figure 5
Figure 5
Nucleosome presence restricts OCT4 binding in the genome (A) Running average (k = 15) of OCT4 binding at OCT4-SOX2 motifs in the ±250-bp window around CTCF-bound sites in wild-type cells. (B) Single-locus example of OCT4 binding and nucleosome positioning (MNase-seq) at an OCT4-SOX2 motif (red bar) next to a CTCF-bound motif (blue bar), before and after genetic deletion of SNF2H. (C) Loss of OCT4 binding at OCT4-SOX2 motifs adjacent to bound CTCF sites that lose binding in SNF2H knockout cells. Each bar represents the average fold change of OCT4 binding over 15 OCT4-SOX2 motifs measured in four biological replicates. Error bars indicate SEM. Significant fold changes are highlighted in red (p < 0.05, permutation test, see STAR Methods). Average MNase fold change between SNF2H KO and WT at these sites is displayed on the top. See also Figure S5.

References

    1. D’haeseleer P. What are DNA sequence motifs? Nat. Biotechnol. 2006;24:423–425. doi: 10.1038/NBT0406-423. - DOI - PubMed
    1. Inukai S., Kock K.H., Bulyk M.L. Transcription factor–DNA binding: beyond binding site motifs. Curr. Opin. Genet. Dev. 2017;43:110–119. doi: 10.1016/J.GDE.2017.02.007. - DOI - PMC - PubMed
    1. Li E., Beard C., Jaenisch R. Role for DNA methylation in genomic imprinting. Nature. 1993;366:362–365. doi: 10.1038/366362a0. - DOI - PubMed
    1. Padeken J., Methot S.P., Gasser S.M. Establishment of H3K9-methylated heterochromatin and its functions in tissue differentiation and maintenance. Nat. Rev. Mol. Cell Biol. 2022;23:623–640. doi: 10.1038/s41580-022-00483-w. - DOI - PMC - PubMed
    1. Yin Y., Morgunova E., Jolma A., Kaasinen E., Sahu B., Khund-Sayeed S., Das P.K., Kivioja T., Dave K., Zhong F., et al. Impact of cytosine methylation on DNA binding specificities of human transcription factors. Science. 2017;356 doi: 10.1126/SCIENCE.AAJ2239. - DOI - PMC - PubMed

MeSH terms