. 2024 Aug 28;10(3):e004112.
doi: 10.1136/rmdopen-2024-004112.

Efficacy of BAFF inhibition and B-cell depletion in non-obese diabetic mice as a spontaneous model for Sjögren's disease

Affiliations

Efficacy of BAFF inhibition and B-cell depletion in non-obese diabetic mice as a spontaneous model for Sjögren's disease

Renaud Felten et al. RMD Open. .

Abstract

Introduction: The therapeutic interest of targeting B-cell activating factor (BAFF) in Sjögren's disease (SjD) can be suspected from the results of two phase II clinical trials but has not been evaluated in an animal model of the disease. We aimed to evaluate the therapeutic efficacy of this strategy on dryness and salivary gland (SG) infiltrates in the NOD mouse model of SjD.

Material and methods: Female NOD mice between ages 10 and 18 weeks were treated with a BAFF-blocking monoclonal antibody, Sandy-2 or an isotype control. Dryness was measured by the stimulated salivary flow. Salivary lymphocytic infiltrates were assessed by immunohistochemistry. Blood, SGs, spleen and lymph-node lymphocyte subpopulations were analysed by flow cytometry. SG mRNA expression was analysed by transcriptomic analysis.

Results: BAFF inhibition significantly decreased SG lymphocytic infiltrates, which was inversely correlated with salivary flow. The treatment markedly decreased B-cell number in SGs, blood, lymph nodes and spleen and increased Foxp3+ regulatory and CD3+CD4-CD8- double negative T-cell numbers in SGs.

Conclusion: A monoclonal antibody blocking BAFF and depleting B cells had therapeutic effectiveness in the NOD mouse model of SjD. The increase in regulatory T-lymphocyte populations might underlie the efficacy of this treatment.

Keywords: B-Lymphocytes; Sjogren's Syndrome; T-Lymphocytes.


Conflict of interest statement

Competing interests: None declared.

Figures

Figure 1
Figure 1. Sialadenitis and salivary flow. (A) Representative section of a salivary gland (SG) of an anti-B-cell activating factor (BAFF)-treated NOD mouse (H&E staining). One focus can be observed (highlighted by the dotted green line). (B) Representative section of an SG of an isotype control-treated NOD mouse. Three foci can be observed. (C) Representative section of an SG of a non-treated NOD mouse. Four foci can be observed. (D) Focus score (FS) of anti-BAFF-treated mice (n=13) and isotype control (n=10). One focus defined as an aggregate of ≥50 lymphocytes and the FS defined as the average number of foci per 4 mm2 SG tissue. (E) Change from baseline of stimulated salivary flow (final–baseline) in anti-BAFF-treated NOD mice (n=16) and isotype control-treated NOD mice (n=11). (F) Correlation between change from baseline in stimulated salivary flow (final–baseline) and FS after treatment of NOD mice (n=21). Mann-Whitney and Spearman correlation: *p<0.05, ***p<0.001. Data are median (IQR).
Figure 2
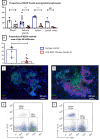
Figure 2. B-cell depletion. (A) The proportion of CD19+ B-cells to total lymphocytes in blood, salivary glands, spleen and lymph nodes determined by flow cytometry in NOD mice treated with anti-B-cell activating factor (BAFF) antibody (n=8, 12, 9 and 4, respectively) and isotype control (n=3, 13, 8 and 3, respectively). (B) The area of the infiltrate delimited on microscopy slides. The proportion of this area occupied by B220+ cells was determined in salivary glands of NOD mice treated with anti-BAFF antibody (n=9) and isotype control (n=6). (C) Representative photograph of a salivary gland embedded in paraffin and stained with DAPI (blue), CD3 (green) and B220 (pink) from an anti-BAFF-treated NOD mouse. (D) Representative photograph of a salivary gland embedded in paraffin and stained with DAPI (blue), CD3 (green) and B220 (pink) from an isotype control-treated NOD mouse. (E) Representative flow cytometry plots illustrating the proportion of B cells (CD19+) among lymphocytes from a BAFF-treated NOD mouse. (F) Representative flow cytometry plots illustrating the proportion of B cells (CD19+) among lymphocytes from an isotype control-treated NOD mouse. Mann-Whitney: NS: non-significant; *p<0.05, **p<0.01, ****p<0.0001. Data are median (IQR).
Figure 3
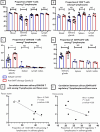
Figure 3. Modifications of T-cell subpopulations. (A) Proportion of CD4+ T cells among all T cells in blood, salivary glands, spleen and lymph nodes of NOD mice treated with anti-B-cell activating factor (BAFF) antibody (n=4, 13, 8 and 4, respectively) or the isotype control (n=3, 12, 8 and 3, respectively). (B) Proportion of CD8+ T cells among all T cells in blood, salivary glands, spleen and lymph nodes of NOD mice treated with anti-BAFF antibody (n=4, 13, 9 and 4, respectively) or the isotype control (n=3, 12, 8 and 3, respectively). (C) Proportion of CD4CD8 T cells among all T cells in salivary glands, spleen and lymph nodes of NOD mice treated with anti-BAFF antibody (n=13, 4 and 4, respectively) or the isotype control (n=12, 3 and 3, respectively). (D) Proportion of CD4+FoxP3+ T cells among all T cells in salivary glands, spleen and lymph nodes of NOD mice treated with anti-BAFF antibody (n=13, 4 and 3, respectively) or the isotype control (n=12, 3 and 3, respectively). Data are median (IQR). (E) Correlation between the proportion of salivary CD4CD8 T cells among all T cells and the focus score for NOD mice treated with anti-BAFF antibody (n=4) or the isotype control (n=3). (F) Correlation between the proportion of salivary CD4+FoxP3+ regulatory T cells among all T cells and the focus score for NOD mice treated with anti-BAFF antibody (n=4) or the isotype control (n=2). Mann-Whitney and Spearman correlation: **p<0.01, ***p<0.001. NS, not significant.
Figure 4
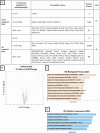
Figure 4. Transcriptomic analysis. (A) List of differentially expressed genes (DEGs) (absolute fold change in expression >2, p<0.05) and their known predominant implication in the pathophysiology of B cells, T cells, T regulatory cells (Tregs) and others. Among those involved in T-cell pathophysiology, those related to Tregs are in italics and their numbers are in brackets. *Some genes might be involved in different pathways but were mentioned only once. (B) Volcano plot. The log2 fold change indicates the mean expression level for each gene. Each dot represents one gene. After B-cell activating factor (BAFF) inhibition, grey dots represent no significant DEGs between the anti-BAFF therapy group and the isotype control group; the green dots represent downregulated genes and red dots upregulated genes. (C) Gene Ontology (GO) classifications of DEGs. With GO functional enrichment, ‘biological process’, ‘molecular function’ and ‘cellular component’ are ranked by p value (all p<0.05). (D) Kyoto Encyclopedia of Genes and Genomes pathway enrichment of DEGs.

References

    1. Mariette X, Criswell LA. Primary Sjögren’s Syndrome. N Engl J Med. 2018;378:931–9. doi: 10.1056/NEJMcp1702514. - DOI - PubMed
    1. Mackay F, Woodcock SA, Lawton P, et al. Mice transgenic for BAFF develop lymphocytic disorders along with autoimmune manifestations. J Exp Med. 1999;190:1697–710. doi: 10.1084/jem.190.11.1697. - DOI - PMC - PubMed
    1. Groom J, Kalled SL, Cutler AH, et al. Association of BAFF/BLyS overexpression and altered B cell differentiation with Sjögren’s syndrome. J Clin Invest. 2002;109:59–68. doi: 10.1172/JCI14121. - DOI - PMC - PubMed
    1. Mariette X, Roux S, Zhang J, et al. The level of BLyS (BAFF) correlates with the titre of autoantibodies in human Sjögren’s syndrome. Ann Rheum Dis. 2003;62:168–71. doi: 10.1136/ard.62.2.168. - DOI - PMC - PubMed
    1. Lavie F, Miceli-Richard C, Quillard J, et al. Expression of BAFF (BLyS) in T cells infiltrating labial salivary glands from patients with Sjögren’s syndrome. J Pathol. 2004;202:496–502. doi: 10.1002/path.1533. - DOI - PubMed

Substances