. 2024 Aug 28;12(8):e008977.
doi: 10.1136/jitc-2024-008977.

Nanoparticles targeting immune checkpoint protein VISTA induce potent antitumor immunity

Affiliations

Nanoparticles targeting immune checkpoint protein VISTA induce potent antitumor immunity

Taylor J Moon et al. J Immunother Cancer. .

Abstract

Background: Immune checkpoint protein V-domain immunoglobulin suppressor of T cell activation (VISTA) controls antitumor immunity and is a valuable target for cancer immunotherapy. Previous mechanistic studies have indicated that VISTA impairs the toll-like receptor (TLR)-mediated activation of myeloid antigen-presenting cells, promoting the expansion of myeloid-derived suppressor cells, and suppressing tumor-reactive cytotoxic T cell function.

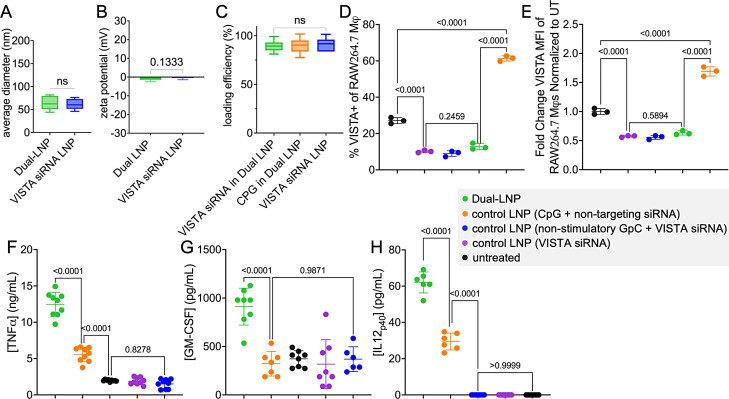
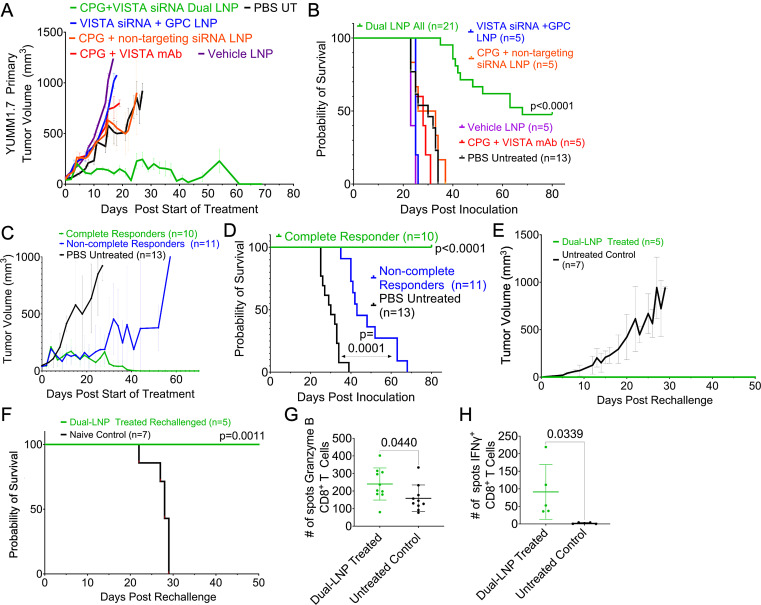
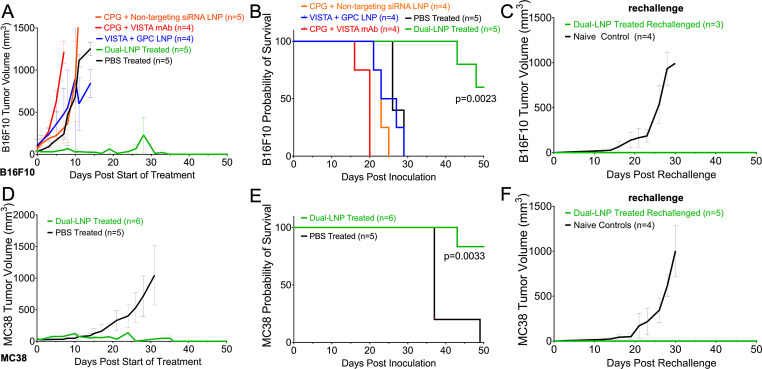
Methods: The aim of this study was to develop a dual-action lipid nanoparticle (dual-LNP) coloaded with VISTA-specific siRNA and TLR9 agonist CpG oligonucleotide. We used three murine preclinical tumor models, melanoma YUMM1.7, melanoma B16F10, and colon carcinoma MC38 to assess the functional synergy of the two cargoes of the dual LNP and therapeutic efficacy.

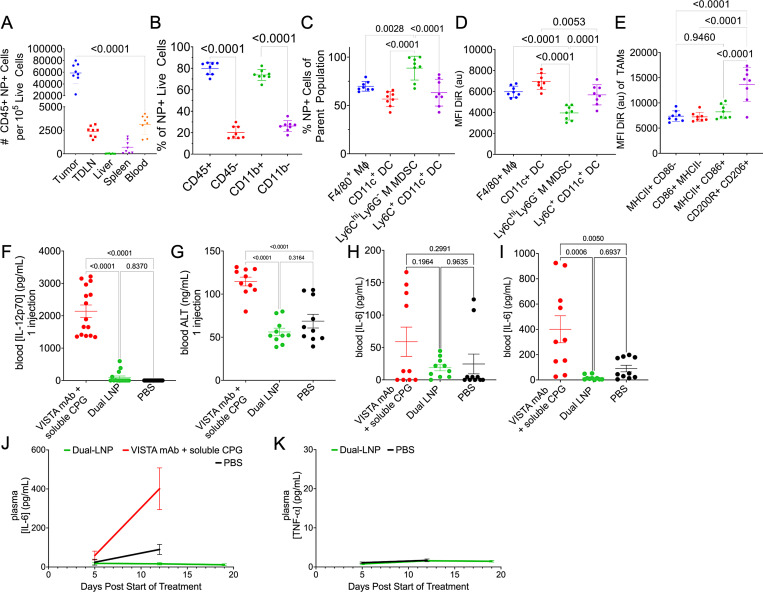
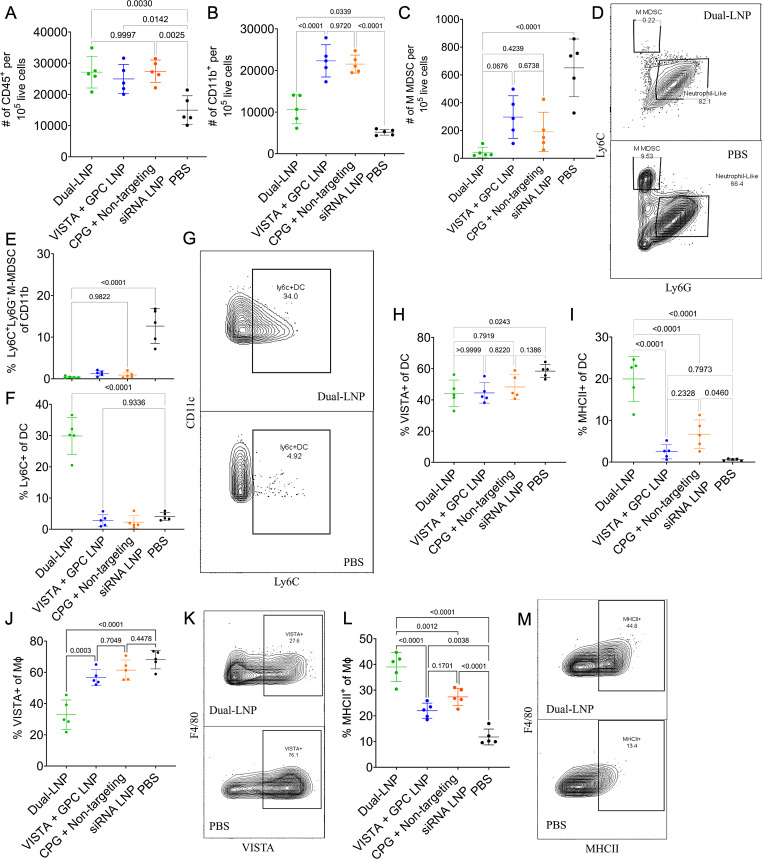
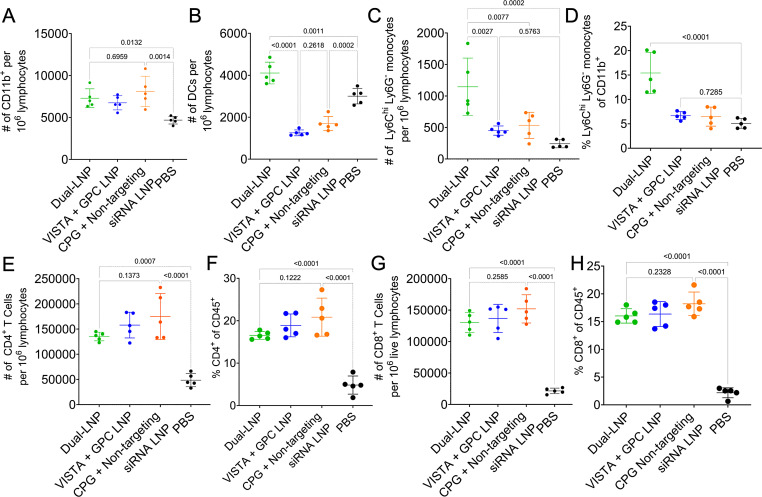
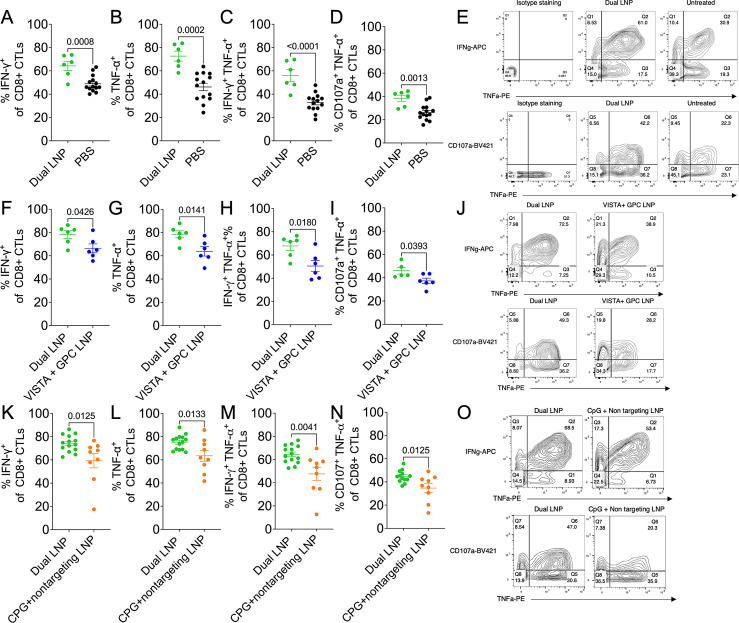
Results: The dual-LNP synergistically augmented antitumor immune responses and rejected large established tumors whereas LNPs containing VISTA siRNA or CpG alone were ineffective. In comparison with therapies using the soluble CpG and a VISTA-specific monoclonal antibody, the dual-LNP demonstrated superior therapeutic efficacy yet with reduced systemic inflammatory cytokine production. In three murine models, the dual-LNP treatment achieved a high cure rate. Tumor rejection was associated with influx of immune cells to tumor tissues, augmented dendritic cell activation, production of proinflammatory cytokines, and improved function of cytotoxic T cells.

Conclusions: Our studies show the dual-LNP ensured codelivery of its synergistic cargoes to tumor-infiltrating myeloid cells, leading to simultaneous silencing of VISTA and stimulation of TLR9. As a result, the dual-LNP drove a highly potent antitumor immune response that rejected large aggressive tumors, thus may be a promising therapeutic platform for treating immune-cold tumors.

Keywords: Gene therapy; Immune Checkpoint Inhibitor; Nanoparticle; Vaccine.


Conflict of interest statement

Competing interests: LLW is an inventor involved with the commercial development of VISTA with ImmuNext (Lebanon, NH). The other authors declare no potential conflicts of interest.

Figures

Figure 1
Figure 1. Characterization of the effects of dual LNP in vitro. (A) Hydrodynamic diameter of dual-LNP and VISTA siRNA only LNP. (B) Zeta potential of dual-LNP and VISTA siRNA only LNP. (C) Loading efficiency of siRNA or ODN-1826 CPG in the dual-LNP and control LNP loaded with VISTA siRNA only. RAW264.7 macrophages treated with dual LNP, control LNP (VISTA siRNA only), control LNP (CPG+non-targeting siRNA), control LNP (non-stimulatory GPC+VISTA siRNA), or PBS for 24 hours. (D) %VISTA+ cells. (E) VISTA expression (MFI) normalized to the untreated cells. Secreted cytokines, including TNF-α (F), GM-CSF (G), and IL-12p40 (H) were quantified by ELISA. Studies were conducted in independent triplicate and statistics were performed via Student’s t-test or one-way ANOVA with Tukey’s post-test. ANOVA, analysis of variance; LNP, lipid nanoparticle; VISTA, V-domain immunoglobulin suppressor of T cell activation; MFI, mean fluorescence intensity.
Figure 2
Figure 2. Studies of safety and biodistribution of dual LNP. Flow cytometry analysis of YUMM1.7 tumor tissues. (A) The number of CD45+ dual-LNP+ cells per 105 live cells, (B) Percentages of CD45+, CD45, CD11b+, CD11b cells among all dual-LNP+ cells, (C) Percentages of dual-LNP+ cells among each types of myeloid cells, including F4/80+ macrophages, CD11c+ total dendritic cells, Ly6C+ CD11c+ inflammatory dendritic cells, or Ly6C+ CD11c Ly6G M-MDSC populations, (D) Mean fluorescent intensity of dual-LNP DiR’ signal among the dual-LNP+ cell populations, and (E) Mean fluorescent intensity of dual-LNP DiR’ signal among the activated macrophage subset. (F) Blood IL-12p70 and (G) blood ALT enzyme levels were quantified following one dose of intratumorally administered dual-LNP, intratumorally administered PBS, or intravenously administered VISTA mAb and soluble CPG. Blood IL-6 concentration (H) 5 days following the start of treatment, (I) 12 days following the start of treatment, and (J) over several time points during treatment were shown. (K) Blood TNF-α concentration over several time points during treatment. Animal studies were performed with 5 mice per group. Statistics were analyzed by Student’s t-test or one-way ANOVA with Tukey’s post-test. ANOVA, analysis of variance; LNP, lipid nanoparticle; mAb, monoclonal antibody; MDSC, myeloid-derived suppressor cell; VISTA, V-domain immunoglobulin suppressor of T cell activation; PBS, phosphate-buffered saline.
Figure 3
Figure 3. Survival study in the YUMM1.7 melanoma model in mice. Mice-bearing YUMM1.7 tumors were treated when the tumors were ~60 mm3. The dual-LNPs were injected intratumorally (IT) weekly for a total of 4 weeks at a dose containing 4 µg of CPG and 10 µg of VISTA siRNA. Mice were IT injected with VISTA-siRNA-only LNPs at a dose of a 10 µg siRNA 3 days after a dual-LNP treatment. Similar schedule/dose were used for the control treatments. (A) Tumor growth curves for groups treated with dual LNP (n=21 mice), control LNP (VISTA siRNA+non-stimulatory GPC; n=5 mice), control LNP (CPG+non-targeting siRNA; n=5 mice), vehicle LNP (n=5 mice), CPG and VISTA mAb (n=5 mice), or PBS (n=13 mice). (B) Kaplan-Meier survival. (C) Tumor growth curves of the complete responders and non-complete responders in the dual-LNP-treated group. (D) Kaplan-Meier survival of complete and non-complete responders in the dual-LNP-treated group. (E) A subset of complete responders (n=5) was rechallenged with YUMM1.7 cells on their opposite flank 30 days after completion of the dual-LNP treatments. The tumor growth was compared with naïve controls (n=7). (F) Kaplan-Meier survival of rechallenged mice. A subset of complete responders (n=5) was used for ELISPOT assays. CD4 and CD8 T cells were isolated 12 days following rechallenge. T cells were stimulated with irradiated YUMM1.7 cells (100 Gy). (G) ELISPOT results for Granzyme B from lymphatic CD8+ T cells following rechallenge. (H) ELISPOT results for IFN-γ from splenic CD8+ T cells following rechallenge. Statistics were analyzed by Student’s t-test. LNP, lipid nanoparticle; VISTA, V-domain immunoglobulin suppressor of T cell activation; PBS, phosphate-buffered saline.
Figure 4
Figure 4. Myeloid immune cell profile of primary YUMM1.7 tumors 5 days after the initiation of the dual-LNP treatment. Mice were treated with dual-LNP, control LNP (VISTA siRNA+non-stimulatory GPC), control LNP (CPG+non-targeting siRNA), or saline. Tissue was harvested 5 days after the start of treatment. The number of (A) CD45+immune cells and (B) CD11b+ immune cells per 105 live cells in the tumor microenvironment. (C) The number of M-MDSC cells in the tumor microenvironment per 105 live cells. (D) Representative flow plot of MDSC populations in dual-LNP and PBS-treated mice. (E) The percentage of CD11b+ myeloid immune cells that are M-MDSCs. (F) % of DCs that are Ly6C+. (G) Representative flow plots of Ly6C+ expression in DC populations for dual-LNP treated and PBS-treated mice. (H) % of DCs that are VISTA+. (I) % of DCs that are MHCII+. (J) % of Mϕ’s that are VISTA+. (K) Representative flow plots of VISTA expression in Mϕ from dual-LNP treated and PBS-treated mice. (L) % of Mϕ’s that are MHCII+. (M) Representative flow plots of MHCII expression in Mϕ from dual-LNP treated and PBS-treated mice. All experiments were performed with five mice per group. Statistics were analyzed by one-way ANOVA with Tukey’s post-test. ANOVA, analysis of variance; DCs, dendritic cells; LNP, lipid nanoparticle; MDSC, myeloid-derived suppressor cell; VISTA, V-domain immunoglobulin suppressor of T cell activation; PBS, phosphate-buffered saline.
Figure 5
Figure 5. Myeloid immune cell profile of the tumor-draining lymph node 5 days after the initiation of the dual-LNP treatment. Flow cytometry analysis 5 days after treatment initiation with dual-LNP, control LNP (VISTA siRNA+GPC), or control LNP (CPG+non-targeting siRNA). (A) The number of CD11b+ myeloid immune cells per 106 lymphocytes. (B) The number of DCs per 106 lymphocytes. (C) The number of monocytes cells per 106 lymphocytes. (D) The percentage of CD11b+ myeloid immune cells that are monocytes. (E) The percentage of CD45+ immune cells that are CD4+ T cells. (F) The number of CD4+ T cells per 106 lymphocytes. (G) The percentage of CD45+ immune cells that are CD8+ T cells. (H) The number of CD8+ T cells per 106 lymphocytes. All experiments were performed with five mice per group. Statistics were analyzed by one-way ANOVAs with Tukey’s post-test. ANOVA, analysis of variance; LNP, lipid nanoparticle.
Figure 6
Figure 6. The superior effector function of CD8+ tumor-infiltrating T cells following treatment with dual-LNP. Mice were inoculated with YUMM1.7 tumors and treated with either PBS, dual-LNP, VISTA control dual-LNP (VISTA siRNA+non-stimulatory GPC), and CPG control dual-LNP (CPG+non targeting siRNA). (A–E) Tumors were harvested 12 days after the start of treatment with dual-LNP and PBS treated. Tumor-associated lymphocytes were stimulated ex vivo with antiCD3 and antiCD28 for 16 hours. The expression of effector molecules was examined by flow cytometry and shown as the percentages of CD8+ TILs. The percentages of IFN-γ+(A), TNF-α+(B), IFN-γ+ TNF-α+(C), and CD107a+ TNF-α+(D), CD8+ TILS in dual-LNP and PBS-treated tumors were shown. (E) Representative flow cytometry plots of IFN-γ, TNF-α, and CD107a staining. (F–J) Tumors were harvested and stimulated 14 days after the start of treatment with dual-LNP and control LNP (VISTA siRNA+non-stimulatory GPC). IFN-γ+(F), TNF-α+(G), IFN-γ+ TNF-α+(H), and CD107a+ TNF-α+(I), CD8+ TILS in dual CPG+VISTA siRNA LNP and PBS-treated tumors were shown. (J) Representative flow cytometry plots of IFN-γ, TNF-α, and CD107a staining. (K–O) Tumors were harvested and stimulated 14 days after the start of treatment with dual LNP and control LNP (CPG+non-targeting siRNA). IFN-γ+(K), TNF-α+(L), IFN-γ+ TNF-α+(M), and CD107a+ TNF-α+(N), CD8+ TILS in dual CPG+VISTA siRNA LNP and PBS-treated tumors were shown. (O) Representative flow cytometry plots of IFN-γ, TNF-α, and CD107a staining. All experiments were performed with at least six mice per group. Statistics were analyzed by Student’s t-test. LNP, lipid nanoparticle; VISTA, V-domain immunoglobulin suppressor of T cell activation; PBS, phosphate-buffered saline.
Figure 7
Figure 7. Survival of B16F10 and MC38 tumor-bearing mice. Mice bearing a B16F10 tumor or MC38 tumor were treated starting 15 days or 8 days after inoculation, respectively, when the tumors were ~60 mm3. The dual-LNPs were injected intratumorally (IT) weekly for a total of 4 weeks at a dose containing 4 µg of CPG and 10 µg of VISTA siRNA. Mice were IT injected with VISTA-siRNA-only LNPs at a dose of a 10 µg siRNA 3 days following every dual-LNP treatment. Similar schedule and dose were used for the control treatments. (A) B16F10 tumor growth curves for groups treated with dual-LNP, control LNP (VISTA siRNA+non-stimulatory GPC), control LNP (CPG+non-targeting siRNA), VISTA mAb and soluble CPG, or PBS (n=4–5 per group). (B) Kaplan-Meier survival of B16F10 tumor-bearing mice. (C) B16F10 tumor growth curves following tumor rechallenge of the complete responders treated with dual-LNP. The rechallenge experiment was conducted with the three complete responders and four naïve control mice. (D) MC38 tumor growth curves for groups treated with dual-LNP or PBS (n=6 for the dual LNP-treated group; n=5 for the PBS control group). (E) Kaplan-Meier survival of MC38 tumor-bearing mice. (F) MC38 tumor growth curves following tumor rechallenge of the complete responders treated with dual-LNP. The rechallenge experiment was conducted with five complete responders and four naïve control mice. LNP, lipid nanoparticle; VISTA, V-domain immunoglobulin suppressor of T cell activation; PBS, phosphate-buffered saline.

References

    1. Schreiber RD, Old LJ, Smyth MJ. Cancer immunoediting: integrating immunity’s roles in cancer suppression and promotion. Science. 2011;331:1565–70. doi: 10.1126/science.1203486. - DOI - PubMed
    1. Demaria O, Cornen S, Daëron M, et al. Harnessing innate immunity in cancer therapy. Nat New Biol. 2019;574:45–56. doi: 10.1038/s41586-019-1593-5. - DOI - PubMed
    1. Wang J, Li D, Cang H, et al. Crosstalk between cancer and immune cells: Role of tumor‐associated macrophages in the tumor microenvironment. Cancer Med. 2019;8:4709–21. doi: 10.1002/cam4.2327. - DOI - PMC - PubMed
    1. Veglia F, Perego M, Gabrilovich D. Myeloid-derived suppressor cells coming of age. Nat Immunol. 2018;19:108–19. doi: 10.1038/s41590-017-0022-x. - DOI - PMC - PubMed
    1. Joyce JA, Fearon DT. T cell exclusion, immune privilege, and the tumor microenvironment. Science. 2015;348:74–80. doi: 10.1126/science.aaa6204. - DOI - PubMed

LinkOut - more resources