. 2024 Aug 29;7(11):e202402764.
doi: 10.26508/lsa.202402764. Print 2024 Nov.

Mitochondrial double-stranded RNA homeostasis depends on cell-cycle progression

Affiliations

Mitochondrial double-stranded RNA homeostasis depends on cell-cycle progression

Vanessa Xavier et al. Life Sci Alliance. .

Abstract

Mitochondrial gene expression is a compartmentalised process essential for metabolic function. The replication and transcription of mitochondrial DNA (mtDNA) take place at nucleoids, whereas the subsequent processing and maturation of mitochondrial RNA (mtRNA) and mitoribosome assembly are localised to mitochondrial RNA granules. The bidirectional transcription of circular mtDNA can lead to the hybridisation of polycistronic transcripts and the formation of immunogenic mitochondrial double-stranded RNA (mt-dsRNA). However, the mechanisms that regulate mt-dsRNA localisation and homeostasis are largely unknown. With super-resolution microscopy, we show that mt-dsRNA overlaps with the RNA core and associated proteins of mitochondrial RNA granules but not nucleoids. Mt-dsRNA foci accumulate upon the stimulation of cell proliferation and their abundance depends on mitochondrial ribonucleotide supply by the nucleoside diphosphate kinase, NME6. Consequently, mt-dsRNA foci are profuse in cultured cancer cells and malignant cells of human tumour biopsies. Our results establish a new link between cell proliferation and mitochondrial nucleic acid homeostasis.


Conflict of interest statement

The authors declare that they have no conflict of interest.

Figures

Figure S1.
Figure S1.. Analysis of SUV3 foci.
(A) Dot blot analysis of in vitro transcribed RNA species. Top: 100 bp single-stranded RNA and dsRNA was transcribed in vitro either with UTP or with BrUTP. 1 μg of each species of RNA was dotted on nitrocellulose and immunoblotted with the anti-BrU antibody. Bottom: Structure of the RNA brominated tridecamer r(GCGUU-5BUGAAACGC) at 1.3 A obtained with X-ray diffraction showing the placement of the Bromine molecule (pink) within the helix of dsRNA. Images were obtained based on the Protein Data Bank entry (DOI: 2R20). (B) Immunofluorescence of SUV3 and mitochondria labelled with MitoTracker DeepRed in U2OS cells treated with the indicated siRNA for 48 h and imaged by confocal microscopy (scale bar: 20 μm). (C) Immunoblot analysis of SUV3 in whole-cell lysates obtained from HeLa WT cells treated with the indicated siRNA for 48 h (D) U2OS cells were treated with BrU for 1 h and immunostained with anti-SUV3 (green) along with antibodies against BrU, dsRNA, GRSF1, or DNA (red). Mitochondria are visualised with transfected mito-EYFP (grey). Images were acquired by confocal and stimulated emission depletion microscopy (scale bar: 20 and 5 μm, respectively). (D, E) Beeswarm plot of the area of SUV3 foci relative to their overlap with either BrU, dsRNA, GRSF1, and mtDNA from confocal images as shown in (D) (N = 100–105 cells from two independent cultures) (for SUV3 foci with no overlap; vs BrU: number of foci measured = 1,058, vs dsRNA: number of foci measured = 853, vs GRSF1: number of foci measured = 673, vs mtDNA: number of foci measured = 825; number of cells for all comparisons = 5 cells) (for SUV3 foci with partial or complete overlap; vs BrU: number of foci measured = 479, vs dsRNA: number of foci measured = 644, vs GRSF1: number of foci measured = 387, vs mtDNA: number of foci measured = 80). Data are represented as means ± S.D. Source data are available for this figure.
Figure 1.
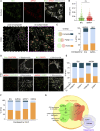
Figure 1.. dsRNA and BrU-labelled mtRNA are closely associated within MRGs.
(A) U2OS cells were treated with BrU for 1 h and immunostained with anti-BrU (green), anti-dsRNA (red), and anti-TOMM20 antibodies (mitochondria; grey) and imaged with confocal microscopy (top row; scale bar: 20 μm). The indicated region was imaged with stimulated emission depletion (STED) microscopy (bottom row left; scale bar: 2 μm) and a 3D surface rendering and zoom of the STED image is shown. The white trace defines the boundary of the mitochondrial area (bottom row right; scale bar: 1 μm). (B) Beeswarm plot of individual BrU and dsRNA foci area in U2OS cells imaged by STED microscopy. Horizontal lines indicate the mean value and error bars indicate the SD. Number of foci measured: BrU = 537; dsRNA = 575; number of cells = 7 from one culture. Welch’s unpaired t test; ns, not significant. (B, C) The degree of overlap between BrU and dsRNA foci represented in (B) was categorised as shown and calculated as a percentage of the total number of BrU and dsRNA foci measured. (D) U2OS cells transfected with mito-EYFP (grey) were immunostained with the indicated antibodies and imaged by STED microscopy (scale bar: 20 μm). (C, E) The percentage of BrU and dsRNA foci overlapped by FASTKD2 and GRSF1 foci categorised as in (C). BrU versus FASTKD2: number of foci measured = 315; number of cells = 10; BrU versus GRSF1: number of foci measured = 275; number of cells = 5; dsRNA versus FASTKD2: number of foci measured = 1,806; number of cells = 10; dsRNA versus GRSF1: number of foci measured = 1,432; number of cells = 8. (C, F) Percentage of by BrU, dsRNA, GRSF1, or mtDNA foci overlapped by SUV3 foci categorised as in (C). BrU versus SUV3: number of foci measured = 958; number of cells = 4; dsRNA versus SUV3: number of foci measured = 1,189; number of cells = 4; GRSF1 versus SUV3: number of foci measured = 868; number of cells = 4; mtDNA versus SUV3: number of foci measured = 773; number of cells = 4. (G) Model depicting the sub-compartmentalisation of single-stranded RNA and dsRNA in the MRG with associated RNA processing functions. Approximately half of MRGs and dsRNA foci associate with SUV3, which interacts with PNPase within the degradosome.
Figure S2.
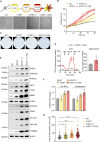
Figure S2.. Characterisation of the fibroblast transformation model.
(A) Schematic of the retroviral strategy used to transform human dermal fibroblasts (top). Brightfield images of the resulting cell lines are shown (bottom, scale bar: 200 μm). (B) Cell proliferation of the indicated fibroblast cell lines as measured by confluency (N = 3 independent cultures). Error bars indicate the SD. (C) Colony formation assay with the indicated fibroblast cell line. Images are representative of two technical repeats. (D) Oxygen consumption rates (left) and basal extracellular acidification rate (ECAR) of WT and hTERT-LT-RAS fibroblasts. Oligomycin (Olg), carbonyl cyanide-p-trifluoromethoxyphenylhydrazone (FCCP), and rotenone + antimycin A (Rot + AA) were injected at the time points indicated by the arrows. Mean data values are plotted, and the error bars indicate the SD (N = 4 independent cultures). (E) Immunoblot analysis of mitochondrial and MRG-associated proteins in whole-cell lysates obtained from each fibroblast cell line. Samples were blotted on different membranes which are indicated by the dotted lines. (F) mtDNA levels in transformed fibroblast cell lines relative to WT fibroblasts as measured by qPCR of the indicated mtDNA regions, MT-RNR1 and MT-CYTB. Cq values were normalised against nuclear ACTB (N = 3 independent cultures). Bars indicate the mean and the error bars represent the SD. Individual data points are shown as grey circles. (G) Scatter plot of the mitochondrial network area per cell in each fibroblast cell line. Area was measured from the immunofluorescence staining of anti-TOMM20 antibodies and imaged by epifluorescence microscopy. The one-way ANOVA test was used to determine P-values compared with WT. P-value (WT versus hTERT) = 0.0029, P-value (WT versus hTERT-LT) < 0.0001, P-value (WT versus hTERT-LT-Ras) < 0.0001 (number of cells for each cell line = 30, from two independent cultures). Horizontal lines indicate the mean value and error bars represent the SD. Source data are available for this figure.
Figure 2.
Figure 2.. Mitochondrial dsRNA foci accumulate upon oncogenic transformation.
(A) Immunofluorescence of dsRNA, BrU, and DNA in the indicated fibroblast cell lines treated with BrU for 1 h and imaged by confocal microscopy. DAPI staining shown in blue (scale bar: 20 μm). (B) Number of mitochondrial dsRNA foci, BrU foci, and nucleoids per μm2 of mitochondria determined by immunofluorescence and confocal microscopy. The mitochondrial network was imaged using anti-TOMM20 antibody. Box and whiskers plot represent the number of foci per μm2 mitochondria for each cell. Whiskers represent minimum and maximum values. Boxes extend from the 25th to the 75th percentile with the median plotted in the middle. “+” indicates the mean value (N = 30 cells from two independent cultures). (C) Northern blot of mRNA transcripts of the coding and mirror regions of CYTB and ND5 in the fibroblast cell lines (top). Nuclear 7SL RNA was used as a loading control. Schematic representing the coding and mirror regions that were probed for CYTB and ND5 (bottom). Coding genes: green arrows. Coding regions for tRNAs: pink arrows. (D) Immunofluorescence of dsRNA in WT fibroblasts treated with the indicated siRNA for 48 h and imaged by confocal microscopy. The mitochondrial network was immunostained with anti-TOMM20. DAPI staining shown in blue (scale bar: 20 μm). (E) Immunofluorescence of dsRNA in WT, NME6 KO, and NME6 KO HeLa cells expressing NME6-MycFlag or NME6H137N-MycFlag and imaged by confocal microscopy. DAPI staining shown in blue (scale bar: 20 μm). (E, F) Scatter plot of mean mt-dsRNA intensity per cell quantified from confocal images as shown in (E) (N = 100–120 cells from two independent cultures). The one-way ANOVA test was used to determine P-values compared with WT. P-value (WT versus NME6 KO) < 0.0001, P-value (WT versus NME6 KO + WT) = 0.0013, P-value (WT versus NME6 KO + H137N) < 0.0001. Horizontal lines indicate the mean value and error bars indicate the SD. (G) Immunofluorescence of dsRNA in WT and NME6 KO HeLa cells incubated with 100 μM nucleosides for 5 d and imaged by confocal microscopy. DAPI staining shown in blue (scale bar: 20 μm). (G, H) Scatter plot of mean mt-dsRNA intensity per cell quantified from confocal images as shown in (G) (N = 100–120 cells from two independent cultures). The Mann-Whitney t test was used to determine the P-value between NME6 KO versus NME6 KO + nuc. P-value < 0.0001. Horizontal lines indicate the mean value and error bars indicate the SD. Source data are available for this figure.
Figure S3.
Figure S3.. Imaging of MRG proteins and the impact of degradosome or NME6 knockdown on mt-dsRNA levels.
(A) Immunofluorescence of FASTKD2 and GRSF1 in the indicated fibroblast cell lines imaged by confocal microscopy. DAPI staining shown in blue (scale bar: 20 μm). (B) Scatter plot of mean mitochondrial J2 intensity per cell quantified from confocal images as shown in (Fig 2D). The one-way ANOVA test was used to determine P-values compared with siLuc. P-value (siLuc versus siSUV3) < 0.0001, P-value (siLuc versus siPNPase) < 0.0001 (N = 100 cells from two independent cultures). (C) Immunofluorescence of NME6 and dsRNA in HeLa cells (top) and U2OS cells (bottom) treated with the indicated siRNA for 48 h, imaged by confocal microscopy. DAPI staining is shown in blue (scale bar: 20 μm). (D) Immunofluorescence of dsRNA in WT fibroblasts incubated with 100 μM nucleosides for 5 d and imaged by confocal microscopy. The mitochondrial network was labelled with MitoTracker (MitoT) Deep Red. DAPI staining shown in blue (scale bar: 20 μm).
Figure 3.
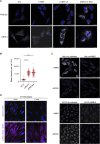
Figure 3.. Mt-dsRNA homeostasis is dependent on cell-cycle progression.
(A) Immunofluorescence of dsRNA in WT HeLa and NME6 KO cells after double thymidine block (DTB) treatment and subsequent release for 2 or 4 h imaged by confocal microscopy. DAPI staining is shown in blue (scale bar: 20 μm). (A, B) Scatter plot of mean dsRNA intensity per cell quantified from confocal images as shown in (A) (N = 100–110 cells from two independent cultures). A one-way ANOVA test was used to determine P-values compared with untreated samples in each cell line. P-value (WT versus WT-DTB) < 0.0001, P-value (WT versus WT −2 h) < 0.0001, P-value (WT versus WT-4 h) = 0.008, P-value (KO versus KO-DTB) > 0.9999, P-value (KO versus KO-2 h) = 0.1011, P-value (KO versus KO-4 h) < 0.0001. Horizontal lines indicate the mean value and error bars indicate the SD. (C) Unsynchronised cell populations of WT HeLa and NME6 KO imaged by confocal microscopy. Cells in G1 (blue), S (magenta), and G2 (green) phases are delineated according to DAPI, EdU, and cyclin-A detection, respectively (scale bar: 20 μm). (C, D) Scatter plot of mt-dsRNA integrated intensity per cell quantified from confocal images as shown in (C) (N = 100–110 cells from two independent cultures). A one-way ANOVA test was used to determine P-values compared with WT and KO for cell-cycle phases in each cell line. P-value (WT G1 versus WT S) < 0.0001, P-value (WT G1 versus WT G2) < 0.0001, P-value (KO G1 versus KO S) < 0.0001, P-value (KO G1 versus KO G2) <0.0001. Bars indicate the mean and the error bars indicate the SD. (C, E) Scatter plot of the cytoplasmic area per cell quantified from confocal images as shown in (C) (N = 100–110 cells from two independent cultures). A one-way ANOVA test was used to determine P-values compared with WT and KO for cell-cycle phases in each cell line. P-value (WT G1 versus WT S) < 0.0001, P-value (WT G1 versus WT G2) < 0.0001, P-value (KO G1 versus KO S) < 0.0001, P-value (KO G1 versus KO G2) <0.0001. Bars indicate the mean and the error bars indicate the SD.
Figure 4.
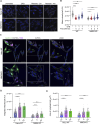
Figure 4.. Synthesis of mitochondrial single-stranded RNA and dsRNA is coupled to cellular proliferation in fibroblasts.
(A) hTERT fibroblasts were treated with basic FGF (10 ng/ml), aphidicolin (Aph; 6 μM), or a combination of both. Cell proliferation was measured by confluency (N = 3 independent cultures; points indicate mean and error bars represent SD). (B) Immunofluorescence of dsRNA in hTERT fibroblasts treated with FGF/Aph for 48 h and BrU for 1 h and imaged by confocal microscopy. The mitochondrial network was labelled with MitoTracker DeepRed (MitoT; magenta). DAPI staining shown in blue (scale bar: 20 μm). (C) Scatter plot of mean BrU intensity per cell quantified from confocal images as shown in (Fig S4A) (N = 92–111 cells from two independent cultures). A one-way ANOVA test was used to determine P-values compared with DMSO. P-value (DMSO versus Aph) = 0.0130, P-value (DMSO versus FGF) < 0.0001, P-value (DMSO versus FGF + Aph) < 0.0001. Horizontal lines indicate the mean value and error bars indicate the SD. (D) Scatter plot of mean mt-dsRNA intensity per cell quantified from confocal images as shown in (B) (N = 89–111 cells from two independent cultures). A one-way ANOVA test was used to determine P-values compared to DMSO. P-value (DMSO versus Aph) = 0.2653, P-value (DMSO versus FGF) < 0.0001, P-value (DMSO versus FGF + Aph) = 0.0735. Horizontal lines indicate the mean value and error bars indicate the SD. (E) Heatmap showing relative RNA expression of heavy and light mitochondrial transcripts from hTERT fibroblasts treated with FGF/Aph for 48 h as measured by strand-specific RT-qPCR. Fold changes versus mean DMSO values for each transcript are shown. Cq values were normalised against GAPDH (N = 3 independent cultures). One-way ANOVA analysis was performed for each transcript among the four conditions and the resulting P-value is indicated below. (F) mtDNA levels of hTERT fibroblasts treated with FGF/Aph for 48 h as measured by qPCR of the indicated mtDNA regions, MT-RNR1 and MT-CYTB. Cq values were normalised against nuclear ACTB (N = 3 independent cultures). Bars indicate the mean and the error bars represent the SD. Individual data points are shown as grey circles. (G) Immunoblot analysis of mitochondrial and MRG-associated proteins in whole-cell lysates obtained from hTERT fibroblasts treated with FGF/Aph for 48 h. Samples were blotted on different membranes which are indicated by the dotted lines. Source data are available for this figure.
Figure S4.
Figure S4.. Further analysis of the mitochondrial response to FGF treatment.
(A) Immunofluorescence of BrU in hTERT fibroblasts treated with FGF/Aph for 48 h and BrU for 1 h and imaged by confocal microscopy. The mitochondrial network was labelled with MitoTracker DeepRed. DAPI staining is shown in blue (scale bar: 20 μm). (B) Northern blot of mRNA transcripts of the coding and mirror regions of CYTB in hTERT fibroblasts treated with FGF/Aph for 48 h. Nuclear 7SL RNA was used as a loading control. (B, C) Scatter plot of the total mitochondrial network area per cell from confocal images as shown in (B). The one-way ANOVA test was used to determine P-values compared with DMSO. P-value (DMSO versus Aph) < 0.0001, P-value (DMSO versus FGF) > 0.9999, P-value (DMSO versus FGF + Aph) < 0.0001 (Number of cells for each cell line = 108, from two independent cultures). Horizontal lines indicate the mean value and error bars indicate the SD. Source data are available for this figure.
Figure 5.
Figure 5.. Immunodetection of dsRNA in human tissue.
(A) Immunofluorescence of mt-dsRNA with anti-J2 and anti-9D5 antibodies in U2OS cells imaged by confocal microscopy. The mitochondrial network was labelled with MitoTracker (MitoT) DeepRed (scale bar: 20 μm). The region indicated by a white dotted box on the confocal image was re-imaged with greater resolution with the mitochondrial area outlined (scale bar: 5 μm). The mitochondrial region was straightened as a line scan with the intensity of J2 and 9D5 plotted below. (B) Immunofluorescence of mt-dsRNA with anti-J2 and anti-9D5 antibodies in U2OS cells treated with either IMT1 (10 μM for 3 h) or RNAse III after fixation. The mitochondrial network was labelled with MitoTracker (MitoT) DeepRed (scale bar: 20 μm; zoom scale bar: 5 μm). (C) An FFPE section of human colorectal adenocarcinoma was segmented into normal (blue), dysplastic (red), and stroma (yellow, hatched) regions. Subsequent sections of the sample were incubated with anti-9D5 with and without RNase III treatment or anti-ATP5A and visualised with DAB staining (brown). Haematoxylin was used as a counterstain (scale bar 0.5 mm). (D) An FFPE section of normal human lung tissue (top row; scale bar 1 mm) and human lung adenocarcinoma (bottom row; scale bar 2 mm) was segmented into normal (blue), adenocarcinoma (red), necrotic (pink), and stroma (yellow, hatched) regions. Subsequent sections of the sample were incubated with anti-9D5 with and without RNase III treatment or anti-ATP5A and visualised with DAB staining (brown). Haematoxylin was used as a counterstain.
Figure S5.
Figure S5.. Quantification of 9D5 and J2-labelled foci.
(A) Scatter plot of mean mitochondrial 9D5 intensity per cell quantified from confocal images as shown in Fig 5B. The one-way ANOVA test was used to determine P-values compared with untreated cells. P-value (untreated vs + IMT1) = 0.0003, P-value (untreated vs + RNase III) < 0.0001 (N = 100 cells from two independent cultures). (B) Scatter plot of mean mitochondrial J2 intensity per cell quantified from confocal images as shown in Fig 5B. The one-way ANOVA test was used to determine P-values compared with untreated cells. P-value (untreated vs + IMT1) = 0.0002, P-value (untreated vs + RNase III) < 0.0001 (N = 100 cells from two independent cultures).
Figure 6.
Figure 6.. Mt-dsRNA accumulates in human lung adenocarcinoma.
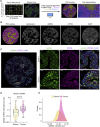
(A) Lung adenocarcinoma tissue microarrays (TMAs) consisting of three biopsy cores from 80 patients each were used for multiplex staining of cytokeratin, dsRNA, ATP5A, and DAPI. The immunostaining was used to annotate and train a deep learning algorithm to identify regions of interest (ROIs) as “tumour,” “stroma,” and “necrosis” shown in pink, yellow, and blue overlays, respectively. Individual cells were segmented within the ROIs. (A, B) A representative core from lung adenocarcinoma TMA showing the ROI overlay as annotated in (A). Individual staining with anti-cytokeratin, anti-dsRNA, anti-ATP5A, and DAPI shown in grayscale (scale bar: 200 μm). (C) Representative core from lung adenocarcinoma TMA showing staining with anti-dsRNA (green), anti-ATP5A (magenta), and DAPI (blue) (scale bar: 200 μm). Regions of tumour epithelia are indicated by white boxes which are zoomed in on the right (scale bar: 5 μm). (D) Box and whiskers plot of median cytoplasmic dsRNA intensity in stroma and tumour regions per core. Whiskers represent minimum and maximum values. Boxes extend from the 25th to the 75th percentile with the median plotted in the middle (N = 223 cores detected with stroma regions, N = 221 cores detected with tumour regions). The Mann-Whitney t test was used to determine the P-value between stroma versus tumour; P-value < 0.0001 (E) Density plot of the distribution of cytoplasmic dsRNA intensity per segmented cell in stroma and tumour ROIs (N = 686,546 cells detected within stroma ROIs, N = 761,319 cells detected within tumour ROIs).
Figure S6.
Figure S6.. Additional examples of lung adenocarcinoma and normal lung cores.
(A) Representative core from lung adenocarcinoma TMA immunostained with anti-cytokeratin (yellow), anti-dsRNA (green), anti-ATP5A (magenta), and stained with DAPI (blue) (scale bar: 200 μm). The region indicated by a white dotted box was segmented between stroma (yellow) and tumour (pink) regions of interest as shown (top row). Individual channels are shown in grayscale (below). Green arrows point to the stromal region populated by immune cells (scale bars = 50 μm). (B) Core of normal lung tissue stained with anti-cytokeratin, anti-dsRNA, anti-ATP5A, and DAPI. All images are shown in grayscale (scale bar: 200 μm).

References

    1. Antonicka H, Sasarman F, Nishimura T, Paupe V, Shoubridge EA (2013) The mitochondrial RNA-binding protein GRSF1 localizes to RNA granules and is required for posttranscriptional mitochondrial gene expression. Cell Metab 17: 386–398. 10.1016/j.cmet.2013.02.006 - DOI - PubMed
    1. Antonicka H, Choquet K, Lin ZY, Gingras AC, Kleinman CL, Shoubridge EA (2017) A pseudouridine synthase module is essential for mitochondrial protein synthesis and cell viability. EMBO Rep 18: 28–38. 10.15252/embr.201643391 - DOI - PMC - PubMed
    1. Antonicka H, Lin ZY, Janer A, Aaltonen MJ, Weraarpachai W, Gingras AC, Shoubridge EA (2020) A high-density human mitochondrial proximity interaction network. Cell Metab 32: 479–497.e9. 10.1016/j.cmet.2020.07.017 - DOI - PubMed
    1. Bonekamp NA, Peter B, Hillen HS, Felser A, Bergbrede T, Choidas A, Horn M, Unger A, Di Lucrezia R, Atanassov I, et al. (2020) Small-molecule inhibitors of human mitochondrial DNA transcription. Nature 588: 712–716. 10.1038/s41586-020-03048-z - DOI - PubMed
    1. Borowski LS, Dziembowski A, Hejnowicz MS, Stepien PP, Szczesny RJ (2013) Human mitochondrial RNA decay mediated by PNPase–hSuv3 complex takes place in distinct foci. Nucleic Acids Res 41: 1223–1240. 10.1093/nar/gks1130 - DOI - PMC - PubMed

MeSH terms

Associated data

LinkOut - more resources