. 2024 Aug 29;15(1):7483.
doi: 10.1038/s41467-024-51718-7.

Adipocyte deletion of the oxygen-sensor PHD2 sustains elevated energy expenditure at thermoneutrality

Affiliations

Adipocyte deletion of the oxygen-sensor PHD2 sustains elevated energy expenditure at thermoneutrality

Rongling Wang et al. Nat Commun. .

Abstract

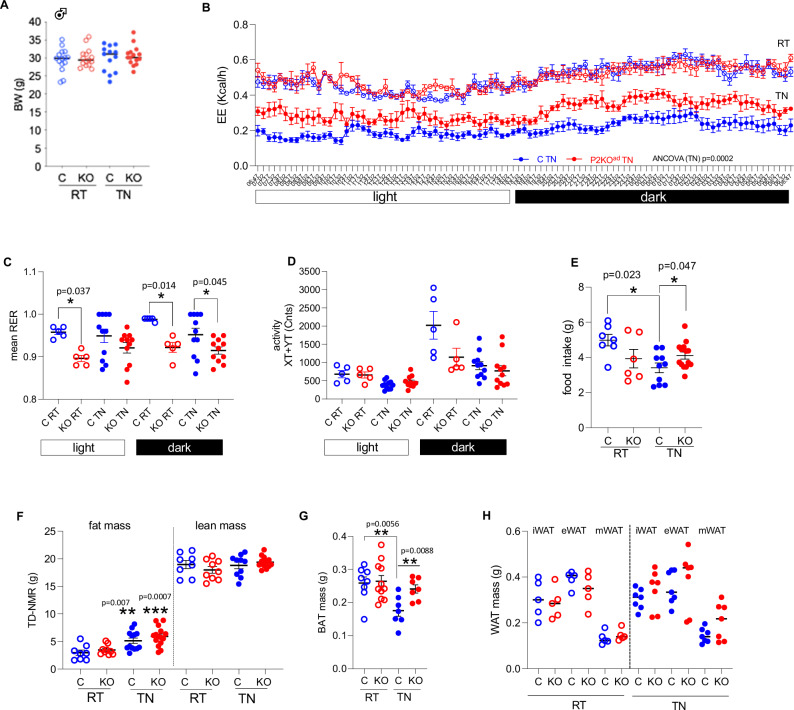
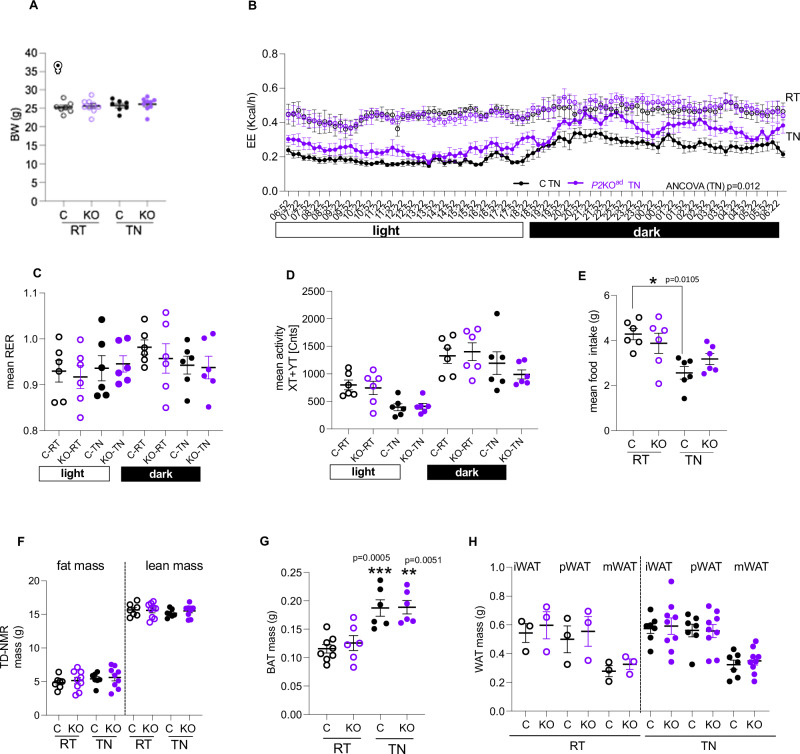
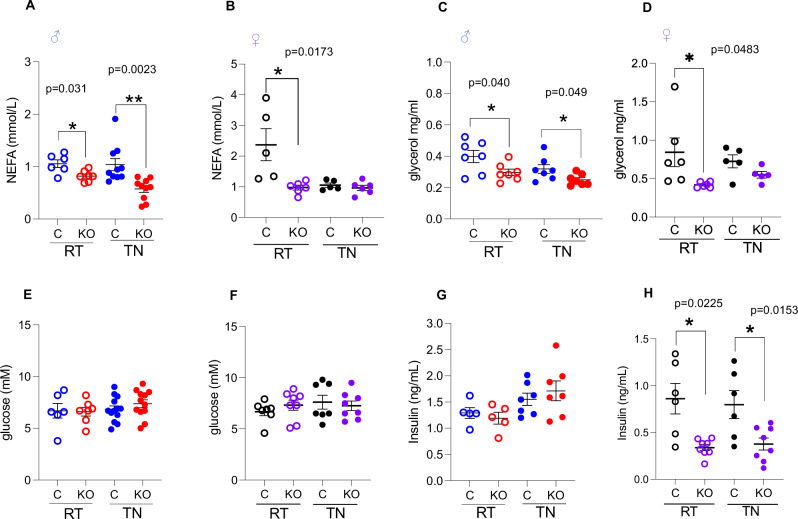
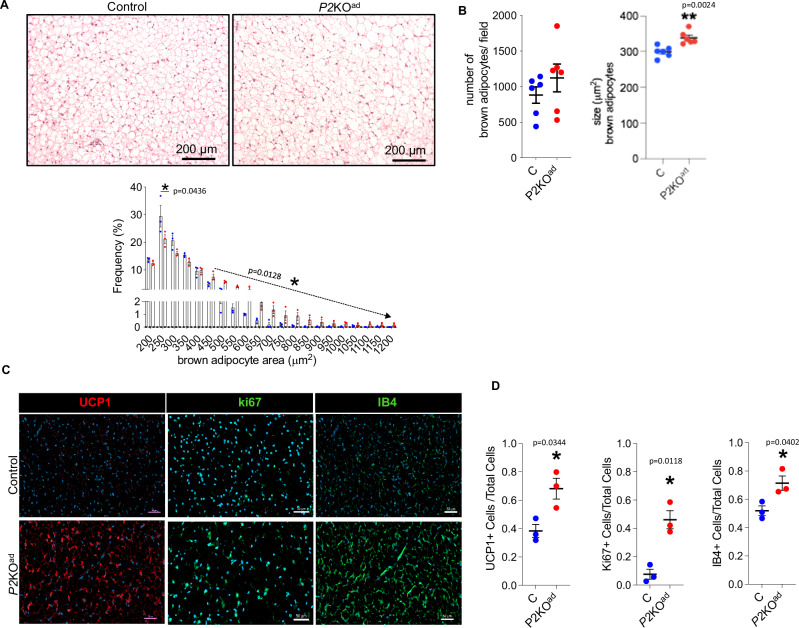
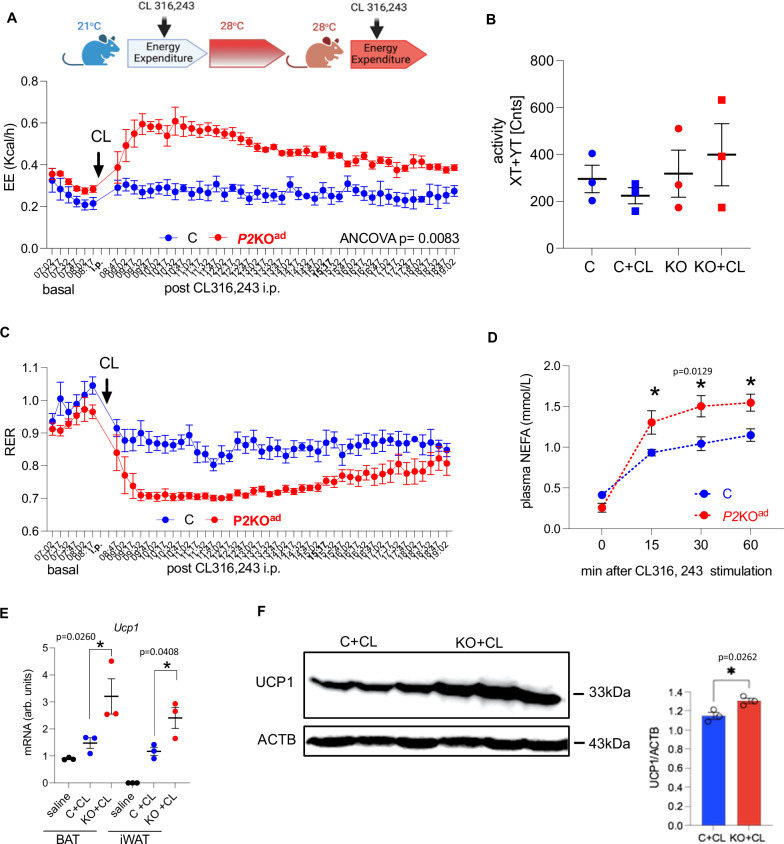
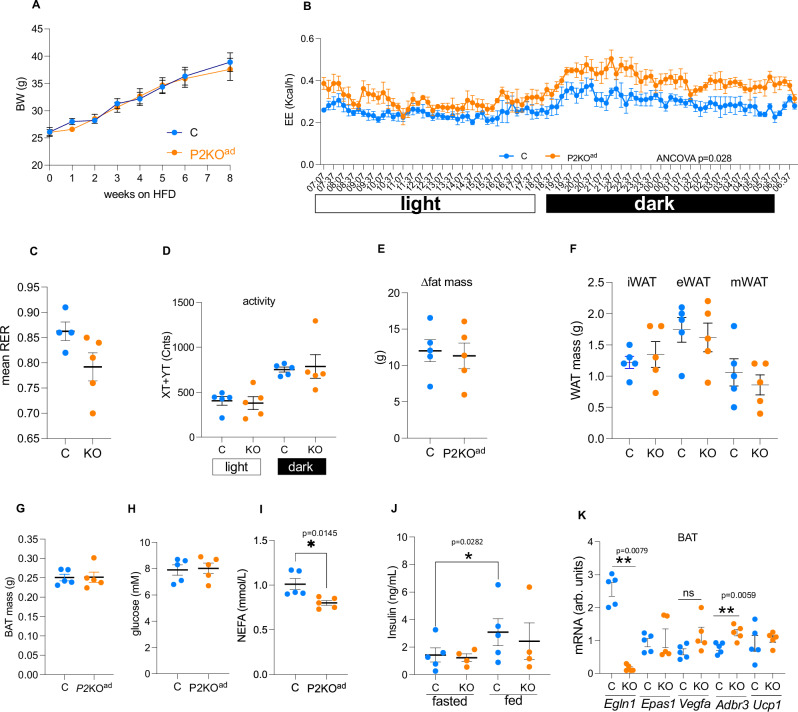
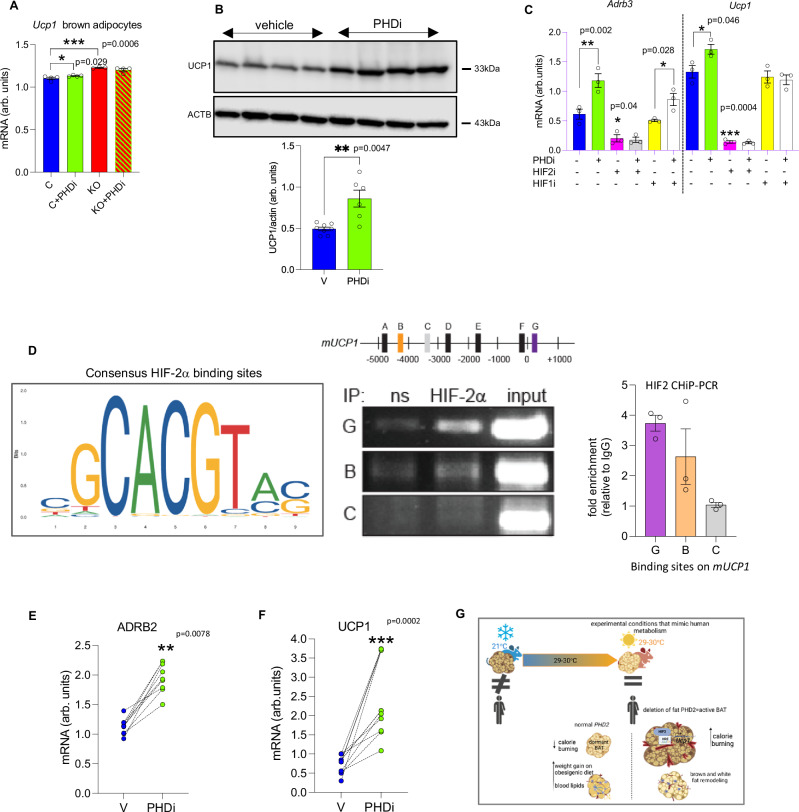
Enhancing thermogenic brown adipose tissue (BAT) function is a promising therapeutic strategy for metabolic disease. However, predominantly thermoneutral modern human living conditions deactivate BAT. We demonstrate that selective adipocyte deficiency of the oxygen-sensor HIF-prolyl hydroxylase (PHD2) gene overcomes BAT dormancy at thermoneutrality. Adipocyte-PHD2-deficient mice maintain higher energy expenditure having greater BAT thermogenic capacity. In human and murine adipocytes, a PHD inhibitor increases Ucp1 levels. In murine brown adipocytes, antagonising the major PHD2 target, hypoxia-inducible factor-(HIF)-2a abolishes Ucp1 that cannot be rescued by PHD inhibition. Mechanistically, PHD2 deficiency leads to HIF2 stabilisation and binding of HIF2 to the Ucp1 promoter, thus enhancing its expression in brown adipocytes. Serum proteomics analysis of 5457 participants in the deeply phenotyped Age, Gene and Environment Study reveal that serum PHD2 associates with increased risk of metabolic disease. Here we show that adipose-PHD2-inhibition is a therapeutic strategy for metabolic disease and identify serum PHD2 as a disease biomarker.


Conflict of interest statement

L.L.J. is an employee and stockholder of Novartis. V.E. V.G. C.J.S., N.M.M, R.H.S, M.G.S, T.C., R.G.M., I.P.C, K.F., R.W., C.B., M.C., A.C., T.J.S, S.G., M.M.P., I.K., S.G., T.J.S., and Z.M. declare no competing interests.

Figures

Fig. 1
Fig. 1. Adipose-Phd2 deletion in male mice sustains higher energy expenditure at thermoneutrality.
A P2KOad (KO, red) mice housed at RT (21 °C, n = 15) or acutely switched to TN (28–29 °C, 7 days) sustain similar body weight (BW) to control (C, blue, n = 13) littermates. B P2KOad mice have higher energy expenditure (EE) at TN (n = 6/group) and C lower respiratory exchange ratio (RER, RT: n = 5/group; TN: n = 11/group). D Similar activity levels in both genotypes (RT: n = 5/group; TN: n = 11/group). E KO (RT: n = 6; TN: n = 14) eat more than C (RT: n = 7; TN: n = 14) mice at TN. F Despite similar fat and lean mass in both genotypes measured by time-domain (TD) NMR (RT: n = 8/group; TN control: n = 10; TN KO: n = 11), G P2KOad mice have bigger BAT mass (C RT: n = 8; KO RT: n = 11; C TN: n = 7; KO TN: n = 7) but H similar WAT mass (RT: n = 5/group; TN: n = 7/group), biological replicates. Data are presented as mean + /− SEM. *P < 0.05, **P < 0.01 by Student t test (two-tailed). For EE, ANCOVA was performed with BW as covariance. Source data are provided as a Source Data file.
Fig. 2
Fig. 2. Adipose-Phd2 deletion in females sustains higher energy expenditure at thermoneutrality.
A P2KOad (KO, purple) mice housed at 20–21 °C (RT, n = 9) when acutely switched to 28–29 °C (TN, 7 days) sustain similar body weight (BW) to control (C, black, n = 7) littermates but B have higher energy expenditure (n = 6/group). C Similar respiratory exchange ratio (n = 6/group) and D activity levels (n = 6/group). E Control mice reduce, but KO sustain food intake at TN (n = 6/group). F Similar fat and lean mass measured by TD-NMR (C: n = 7 and KO: n = 9) in both genotypes. G Similar BAT mass (*** indicates comparisons of RT with TN; RT C: n = 8, KO: n = 6 and TN: n = 6/group) and H WAT mass (i inguinal, p parametrial, m mesenteric, RT: n = 3/group; TN C: n = 7 and KO: n = 9) in both genotypes. n indicates biological replicates. Data are presented as mean + /− SEM. *P < 0.05, **P < 0.01, ***P < 0.001 by paired (AF) or unpaired (G, H) Student t test (two-tailed). For EE, ANCOVA was performed with BW as covariance. Source data are provided as a Source Data file.
Fig. 3
Fig. 3. Metabolic parameters in male and female P2KOad mice housed at room temperature (RT) and thermoneutrality (TN).
A, B Plasma non-esterified fatty acids, C, D glycerol, E, F glucose and G, H insulin levels. Males, NEFA: control RT n = 6, TN n = 10, KO RT n = 7 TN n = 10, glycerol: n = 7/group, glucose: control RT n = 6 TN n = 13, KO RT n = 7, TN n = 12, insulin: RT n = 5/group, TN n = 7/group). Females, NEFA: control n = 5, KO n = 6; glycerol: control n = 5, KO n = 5; glucose: control n = 7, KO n = 8; insulin: control n = 6, KO n = 8). Data are presented as mean + /− SEM. N represents biological replicates. *P < 0.05, **P < 0.01 by Student t test (two-tailed). Source data are provided as a Source Data file.
Fig. 4
Fig. 4. P2KOad male mice maintain functional BAT at thermoneutrality.
A H&E staining of BAT and frequency distribution of small and large adipocytes (n = 3/group, biological replicates). B Quantification graphs of number and size of brown adipocytes in P2KOad (red) and control littermates (blue). The adipocyte number/size is per microscopic field (total of 6 fields per animal analysed, n = 6/group, biological replicates). C Immunofluorescence images (scale bars 50 µm) and D quantification graphs of BAT stained for UCP1+ (red) and ki67+ and IB4+ (green) cells at TN (n = 3/group, biological replicates). Nuclei stained with DAPI (blue). Data are presented as mean + /− SEM. *P < 0.05, by Student t test (two-tailed). A Source data are provided as a Source Data file.
Fig. 5
Fig. 5. P2KOad mice show higher sensitivity to CL316,234-induced EE at thermoneutrality.
A P2KOad (KO, red, n = 3) and control (C, blue, n = 3) mice were challenged with CL316,243 i.p. (CL; 1 mg/g BW) at RT (21 °C). Then switched to TN housing (28 °C) and administered second CL i.p. CL given under TN conditions led to higher energy expenditure in P2KOad mice, B similar activity levels in both genotypes, C lower respiratory exchange ratio in P2KOad mice, D higher sensitivity to CL-induced NEFA release in P2KOad mice, E higher CL-induced Ucp1 mRNA expression in BAT and iWAT in P2KOad mice and F higher CL-induced UCP1 protein levels in P2KOad BAT. Data are presented as mean + /- SEM. *P < 0.05, **P < 0.01 by Student t test (two-tailed) or one-way ANOVA (E). For EE, ANCOVA was performed with body weight as co-variant. A Experimental design image was created with BioRender.com released under a Creative Commons Attribution-Non Commercial-NoDerivs 4.0 International license. Source data and uncropped blots are provided as a Source Data file.
Fig. 6
Fig. 6. P2KOad mice retain higher EE after high fat feeding at thermoneutrality.
A P2KOad (orange, n = 5) and control (C, light blue, n = 5) mice were fed high fat diet (58% kcal from fat) while housed at TN (28–29 °C) for 8 weeks had similar body weight gain. B Higher energy expenditure in high fat fed P2KOad at TN. C Similar respiratory exchange ratio, D activity levels, E fat mass gain by TD-NMR, F WAT and G BAT weights after high fat feeding. H Plasma glucose, I NEFA and J insulin levels. K mRNA levels of HIF-target and thermogenic genes in BAT after high fat feeding at TN. Data are presented as mean + /− SEM. *P < 0.05, **P < 0.01, Student t test (two-tailed). ns; no statistically significant. Source data are provided as a Source Data file.
Fig. 7
Fig. 7. Pharmacological pan-PHD inhibition induces Ucp1 expression in mouse and human adipocytes in vitro.
A P2KOad (red bars) brown adipocytes have higher Ucp1 mRNA levels than control (blue bars) mice and treatment with PHDi (FG2216, 10 µM, 16 h, n = 4, biological replicates) increases Ucp1 levels only in control brown adipocytes (green bars). The mouse brown adipocyte cell line (WT-1) treated with PHDi (10 µM, 16 h, n = 6; green bars) shows higher B UCP1 protein levels (n = 4, biological replicates) compared to vehicle (DMSO, n = 4; blue bars). C mRNA levels of Adrb3 and Ucp1 are higher in the PHDi treated (green bars) WT-1 cells. Treatment with the HIF-2a antagonist (PT-2385, 10 µM, 16 h; pink bars) suppresses the effect (n = 3/group) in contrast to the HIF-1a antagonist (PX-478, 10 µM, 16 h; yellow bars). D Schematic represents mUCP1 promoter region showing relative positions of putative HIF-2a response elements (identified using JASPAR). A–G represent putative HIF2a response elements at A; −4943, B; −4313, C; −3334, D; −2788, E; −1857, F; −120, G; +250, relative to the transcriptional start site ( + 1). ChIP performed on chromatin from WT-1 cells in hypoxia (1% O2, 6 h). PCR was performed using primer sets that amply regions covering putative HIF-2a response elements as outlined in schematic. Lettering represents sites G; +250 (recruitment), B; −4313 (recruitment) and C; −3334 (no recruitment). ns = non-specific control immunoglobulin, IP = immunoprecipitation. Input chromatin shown (1/10 dilution relative to IP PCR). Graph represents HIF-2a fold enrichment on mUCP1 promoter compared to non-specific control immunoglobulin. E, F Human adipocytes isolated from abdominal subcutaneous biopsies treated with PHDi (10 µM, 16 h, n = 3 biopsies; 3 replicates per biopsy) show increased ARB2 and UCP1 mRNA expression. Data are presented as mean + /− SEM. *P < 0.05, **P < 0.01, ***P < 0.001 by Student t test (two-tailed). G illustrates that adipocyte-PHD2 deletion leads to HIF-2a activation, which in turn regulates the thermogenic pathway by sustained uncoupling protein (UCP)-1 expression and enhanced responsiveness of brown adipose tissue (BAT) under conditions where BAT is normally supressed. G was created with BioRender.com released under a Creative Commons Attribution-Non Commercial-NoDerivs 4.0 International license. Source data are provided as a Source Data file.

References

    1. Chen, K. Y. et al. Opportunities and challenges in the therapeutic activation of human energy expenditure and thermogenesis to manage obesity. J. Biol. Chem.295, 1926–1942 (2020). 10.1074/jbc.REV119.007363 - DOI - PMC - PubMed
    1. Marlatt, K. L. & Ravussin, E. Brown adipose tissue: an update on recent findings. Curr. Obes. Rep.4, 389–396 (2017).10.1007/s13679-017-0283-6 - DOI - PMC - PubMed
    1. Kajimura, S., Spiegelman, B. & Seale, P. Brown and beige fat: physiological roles beyond heat generation. Cell Metab.22, 546–559 (2015). 10.1016/j.cmet.2015.09.007 - DOI - PMC - PubMed
    1. Overton, J. M. Phenotyping small animals as models for the human metabolic syndrome: thermoneutrality matters. Intern. J. Obes.34, S53–S58 (2010).10.1038/ijo.2010.240 - DOI - PubMed
    1. Speakman, J. R. & Keiher, J. Not so hot: optimal housing temperatures for mice to mimic the thermal environment of humans. Mol. Metab.2, 5–9 (2013).10.1016/j.molmet.2012.10.002 - DOI - PMC - PubMed

MeSH terms

Substances