. 2024 Aug 29;15(1):7504.
doi: 10.1038/s41467-024-51800-0.

Activation mechanisms of dimeric mechanosensitive OSCA/TMEM63 channels

Affiliations

Activation mechanisms of dimeric mechanosensitive OSCA/TMEM63 channels

Yuanyue Shan et al. Nat Commun. .

Abstract

OSCA/TMEM63 channels, which have transporter-like architectures, are bona fide mechanosensitive (MS) ion channels that sense high-threshold mechanical forces in eukaryotic cells. The activation mechanism of these transporter-like channels is not fully understood. Here we report cryo-EM structures of a dimeric OSCA/TMEM63 pore mutant OSCA1.1-F516A with a sequentially extracellular dilated pore in a detergent environment. These structures suggest that the extracellular pore sequential dilation resembles a flower blooming and couples to a sequential contraction of each monomer subunit towards the dimer interface and subsequent extrusion of the dimer interface lipids. Interestingly, while OSCA1.1-F516A remains non-conducting in the native lipid environment, it can be directly activated by lyso-phosphatidylcholine (Lyso-PC) with reduced single-channel conductance. Structural analysis of OSCA1.1-F516A in lyso-PC-free and lyso-PC-containing lipid nanodiscs indicates that lyso-PC induces intracellular pore dilation by attracting the M6b to upward movement away from the intracellular side thus extending the intracellular pore. Further functional studies indicate that full activation of MS OSCA/TMEM63 dimeric channels by high-threshold mechanical force also involves the opening of both intercellular and extracellular pores. Our results provide the fundamental activation paradigm of the unique transporter-like MS OSCA/TMEM63 channels, which is likely applicable to functional branches of the TMEM63/TMEM16/TMC superfamilies.


Conflict of interest statement

The authors declare no competing interests.

Figures
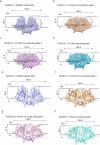
Fig. 1
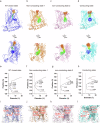
Fig. 1. Overall structural comparison of wildtype OSCA1.1 in lipid nanodiscs and three states of F516A in the detergent environment.
a Cryo-EM density map of non-conducting wild-type OSCA1.1 in lipid nanodiscs (8GRN [https://www.rcsb.org/structure/8GRN]) (purple) from the side view. The approximate extent of the phospholipid bilayer is shown as a thin black line. The length of the protein and the height of the TM helices are labeled. bd Three cryo-EM density maps of OSCA1.1-F516A in non-conducting state 1 (b, brown), non-conducting state 2 (c, pink), and conducting state (d, cyan) with lipid/detergent micelle from the side view. e Side view of the wild-type OSCA1.1 dimer model in the closed state (8GRN [https://www.rcsb.org/structure/8GRN]). Coloring follows the same scheme as in the density map. The protein is shown as a cartoon and the potential lipid in the central cavity is shown as spheres. fh Side view of OSCA1.1-F516A in non-conducting state 1 (f, brown), non-conducting state 2 (g, pink), and conducting state (h, cyan).
Fig. 2
Fig. 2. Structural comparison of the pore domain of wildtype OSCA1.1 and OSCA1.1-F516A.
a Side view of one wildtype OSCA1.1 protomer in the closed state (purple). The calculated pore profile is shown as colored dots using Hole2 software. bd Side views of one OSCA1.1-F516A protomer in non-conducting state 1 (b, brown), non-conducting state 2 (c, pink), and conducting state (d, cyan). e Van der Waals radii of the closed wildtype OSCA1.1 pore plotted against axial distance. The positions of the restrictive residues F516, Q398, F517, Y520, and K436 that are blocking the pore are marked by arrows. The diameter of the narrowest constriction site is less than 1 Å. fh Van der Waals radii of the non-conducting state 1 (f brown), non-conducting state 2 (g, pink), and conducting state (h, cyan) OSCA1.1-F516A pore plotted against axial distance. The diameter of the narrowest constriction site in non-conducting state 1 (f, brown), non-conducting state 2 (g, pink), and conducting state is 3 Å, 4 Å and 5 Å, respectively. i The positions of the restrictive residues F516, Q398, F517, Y520, and K436 (colored in red) in the closed wildtype OSCA1.1 pore (purple). The protein is shown as a cartoon with a gray surface. The central pore is shown as a red star. The lipid in the pore domain is shown as spheres. jl The positions of the hydrophobic residues F516, Q398, F517, Y520, and K436 (colored in red) in non-conducting state 1 (j, brown), non-conducting state 2 (k pink), and conducting state (l cyan).
Fig. 3
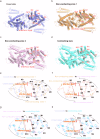
Fig. 3. Structure comparison of closed, non-conducting state 1, non-conducting state 2, and conducting state of dimeric OSCA1.1.
a Top view of closed OSCA1.1 colored in purple is shown as a cartoon. Helices are shown as cylinders and the interface lipid in the central cavity is shown as spheres. The 11 transmembrane helices M0 to M10 are labeled. bd Top view of OSCA1.1-F516A in non-conducting state 1 (b, brown), non-conducting state 2 (c, pink), and conducting state (d, cyan). e Superimposed top view of the transmembrane layer cross-section of wildtype OSCA1.1 in closed state (purple) and OSCA1.1-F516A in non-conducting state 1 (brown). The 11 transmembrane helices M0 to M10 are labeled and linked by a dashed curve in color following the same scheme used in transmembrane helices. The interface lipid is shown as a wavy line. The transmembrane helices exhibit a counterclockwise rotation from closed state to non-conducting state 1. M3 and M10 helices in closed state and non-conducting state 1 are linked by black lines and red lines, respectively. f Superimposed top view of the transmembrane layer cross-section of OSCA1.1-F516A in non-conducting state 1 (brown) and OSCA1.1-F516A in non-conducting state 2 (pink). M3 and M10 helices in non-conducting state 1 and non-conducting state 2 are linked by black lines and red lines, respectively. g Superimposed top view of the transmembrane layer cross-section of OSCA1.1-F516A in non-conducting state 2 (pink) and OSCA1.1-F516A in conducting state (blue). M3 and M10 helices in non-conducting state 2 and conducting state are linked by black lines and red lines, respectively. The interface lipids tended to dissociate from the central cavity in the OSCA1.1-F516A conducting state. h Superimposed top view of the transmembrane layer cross-section of wildtype OSCA1.1 in closed state (purple) and OSCA1.1-F516A in conducting state (blue). M3 and M10 helices in the closed state and conducting state are linked by black lines and red lines, respectively.
Fig. 4
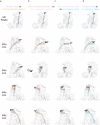
Fig. 4. The protomer extracellular pore blooming-like open.
a Superimposed side view of M0 (rotate around 3°), M3a (kink around 21°), M4a (kink around 23°), M5a (kink around 75°) and M6a (kink around 33°) deformation from wildtype OSCA1.1 in closed state (purple) to OSCA1.1-F516A in non-conducting state 1 (orange). The protomer is shown as a gray surface. b Superimposed side view of M0 (rotate around 2°), M3a (kink around 68°), M4a (kink around 28°), M5a (kink around 9°) and M6a (kink around 5°) deformation from OSCA1.1-F516A in non-conducting state 1 (orange) to OSCA1.1-F516A in non-conducting state 2 (pink). The view is the same as in a, except the view of M4a, getting rotated to show the bend angle clearly. c Superimposed side view of M0 (rotate around 1°), M3a (kink around 3°), M4a (kink around 10°), M5a (kink around 34°) and M6a (kink around 20°) deformation from OSCA1.1-F516A in non-conducting state 2 (pink) to OSCA1.1-F516A in conducting state (cyan). d Superimposed side view of M0 (rotate around 6°), M3a (kink around 75°), M4a (kink around 34°), M5a (kink around 79°) and M6a (kink around 46°) deformation from wildtype OSCA1.1 in closed state (purple) to OSCA1.1-F516A in conducting state (cyan).
Fig. 5
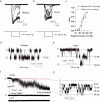
Fig. 5. Electrophysiological properties of OSCA1.1-F516A in native membrane.
a, b Representative negative pressure activated currents from the Piezo1 knock out HEK293T cell expressing full-length wild-type OSCA1.1 (a) or OSCA1.1-F516A (b) at the holding potential of −60 mV in the cell-attached mode. Negative pressure was applied from −50 to −200 mmHg with −25 mmHg per step and shown below the current traces. c Normalized currents from a and b were fitted with the Boltzmann equation. The half-activation pressure is −124 ± 3 mmHg for OSCA1.1-F516A (red, square), and −136 ± 6 mmHg for wildtype OSCA1.1 (black, circle) in HEK293-P1KO cells under the same pipette condition of 14 MΩ. (n = 3 independent cells, data are present as mean ± SEM). d, e Negative pressure (−60 mmHg) activated single-channel currents of wildtype (d) and OSCA1.1-F516A mutant (e) at the holding potential of −60 mV in the cell-attached mode. The mechanically activated single-channel current of wildtype OSCA1.1 and OSCA1.1-F516A is ~−6 pA at a holding potential of −60 mV in HEK293-P1KO cells. f Top trace represents the 1 mM lyso-PC activated spontaneous OSCA1.1-F516A mutant current at the holding potential of −60 mV in the cell-attached mode. The two bottom traces stand for the empty vector and wildtype OSCA1.1 transfected HEK293-P1KO cell treated with the 1 mM lyso-PC, no significant single-channel current can be recorded. g, Enlargement of the red box shows lyso-PC activated single-channel OSCA1.1-F516A mutant currents. The lyso-PC-activated single-channel current of OSCA1.1-F516A is ~−6 pA at a holding potential of −60 mV in HEK293-P1KO cells.
Fig. 6
Fig. 6. Structure comparison of OSCA1.1-F516A with or without lyso-PC in lipid nanodiscs.
a, b Cryo-EM density map of OSCA1.1-F516A in lipid nanodiscs with (b, yellow) or without lyso-PC (a, green) from the side view. The approximate extent of the phospholipid bilayer is shown as a thin black line. The length of the protein and the height of the transmembrane helices are labeled. ce Side view model of OSCA1.1-F516A in lipid nanodiscs with (d, yellow) or without (c, yellow) lyso-PC and their superimposed presentation (e). The M0 is marked as red and collapsed in the lyso-PC-containing structure. fh The M4 and M6 of OSCA1.1-F516A in lipid nanodiscs with (g, yellow) or without (f, yellow) lyso-PC. The lyso-PC induces a slight motion of the extracellular part of M4 and M6 as well as an upward rotation/movement of M6b of about 57 degrees. The critical residues for the conformational changes of M4 and M6 are labeled.
Fig. 7
Fig. 7. Electrophysiological properties of flexible kink residues and hinge residues of M6 in native membrane.
a The flexible kink residues at M3a, M4a, M5a and M6a are shown as spheres. b Normalized negative pressure activated currents were fitted with the Boltzmann equation. The half-activation pressure is −136 ± 6 mmHg for wildtype OSCA1.1 (black, circle), −174 ± 5 mmHg for OSCA1.1-P393A (red, square), −152 ± 10 mmHg for OSCA1.1-P511A (blue, rhombic), and beyond −200 mmHg for both OSCA1.1-P443A (pink, square) and OSCA1.1-G480A (green, triangle) in HEK293-P1KO cells under the same pipette condition of 14 MΩ. (n = 3 independent cells, data are present as mean ± SEM). c The flexible hinge residues at M6b are shown as spheres. d Normalized negative pressure activated currents were fitted with the Boltzmann equation. The half-activation pressure is −136 ± 6 mmHg for wildtype OSCA1.1 (black, circle), −151 ± 3 mmHg for OSCA1.1-E532A (red, square), −104 ± 4 mmHg for OSCA1.1-K537A (blue, rhombic), and −145 ± 5 mmHg for OSCA1.1-P538A (pink, square) in HEK293-P1KO cells under the same pipette condition of 14 MΩ. (n = 3 independent cells, data are present as mean ± SEM).
Fig. 8
Fig. 8. Proposed full activation model of the dimeric OSCA1.1 channel by mechanical force.
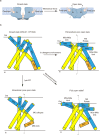
a, b The full activation model of the OSCA channel is shown in the cartoon. Force or high-osmolality shock may cause thinning of the local membrane, which may induce transmembrane helices deformation, and then the two OSCA protomers draw close. The interface lipid dissociated from the central cavity, and pore lipids are dislocated to the local membrane (a). Consequently, each monomeric pore undergoes a blooming-like opening of the extracellular pore and opening of the intracellular pore by upward movement of M6b (b).

Similar articles

Cited by

References

    1. Kefauver, J. M., Ward, A. B. & Patapoutian, A. Discoveries in structure and physiology of mechanically activated ion channels. Nature587, 567–576 (2020). 10.1038/s41586-020-2933-1 - DOI - PMC - PubMed
    1. Sukharev, S. I., Blount, P., Martinac, B., Blattner, F. R. & Kung, C. A large-conductance mechanosensitive channel in E. coli encoded by mscL alone. Nature368, 265–268 (1994). 10.1038/368265a0 - DOI - PubMed
    1. Maingret, F., Fosset, M., Lesage, F., Lazdunski, M. & Honore, E. TRAAK is a mammalian neuronal mechano-gated K+ channel. J. Biol. Chem.274, 1381–1387 (1999). 10.1074/jbc.274.3.1381 - DOI - PubMed
    1. Coste, B. et al. Piezo1 and Piezo2 are essential components of distinct mechanically activated cation channels. Science330, 55–60 (2010). 10.1126/science.1193270 - DOI - PMC - PubMed
    1. Zhang, M. et al. Structure of the mechanosensitive OSCA channels. Nat. Struct. Mol. Biol.25, 850–858 (2018). 10.1038/s41594-018-0117-6 - DOI - PubMed

LinkOut - more resources