. 2024 Aug 29;10(1):71.
doi: 10.1038/s41522-024-00545-1.

Spaceflight alters host-gut microbiota interactions

Affiliations

Spaceflight alters host-gut microbiota interactions

E Gonzalez et al. NPJ Biofilms Microbiomes. .

Abstract

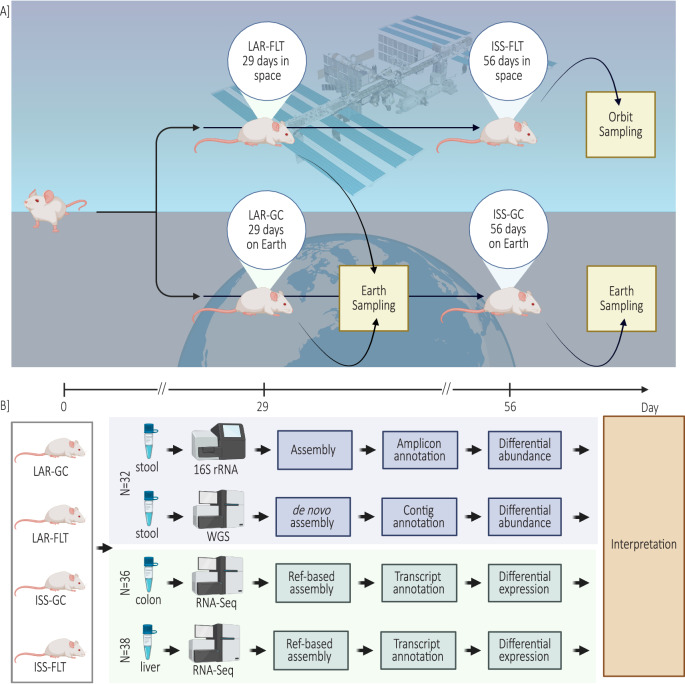
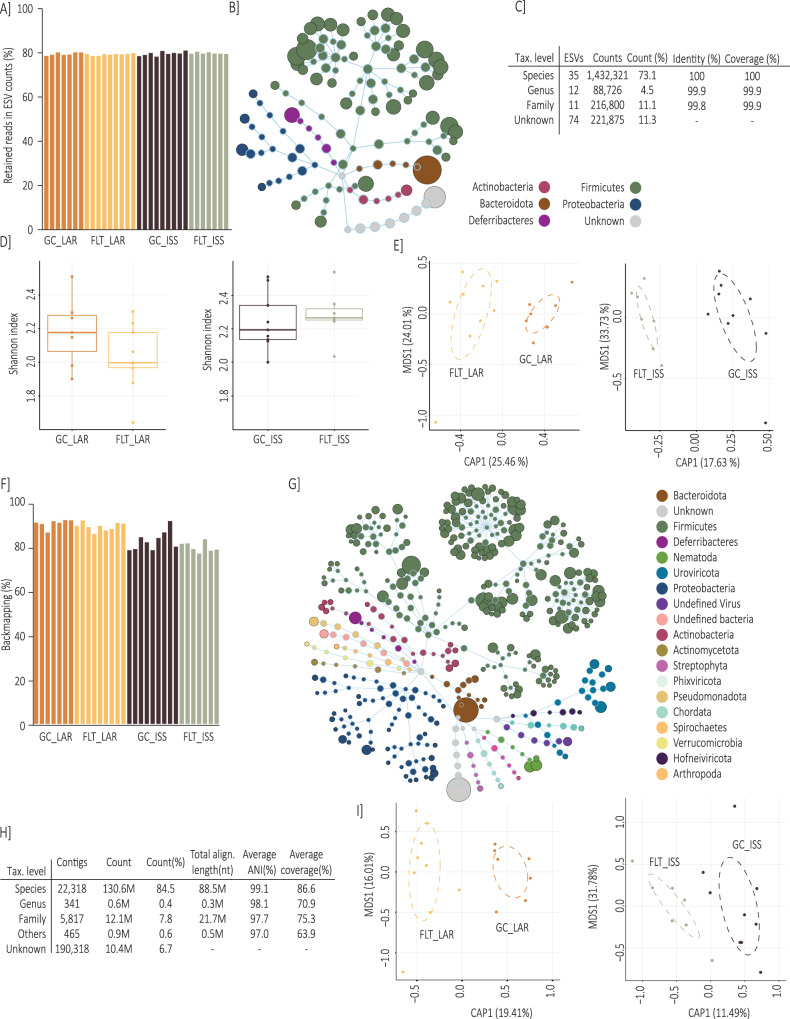
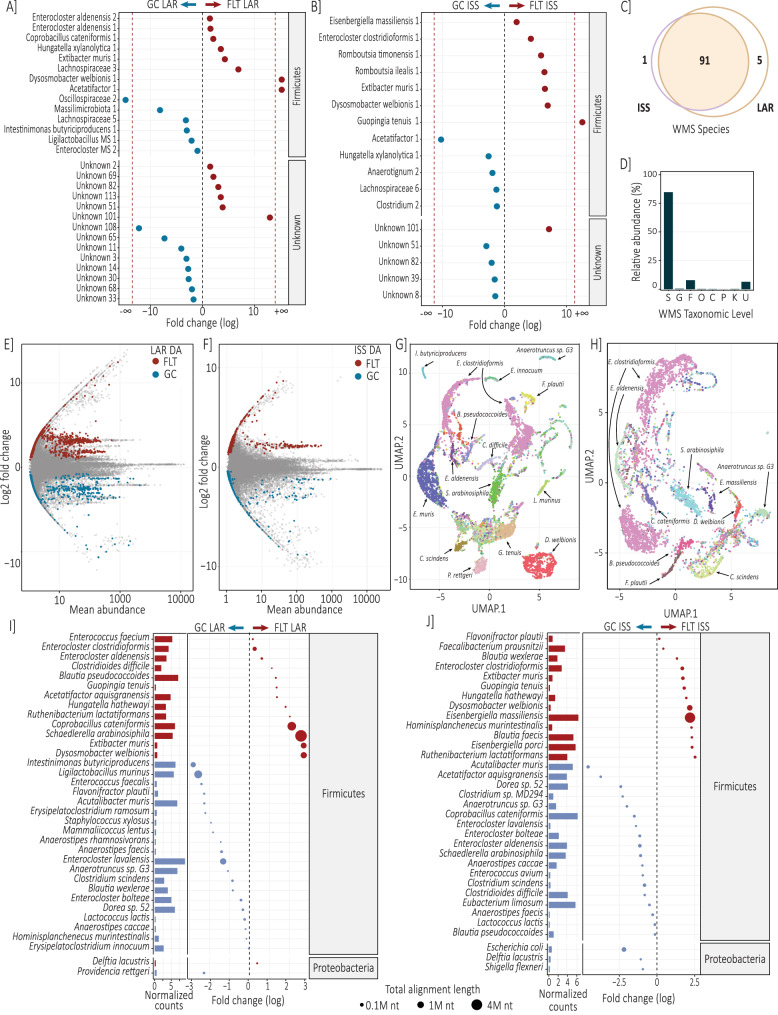
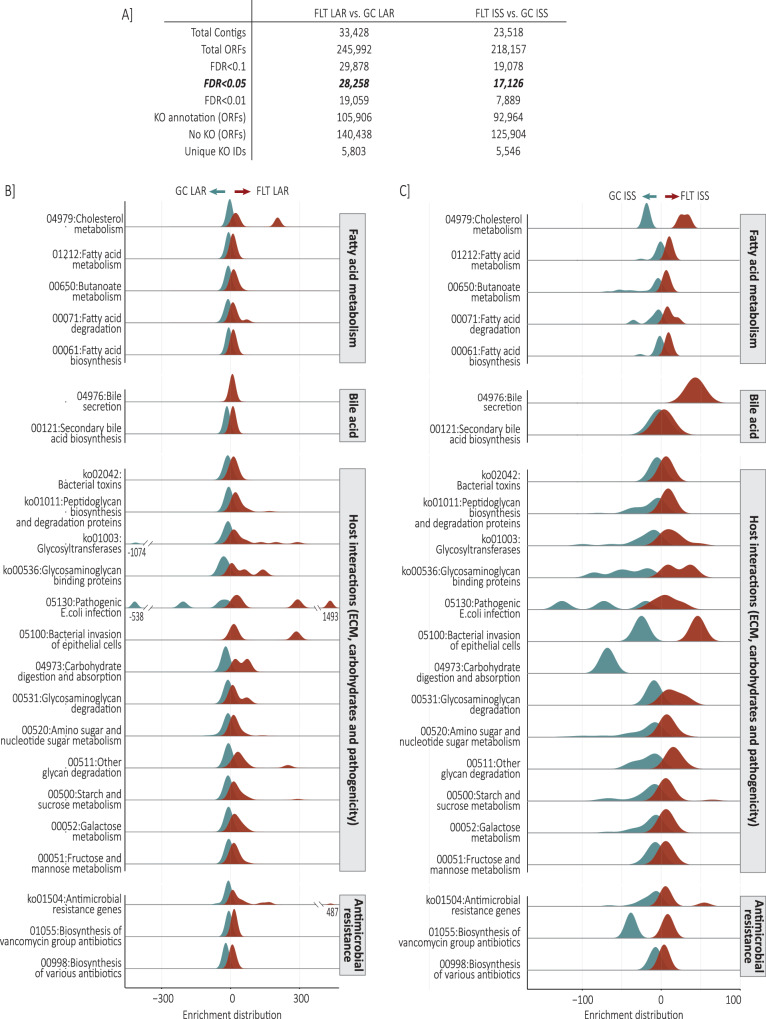
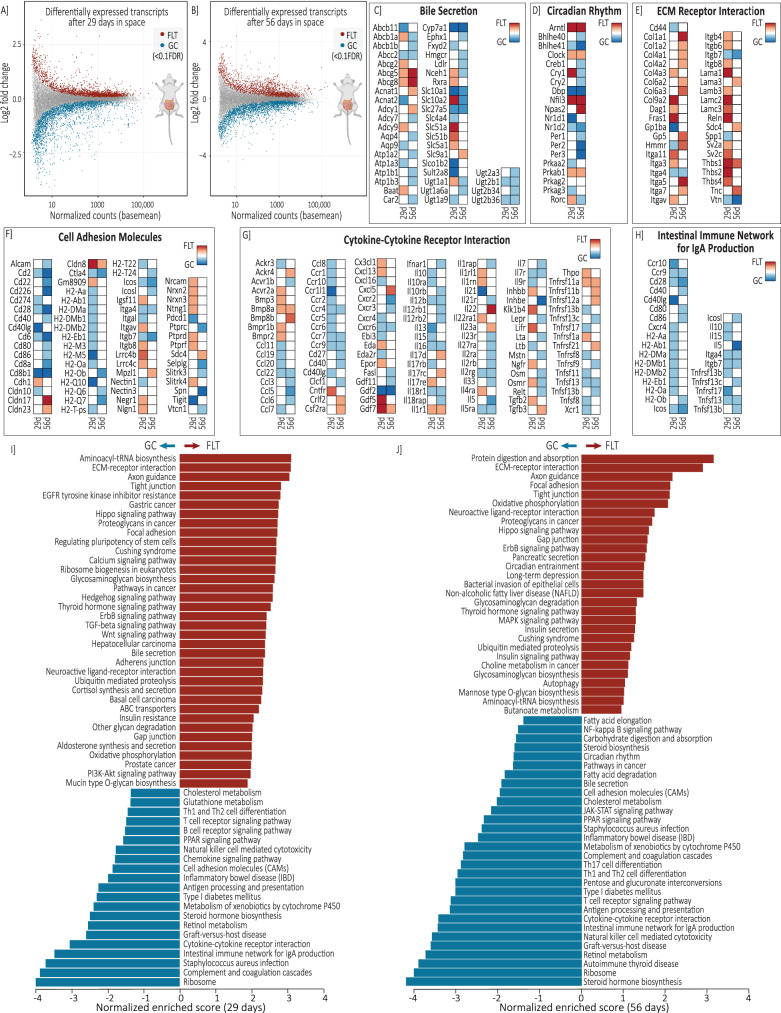
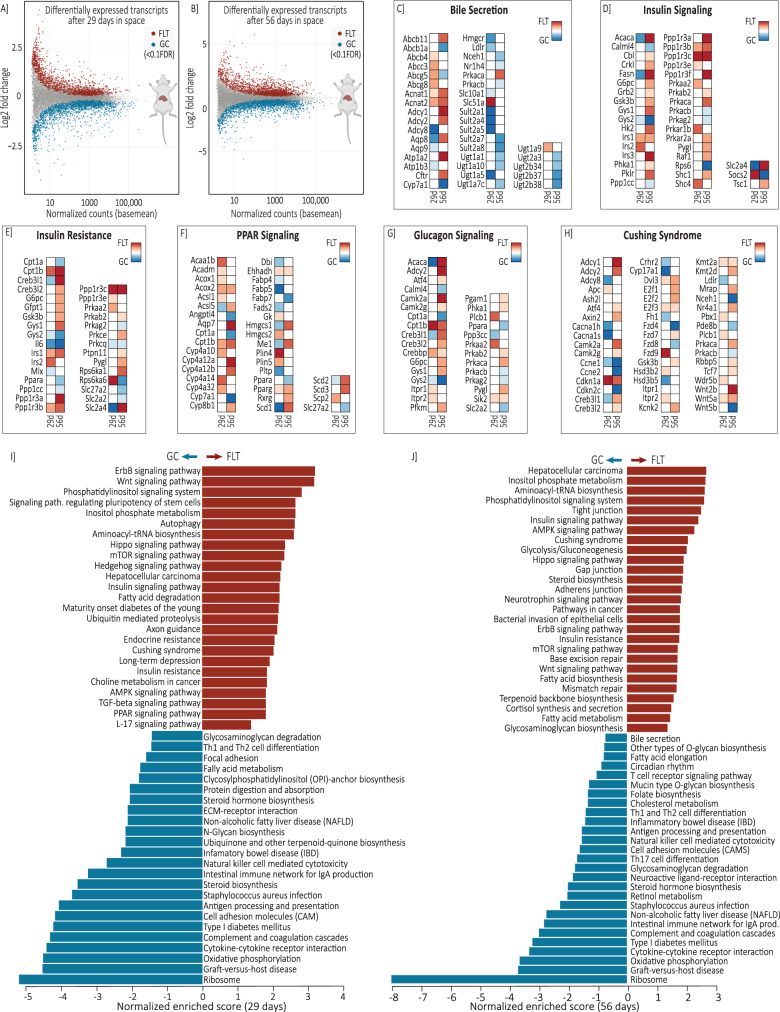
The ISS rodent habitat has provided crucial insights into the impact of spaceflight on mammals, inducing symptoms characteristic of liver disease, insulin resistance, osteopenia, and myopathy. Although these physiological responses can involve the microbiome on Earth, host-microbiota interactions during spaceflight are still being elucidated. We explore murine gut microbiota and host gene expression in the colon and liver after 29 and 56 days of spaceflight using multiomics. Metagenomics revealed significant changes in 44 microbiome species, including relative reductions in bile acid and butyrate metabolising bacteria like Extibacter muris and Dysosmobacter welbionis. Functional prediction indicate over-representation of fatty acid and bile acid metabolism, extracellular matrix interactions, and antibiotic resistance genes. Host gene expression described corresponding changes to bile acid and energy metabolism, and immune suppression. These changes imply that interactions at the host-gut microbiome interface contribute to spaceflight pathology and that these interactions might critically influence human health and long-duration spaceflight feasibility.


Conflict of interest statement

The authors declare no competing interests.

Figures

Fig. 1
Fig. 1. Experimental design.
A Analysis design of data from the Rodent Research 6 mission and B multiomic data analysis strategy. Figure created with BioRender.com.
Fig. 2
Fig. 2. Ground control, live animal return and ISS murine gut microbiome capture.
A Amplicon reads retained for GC_LAR, ISS_LAR, GC_ISS and FLT_ISS. B Flower diagram illustrating amplicon phyla diversity. C Amplicon annotation and count distribution summary statistics. D Amplicon (ESV) alpha diversity (Shannon Index) comparing GC_LAR to ISS_LAR, and GC_ISS to FLT_ISS. E Amplicon beta diversity using constrained ordination (Canonical Analysis of Principal Coordinates, CAP). F WMS (Whole Metagenome Sequencing) back-mapping percentages for GC_LAR, ISS_LAR, GC_ISS and FLT_ISS. G Flower diagram illustrating WMS taxonomic diversity. H WMS annotation and count distribution summary statistics. I WMS beta diversity using constrained ordination (CAP). Extended details in Supplementary data 1–3.
Fig. 3
Fig. 3. Spaceflight-associated significant microbiome alterations.
Significantly differentially abundant (DESeq2) ESVs between (A) GC_LAR and ISS_LAR, and (B) GC_ISS and FLT_ISS. Fold change (FC log2) in relative abundance. +/− INF (demarcated by the dashed red line) indicates ‘infinite’ fold change, where an ESV had detectable counts in samples from only one condition (structural zero). C Comparison of whole metagenome sequencing (WMS) detected species between LAR and ISS samples. D Distribution of counts across WMS taxonomy (Species to Kingdom, U = unknown). E, F Contig WMS MA plots with significantly differentially abundant (DESeq2) highlighted. G, H UMAP diagrams used to visualise contig clustering of selected species and (I, J) Significantly differentially abundant (DESeq2) species detected with WMS, node size illustrates contig number. Extended details in Supplementary Data 1–3. Amplicon sequencing: Species enriched in FLT_LAR mice compared to controls included Coprobacillus cateniformis, Dysosmobacter welbionis, Enterocloster aldenensis, Extibacter muris and Hungatella xylanolytica, while depleted species included Intestinimonas butyriciproducens and ESVs ambiguous to multiple Enterocloster species (including E.lavalensis) and Ligilactobacillus species (including L.murinus). Species enriched in FLT_ISS mice included D.welbionis, Eisenbergiella massiliensis, Enterocloster clostridioformis, E.muris, Guopingia tenuis, Romboutsia ilealis and Romboutsia timonensis, while depleted species included H.xylanolytica. WMS: Microbiome species significantly enriched in after 29 days of spaceflight comprised 14 Firmicutes, including Blautia pseudococcoides, Clostridioides difficile, C.cateniformis, D.welbionis, E.aldenensis, E.clostridioformis, E.muris, G.tenuis, Hungatella hathewayi, Ruthenibacterium lactatiformans, Schaedlerella arabinosiphila and the proteobacteria Delftia lacustris. Significantly depleted species included 20 firmicutes, including Acutalibacter muris, Anaerostipes caccae, Blautia wexlerae, Clostridium scindens, Enterococcus faecalis, Ligilactobacillus murinus, Enterocloster bolteae, E.lavalensis, Flavonifractor plautii, I.butyriciproducens, Lactococcus lactis and Staphylococcus xylosus, and the Proteobacteria Providencia rettgeri. These findings agreed with significant differential abundance of C.cateniformis, D.welbionis, E.aldenensis, E.clostridioformis, E.muris and I.butyriciproducens inferred from 16 S rRNA amplicon analysis and resolved species ambiguity for E.bolteae, E.lavalensis and L.murinus. Microbiome species which were significantly enriched in after 56 days of spaceflight comprised 14 Firmicutes, including B.pseudococcoides, C.difficile, D.welbionis, E.clostridioformis, Eisenbergiella massiliensis, E.muris, F.plautii, G.tenuis, H.hathewayi and R.lactatiformans. Significantly depleted species included 17 Firmicutes, including A.muris, Anaerostipes caccae, B.wexlerae, C.scindens, C.cateniformis, E.aldenensis, E.bolteae, E.lavalensis, L.lactis, S.arabinosiphila and as well as the Proteobacteria Escherichia coli, Shigella flexneri and Delftia lacustris.
Fig. 4
Fig. 4. Metagenomic functional prediction.
A Summary statistics from metagenomics functional prediction (further detail in Supplementary data 4). B GC_LAR vs FLT_LAR Over-representation analysis (ORA) of KEGG ontology (Brite, pathway and module) and (C) GC_ISS vs FLT_ISS ORA KEGG ontology. Changes in fatty acid pathways included Fatty acid biosynthesis (00061), Fatty acid metabolism (01212), Fatty acid degradation (00071) and Butanoate metabolism (00650), including butyryl CoA:acetate CoA transferase (EC 2.8.3.8) and butyrate kinase (EC:2.7.2.7). Over-representation of bile acid metabolism was reflected in Bile secretion (04976) and Cholesterol metabolism (04979) and Secondary bile acid biosynthesis pathways, including bile salt hydrolase (cbh, EC:3.5.1.24) and 3-oxocholoyl-CoA 4-desaturase (baiCD, EC:1.3.1.115). Over-representation of the antimicrobial resistance was represented in Brite ontology Antimicrobial resistance genes (ko01504) and the pathways for beta-Lactam resistance (01501), Biosynthesis of various antibiotics (00998) and Biosynthesis of vancomycin group antibiotics (01055). The Brite ontology Bacterial toxins (ko02042) was over-represented, including tight junction interacting zona occludens toxin (K10954), as well as the pathways Pathogenic Escherichia coli infection (05130) and Bacterial invasion of epithelial cells (05100). Diverse carbohydrate metabolism and ECM interacting pathways were represented by Galactose metabolism (00052), Mannose type O-glycan biosynthesis (00515), Glycosaminoglycan degradation (00531), Other glycan degradation (00511), ECM-receptor interaction (04512) as well as the Brite ontology of Glycosaminoglycan binding proteins (ko00536), Peptidoglycan biosynthesis and degradation proteins (ko01011) and Glycosyltransferases (ko01003). These included putative Mucin-associated glycosyl hydrolases (GHs), GH2s: β-galactosidase (EC:3.2.1.23), β-mannosidase (EC:3.2.1.25), β-glucuronidase (EC:3.2.1.31), α-l-arabinofuranosidase (EC:3.2.1.55), β-xylosidase (EC:3.2.1.37), β-glucosidase (EC:3.2.1.21), GH20: β-hexosaminidase (EC:3.2.1.52), GH29: α-l-fucosidase (EC:3.2.1.51), and GH84: N-acetyl β-glucosaminidase (EC:3.2.1.52).
Fig. 5
Fig. 5. Microbiome-host interface: spaceflight alters colon gene expression.
MA plots showing (A) GC_LAR vs FLT_LAR (29 days of spaceflight) and (B) GC_ISS vs FLT_ISS (56 days of spaceflight) differentially expressed genes in the colon (FDR <0.1). CH Differentially expressed gene from select KEGG pathways of interest, (I) Significant Gene Set Enrichment Analysis (GSEA) 29 days (modified from WebGestalt) and (J) Significant GSEA 56 days spaceflight. Full DE gene list is available in Supplementary data 5 and select KEGG pathways of interest with differentially expressed gene highlighted are available in Supplementary Figs. 9–14. Gene set enrichment analysis (GSEA) revealed consistent responses at a pathway level between 29 days and 56 days of spaceflight. This included widespread downregulation of the components of the intestinal immune system after spaceflight, including intestinal immune network for IgA production, antigen processing and presentation, Th1 and Th2 cell differentiation, PARR signalling metabolism of xenobiotics, Staphylococcus aureus infection, T cell receptor signalling, natural killer cell mediated cytotoxicity, graft-vs-host disease and cytokine-cytokine receptor interactions pathways, as well as downregulation of cholesterol pathways, including cholesterol metabolism and steroid hormone biosynthesis. Spaceflight also led to common upregulation of pathways associated to intestinal extracellular matrix (ECM) remodelling, including ECM-receptor interactions, focal adhesion, tight junction, gap junction pathways, and cortisol production represented through the Cushing syndrome pathway. The bile secretion pathway was significantly upregulated after 29 days of spaceflight, but downregulated after 56 days, suggesting bile acid dynamics should be explored at the gene level. Similarly, mucin type O-glycan biosynthesis, pathways in cancer and insulin resistance were only upregulated at the pathway level after 29 days of spaceflight, while bacterial invasion of epithelial cells, NAFLD, butonoate metabolism, insulin secretion and insulin signalling pathways were upregulated and the circadian rhythm pathway was downregulated after only 56 days of spaceflight.
Fig. 6
Fig. 6. Microbiome-host metabolism: spaceflight alters liver gene expression.
MA plots showing (A) GC_LAR vs FLT_LAR (29 days of spaceflight) and (B) GC_ISS vs FLT_ISS (56 days of spaceflight) differentially expressed genes in the liver (FDR <0.1). CH Differentially expressed gene from select KEGG pathways of interest, (I) Significant Gene Set Enrichment Analysis (GSEA) 29 days (modified from WebGestalt), and (J) Significant GSEA 56 days spaceflight. Full DE gene list is available in Supplementary data 5 and select KEGG pathways of interest with differentially expressed gene highlighted are available in Supplementary Figs. 17–21. GSEA of liver tissue responses also revealed highly consistent responses at the pathway level to 29 and 56 days of spaceflight. These comprised downregulation of immune response pathways, similar to those seen in the intestine, as well as steroid metabolism, type I diabetes mellitus, inflammatory bowel disease and NAFLD. Spaceflight also led to common upregulation of insulin resistance, Hippo signalling, inositol phosphate metabolism, Cushing syndrome and hepatocellular cancer pathways at both 29 and 56 days. Certain pathways were different over time. After 29 days of spaceflight, long-term depression and maturity onset diabetes of the young pathways were upregulated, whereas after 56 days, bile secretion and circadian rhythm were downregulated, while glycolysis/gluconeogenesis pathway were upregulated.

References

    1. ISECG. 3. The International Space Exploration Coordination Group.https://www.globalspaceexploration.org/ (2018).
    1. ISECG. Washington National Aeronautics and Space Administration Headquarters.https://www.nasa.gov (2022).
    1. National Aeronautics and Space Administration (NASA). Fiscal Year 2023 Budget Estimates. Retrieved from https://www.nasa.gov/wp-content/uploads/2023/07/nasa-fy-2023-agencyfact-... (Washington, D.C.: NASA, 2022).
    1. National Aeronautics and Space Administration (NASA). Moon to Mars Objectives. Washington, D.C.:NASA. Retrieved from https://www.nasa.gov/sites/default/files/atoms/files/m2m-objectives-exec... (Washington, D.C.:NASA, 2022).
    1. Stein, T., Schulter, M. & Boden, G. Development of insulin resistance by astronauts during spaceflight. Aviat. Space Environ. Med.65, 1091–1096 (1994). - PubMed

Substances

LinkOut - more resources