. 2024 Aug 29;15(1):7495.
doi: 10.1038/s41467-024-51909-2.

XENTURION is a population-level multidimensional resource of xenografts and tumoroids from metastatic colorectal cancer patients

Affiliations

XENTURION is a population-level multidimensional resource of xenografts and tumoroids from metastatic colorectal cancer patients

Simonetta M Leto et al. Nat Commun. .

Abstract

The breadth and depth at which cancer models are interrogated contribute to the successful clinical translation of drug discovery efforts. In colorectal cancer (CRC), model availability is limited by a dearth of large-scale collections of patient-derived xenografts (PDXs) and paired tumoroids from metastatic disease, where experimental therapies are typically tested. Here we introduce XENTURION, an open-science resource offering a platform of 128 PDX models from patients with metastatic CRC, along with matched PDX-derived tumoroids. Multidimensional omics analyses indicate that tumoroids retain extensive molecular fidelity with parental PDXs. A tumoroid-based trial with the anti-EGFR antibody cetuximab reveals variable sensitivities that are consistent with clinical response biomarkers, mirror tumor growth changes in matched PDXs, and recapitulate EGFR genetic deletion outcomes. Inhibition of adaptive signals upregulated by EGFR blockade increases the magnitude of cetuximab response. These findings illustrate the potential of large living biobanks, providing avenues for molecularly informed preclinical research in oncology.


Conflict of interest statement

L.T. has received research grants from Menarini, Merck KGaA, Merus, Pfizer, Servier, and Symphogen. The other authors declare no conflicts.

Figures

Fig. 1
Fig. 1. Facts and figures of XENTURION.
A Schematic overview of XENTURION experimental design. Matched PDXTs and PDXs were subjected to comparative mutational, gene copy number and transcriptomic analyses. Molecular annotation was paralleled by systematic assessment of ex vivo and in vivo response to cetuximab. Post-cetuximab transcriptomic profiles were leveraged to extract upregulated genes potentially involved in adaptive resistance to EGFR blockade. Compounds against candidate targets were tested in a stepwise drug screen, and those that proved effective in PDXT assays underwent final validation in PDXs. B, C Success rate in the early derivation of tumoroid lines according to the nature of the sample of origin (B) or the number of derivation attempts (C). When early-stage tumoroids were derived from different originating samples (e.g., fresh and frozen PDX explants), success rates were computed for models derived from freshly explanted tumors. SR success rate. D Number of validated tumoroids according to the number of freeze-thaw cycles. E Main clinical and molecular features of the starting population from which tumoroid derivation was attempted. The circus plot includes all quality-checked cases with successful validation (n = 133), those that failed validation (n = 24), early-stage cases for which validation was not performed (Not perf, n = 29), and those that failed early derivation (n = 57). F female, M male, MSI-H microsatellite instability high, MSS microsatellite stability, NA not available, WT wild-type. F Odds ratios of a multivariate logistic regression with success status of PDXT early derivation and validation (1, successful, n = 129; 0, failed, n = 73) as dependent variable and several clinical and molecular annotations as independent variables. Red color indicates that the independent variable has a negative effect on the validation rate; blue color indicates the opposite. The only continuous variables are stage and age at collection; all other variables are binary. Confidence interval of odds ratios, 95%. Panel A was partly generated using adaptations of open-access pictures released under Creative Commons Attribution Licenses; see Figure preparation in the Methods for credits and details. Source data are provided as a Source Data file.
Fig. 2
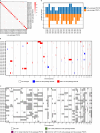
Fig. 2. Comparative landscape of somatic single nucleotide variations and indels in paired PDXTs and PDXs.
A Common and private alterations in 124 pairs of matched PDXTs and PDXs. One pair for which mutational data were available was excluded because no alterations with VAFs > 0.05 were detected. Genes without any alteration in the whole cohort were removed. The top barchart shows the total number of mutations for each sample. The barchart on the right shows the percentage of mutations for each gene in the cohort. B Jaccard similarity indexes of somatic alterations between 124 matched PDXs and PDXTs. C Gene-level population frequencies of mutational alterations in PDXTs versus those detected in the TCGA dataset or the MSK-IMPACT dataset; the inset shows that the correlation is not driven solely by genes with high mutational frequencies. Source data are provided as a Source Data file.
Fig. 3
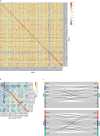
Fig. 3. Comparative copy number architecture in paired PDXTs and PDXs.
A Distribution of Pearson correlation coefficients between copy number profiles of matched (n = 125) and unmatched (n = 15,500) pairs of PDXTs and PDXs. B Autosomal copy number profiles of PDXTs (n = 125), expressed as segmented log2 ratio of the normalized read depth. Red and blue colors indicate gain and loss events, respectively. C Gene-level population frequencies of gain or loss events, as identified by GISTIC, in PDXTs versus those detected in the TCGA or the MSK-IMPACT datasets. Amp amplification, Del deletion. Source data are provided as a Source Data file.
Fig. 4
Fig. 4. Comparative genomic landscape in matched early- and late-passage PDXTs.
A Jaccard similarity indexes of somatic alterations (VAFs > 0.05) between 23 matched early- and late-passage PDXTs. The Jaccard index for model CRC1460 is 0, likely due to low tumor mutational burden (TMB) (1.96 mutations [muts] per mega base pairs [Mbps] in early-passage PDXTs and 2.13 muts/Mbps in late-passage counterparts; median TMB for all-early passage PDXTs, 5.4 muts/Mbps, IQR 4.5–6.1; median TMB for all late-passage PDXTs, 5.7 muts/Mbps, IQR 4.8–6.7). CRC1460 low TMB, coupled with variant annotation limited to PCGR tiers ≤ 3 (enriched for mutations with stronger potential relevance for cancer, see “Methods” section), resulted in detecting only a single alteration exclusively in the late-passage PDXT. B Comparison of autosomal copy number profiles between 23 matched early- and late-passage PDXTs. ‘No changes’ refers to stable or quasi-stable regions. ‘Losses in late-passage PDXTs’ are defined as loci with copy number ≤1 in the late-passage PDXTs and ≥2 in the early-passage counterparts. ‘Gains in late-passage PDXTs’ are defined as loci with copy number ≥5 in the late-passage PDXTs but not in the early-passage counterparts. The genome is represented by 100k base pair long bins; each row in the heatmap represents a pair of matched early- and late-passage PDXTs. C Comparison of LOH events between 23 matched early- and late-passage PDXTs. ‘No LOH’ indicates regions without LOH in both early- and late-passage pairs. ‘LOH newly detected in late-passage PDXTs’ indicates regions with newly acquired LOH events in the late-passage PDXTs that are not present in the early-passage counterparts. ‘LOH no longer detected in late-passage PDXTs’ indicates regions with LOH events detected in the early-passage PDXTs that are no longer detected in the late-passage counterparts. ‘Common LOH in both early- and late-passage PDXTs’ indicates regions with LOH events shared between sibling pairs. The genome is represented by 100k base pair long bins; each row in the heatmap represents a pair of matched early- and late-passage PDXTs. D Number of clusters (clones) inferred by PyClone-vi in 23 matched early- and late-passage PDXTs. Source data are provided as a Source Data file.
Fig. 5
Fig. 5. Comparative gene expression profiles and transcriptional subtype assignment in paired PDXTs and PDXs.
A Pearson correlations of gene expression profiles in matched PDXs and PDXTs. Pearson correlation coefficients were calculated for matched (n = 79) and unmatched (n = 6.162) pairs. B Pearson correlations of gene expression profiles in matched early- and late-passage PDXTs. Pearson correlation coefficients were calculated for matched (n = 23) and unmatched (n = 506) pairs. C CMS and CRIS subtype assignment in 79 pairs of matched PDXTs and PDXs. NC non-classified. Source data are provided as a Source Data file.
Fig. 6
Fig. 6. Comparative annotation of cetuximab response profiles in paired PDXTs and PDXs.
A Correlation of cetuximab response between values of endpoint ATP content (relative cell number) and values obtained by longitudinal cell imaging (relative tumoroid total area) in 116 PDXTs plated at different cell densities and treated with cetuximab (20 μg/ml) for one week. Each dot represents one single experiment performed in biological triplicate. Responses were assessed in 116 models for 5000 and 20,000 cells/well, and 102 models for 1250 cells/well. The shaded area represents the confidence interval of linear model prediction, 95%. B Correlation of cetuximab response in 79 pairs of matched PDXTs and PDXs. Response in PDXTs was evaluated as the ratio of viable cells after one week of treatment (20 μg/ml cetuximab, 5000 cells/well in a 96-well format) to untreated controls; response in matched PDXs implanted in both male and female NOD-SCID mice was evaluated as the percentage of tumor volume variation after three weeks of treatment (20 mg/kg, intraperitoneal injection twice a week) compared with tumor volume the day before treatment initiation. The shaded area represents the confidence interval of linear model prediction, 95%. C ROC curve showing the performance of PDXT-based results in predicting cetuximab response in vivo in 79 pairs. AUC, 0.81; responders (target prediction), 17; non-responders, 62. D EGFR KO scores for 13 PDXTs, distributed according to cetuximab sensitivity (black dots). Results are the average of the mean effect size of two sgRNAs against EGFR in two independent experiments, each performed in biological triplicates (with the exception of CRC0148, which was tested in three independent experiments). KO knockout, WT wild-type, amp amplification, mut mutation. Source data are provided as a Source Data file.
Fig. 7
Fig. 7. Drug screen in PDXTs.
A Correlation of transcript changes between 33 PDXs exposed to cetuximab for three days (n = 28) or six weeks (n = 6) and 12 PDXTs exposed to cetuximab for three days. The scatterplot shows log-fold changes (LogFC) between treated and untreated samples for 19,716 genes. Color shading reflects differential expression P values, obtained with DESeq2. Statistical analysis by two-sided Wald test followed by Benjamini-Hochberg multiple comparison correction. B Maximum inhibition scores for 13 drugs tested in three PDXTs. PDXTs were treated for 48 h (5000 cells/well) in three independent experiments in biological triplicates. Maximum inhibition score was the difference between the viability of untreated cells and that at maximum drug dosage, normalized against the viability of untreated cells and averaged for results of the three independent experiments. Maximum drug dosage: HTH-02-006, 16 μM; vorinostat, 10 μM; SBI-0206965, 20 μM; vismodegib, 50 μM; A922500, 100 μM; MRX-2483, 1 μM; BP-1-102, 1 μM; OSMI-4, 20 μM; crenigacestat, 5 μM; pemigatinib, 1 μM; tomivosertib, 5 μM; TG003, 50 μM; cilastatin, 0.5 μM. Drug targets are specified. C Cell viability in 12 PDXTs treated for 3 weeks (CRC0059 and CRC0322, 1000 cells/well) or 1 week (all other models) with SBI-0206965 (10 µM), HTH-02-006 (4 µM), and vorinostat (1.25 µM), alone or with cetuximab (20 µg/ml, one-week treatments; 5 µg/ml, three-week treatments). Two independent experiments in biological triplicates were performed. Heatmap signals were normalized to the sum of the values of the corresponding experiments and reported as a fraction of the maximum value reached by single models. Statistical analysis by repeated measures one-way ANOVA followed by Šídák’s multiple comparison test using the aggregated average value of replicates for each PDXT model (n = 12): cetuximab versus cetuximab + SBI-0206965, P < 0.0001; SBI-0206965 versus cetuximab + SBI-0206965, P = 0.0021; cetuximab versus cetuximab + HTH-02-006, P < 0.0001; HTH-02-006 versus cetuximab + HTH-02-006, P = 0.0027; cetuximab versus cetuximab + vorinostat, P < 0.0001; vorinostat versus cetuximab + vorinostat, P = 0.0006. Cet cetuximab, HTH HTH-02-006, SBI SBI-0206965, Vori vorinostat. Source data are provided as a Source Data file.
Fig. 8
Fig. 8. Drug screen validation in representative PDXs.
Tumor volume changes in PDXs implanted in female NOD-SCID mice and exposed to the indicated modalities for 4 weeks. Cetuximab, 20 mg/kg (intraperitoneal injection twice a week); HTH-02-006, 10 mg/kg (intraperitoneal injection twice a day); SBI-0206965, 20 mg/kg (intraperitoneal injection three times a week); vorinostat, 50 mg/kg (intraperitoneal injection three times a week). Dots represent volume changes of PDXs from individual mice, and plots show the means ± SD for each treatment arm. n = 6 for CRC0322 and CRC1331 models exposed to HTH-02-006 + cetuximab; n = 9 for CRC0322 model exposed to cetuximab or SBI-0206965 + cetuximab; n = 10 for CRC1331 model exposed to cetuximab or vorinostat + cetuximab. Tumor volume changes of the placebo arm are shown in Supplementary Fig. 18. Statistical analysis by two-tailed unpaired t test with Welch’s correction. Cet cetuximab, HTH HTH-02-006, SBI SBI-0206965, Vori vorinostat. Source data are provided as a Source Data file.

References

    1. van de Wetering, M. et al. Prospective derivation of a living organoid biobank of colorectal cancer patients. Cell161, 933–945 (2015). 10.1016/j.cell.2015.03.053 - DOI - PMC - PubMed
    1. van Renterghem, A. W. J., van de Haar, J. & Voest, E. E. Functional precision oncology using patient-derived assays: bridging genotype and phenotype. Nat. Rev. Clin. Oncol.20, 305–317 (2023). 10.1038/s41571-023-00745-2 - DOI - PubMed
    1. Bose, S. et al. A path to translation: how 3D patient tumor avatars enable next generation precision oncology. Cancer Cell40, 1448–1453 (2022). 10.1016/j.ccell.2022.09.017 - DOI - PMC - PubMed
    1. Sasaki, N. & Clevers, H. Studying cellular heterogeneity and drug sensitivity in colorectal cancer using organoid technology. Curr. Opin. Genet. Dev.52, 117–122 (2018). 10.1016/j.gde.2018.09.001 - DOI - PubMed
    1. Avolio, M. & Trusolino, L. Rational treatment of metastatic colorectal cancer: a reverse tale of men, mice, and culture dishes. Cancer Discov.11, 1644–1660 (2021). 10.1158/2159-8290.CD-20-1531 - DOI - PubMed